Watch the Market tutorial videos on YouTube
How to buy а trading robot or an indicator
Run your EA on
virtual hosting
virtual hosting
Test аn indicator/trading robot before buying
Want to earn in the Market?
How to present a product for a sell-through
Expert Advisors and Indicators for MetaTrader 4 - 58
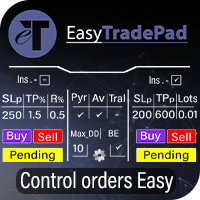
EasyTradePad trading panel for MetaTrader 4 is trading panel for manual / semi-automatic trading. Working with positions and orders, calculating money management in one click!
The panel will definitely help you:
open a trade with the exact risk that you yourself specify in% or in the currency of the deposit save profit by moving stop loss to no loss average the trade by smoothing out the market volatility add a position along the trend if the trade goes in your direction squeeze the maximum

OrderCalc opens a window in the chart with the data of your orders:
Position size, stop loss, take profit, profit/loss
Only the positions for this symbol are displayed. If several positions exist, these are totalled and displayed in the last line. If you work with pyramids, you can see at a glance how big the total profit or loss is.
The indicator is invisible at the beginning, only when a position is opened does a window open containing the data for the order. In some cases the content is e
FREE

X-axis lines prevail in grid manner, ruled by Average True Range. There’s an inevitable change in specific periods of time of this matter! The Average True Range (ATR) indicator is not directly based on volume; instead, measures volatility in price movements. This indicator original in its revealing customization, stretches, expand, shrink, and evolve with 4 timely choices of grid states! MATR means “multiplying average true range” in which grandeurs the grid pip-distant levels, seeming to g
FREE

This Expert Advisor is our latest trading system and it is designed to work with EURUSD and GBPUSD . This EA produces good results with medium spreads. It opens a market order following the market trend and then it opens Market Orders with different amount of lots to close all orders or single order in profit with small amounts. To close trades, it uses a cumulated closing function or a closing function for each trade opened. It works with all time frames, better with lower TF, and you can us
FREE

This is the demo version of my Expert Advisor " Take a Break ". All EA operations are limited to 1 chart symbol only. The most advanced news filter on MQL market Take a Break has transformed from a basic news filter into a comprehensive account protection solution. It seamlessly pauses any other Expert Advisors during news events or based on your custom filters, all while safeguarding your EA settings - restoring them automatically when trading resumes for complete peace of mind. Typical use ca
FREE
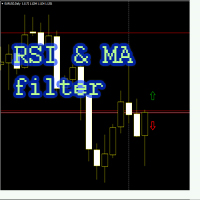
Советник "RSI and MA filter" торгует по индикатору RSI, использует фильтр в качестве двух средних скользящих (быстрая MA выше медленной MA - покупка, продажа - наоборот), по желанию Пользователя применяется мартингейл (количество умножения лота при серии убытков ограничивается), безубыток, трейлинг стоп, инвертирование сигнала. Настройки советника: Индикатор RSI: RSI_Period = 14; используемый период индикатора
RSI_Shift = 1; номер свечи выбранного графика, с которой советник берет сигнал, 0 -ор
FREE

After 7 years, I've decided to release some of my own indicators and Expert Advisors (EAs) for free.
If you find them useful, please Show support with a 5-star rating! Your feedback motivates me to continue providing free tools. Explore my other free tools as well here .
_________________________________ ATR with Bands Indicator for Enhanced Market Volatility Analysis Introducing the ATR with Bands Indicator, expertly developed in MQL5, designed to take your forex market analysis
FREE

Candle size oscillator is an easy to use tool to figure out candle size from highest to lowest price of each candle. It's a powerful tool for price action analysts specifically for those who works intraday charts and also a perfect tool for short term swing traders. Kindly note that you can also edit the Bullish and Bearish candles with different colors.
#Tags: Candle size, oscillator, price action, price range, high to low, candle ticks __________________________________________________________
FREE

Fibonacci retracement is really one of the most reliable technical analysis tools used by traders. The main problem with using these levels in trading is that you need to wait until the end of the impulse movement to calculate the retracement levels, making difficult to take a position for limited retracement (0.236 or 0.382). Fibo Dynamic solves this problem. Once the impulse movement is identified the retracement levels are automatically updated allowing very dynamic trading in trends with onl
FREE

Classic Range BreakOut Expert Advisor "The opening range breakout strategy is a logical and repeatable strategy that involves traders building firm market direction biases after price breaks above or below the market defined opening price range of a session"
You can select the number of bars and width in pips. Works in all pairs. RECOMMENDED: test first in a Demo account for 1 or 2 weeks.
FREE

Key Features: Type of Indicator: Line Break Chart Indicator Usage: Identifying trend reversals and potential market turning points. Input Parameters: The primary input parameter is 'Lines_Break,' which represents the number of lines the price needs to move to create a new line in the opposite direction. How it works: The indicator draws green and red histogram bars to represent the line break chart. Green bars indicate an upward trend, and red bars indicate a downward trend. The indicator calcul
FREE

Strong and weak Pairs is a trend following indicator to help you choosing the pairs to trade based on the currency score. Strong and weak Pairs is comparing currencies position to the moving average for all major pairs then display the position score from Zero (0) to Seven (7) with two lines on the chart. 7 is the strongest currency and zero is the weakest currency. Additionally there is a dashboard displaying all the currencies score to choose the pair you will trade. Strong and Weak Indicator
FREE

Attention, for the indicator to work correctly, you need to put the "MQL5" folder in your terminal folder, you can download it from the link below: https://disk.yandex.ru/d/DPyo0ntaevi_2A
One of the best arrow indicators for Binary Options, which can also be used in the Forex market. Any time frame from M1 to MN, any currency pair, can also be used on stocks - the indicator is universal. Expiration from 1 to 5 candles. Displays traffic statistics on a graph. The indicator gives signals along th
FREE

Trading Simulator for Backtesting This Robot was designed as a trading simulator for backtesting , allowing you to open and close trades directly in the testing environment. With this EA, you can: Manage trades with Take Profit and Stop Loss based on chart lines that act as closing prices. Assess your strategy's profitability and improve your trading skills. It’s a simple yet powerful tool to help you see how profitable you can be in trading. Coming Soon! We will release a more a
FREE

It's an expert to use prices action and trade level to open each order. Expert can to trade up 12 pairs, uses the corresponding default setting for each pair.
Default settings are good for EURUSD pair and IC Markets broker.
Time Frame: H1
Parameters
PresetsParameters = Uses prosets parameters (12 pairs). Broker GMT Offset = Set broker different time from GMT time. Time Frame Use = Time frame of chart to run expert. Type Of Signals = Mode of signals. Time Set Levels = Time set levels to trade.
FREE

This EA will open Buy and Sell simultaneously after attached to chart. It has customized grouping grid step and lot multiplier group. Please contact me if you have any question. Please Like, Share & Subscribe to my Youtube Channel. I will give this FULL VERSION EA for FREE for everyone if there is 2k Subscriber on my Youtube channel , please ask your friend, because subscribe is FREE :).
Need at least 10k balance (10k cent or 10k$), or you can adjust with various setting inside the EA to get th
FREE

UniversalFiboChannel is a universal indicator, it builds a trading channel according to Fibonacci levels. This indicator is a full-fledged channel trading strategy. The indicator is installed in the usual way and works with any trading tool. Options HelpBasisTF = "M: 43200; W: 10080; D1: 1440; H4: 240; H1: 60" is a hint for the BasisTF parameter
BasisTF = 1440 - base period for calculating Fibonacci levels DisplayDecimals = 5 - the number of decimal places of the price of the trading instrumen
FREE

Advantages of the Tick Volume Indicator: Identifying Market Sentiment : A predominance of green bars on the histogram may indicate an uptrend or strong buying pressure, useful for determining entry points for long positions. A predominance of red bars indicates a downtrend or strong selling pressure, useful for determining entry points for short positions. Analyzing Market Activity : The indicator helps identify periods of high activity, when significant changes are occurring in the market, and
FREE

The DJ_15_811543657_S_BB_CF_SQX is an algorithmic trading strategy for MetaTrader, tested on DJ using the M15 timeframe from December 7, 2017, to June 2, 2023. There is no need to set up parameters, all settings are already optimized and fine-tuned.
Recommended broker RoboForex because of EET timezone.
You can find the strategy source code for StrategyQuant at the link: https://quantmonitor.net/dow-jones-bollinger-breaker/
Key details are:
MagicNumber: 811543657
Main Chart: Current s
FREE

This indicator show all history orders on chart with the same symbol. It help you see time and price that orders opened and closed. 1) Show all history 2) Open chart with symbol that you need to watch 3) Attach the indicator 4) Press key "h" -Downwards line Blue: sell with profit -Downwards line Red: buy with loss -Upwards line Blue: buy with profit -Upwards line Red: sell with loss.
FREE

ADR 20 mostra l'intervallo medio di pips di una coppia Forex, misurato su un numero di 20 giorni . I traders possono utilizzarlo per visualizzare la potenziale azione dei prezzi al di fuori del movimento medio giornaliero.
Quando l'ADR è al di sopra della media, significa che la volatilità giornaliera è superiore al normale, il che implica che la coppia di valute potrebbe estendersi oltre la sua norma.
L'ADR è utile anche per il trading di inversioni intraday. Ad esempio, se una coppia di valu
FREE

A stochastic oscillator is a momentum indicator comparing a particular closing price of a security to a range of its prices over a certain period of time. The sensitivity of the oscillator to market movements is reducible by adjusting that time period or by taking a moving average of the result. It is used to generate overbought and oversold trading signals, utilizing a 0-100 bounded range of values. This indicator show 15 stochastic on one chart.
FREE

Suitable for multi time frame market direction prediction. Green and red color indicate the buy and sell call respectively. Green indicator is denote buy call and Red indicator denote the sell call. push notification is available to send instant message to you when green or red indicator will be appear. you have to activate the option at the time of mapping this indicator to you chart
FREE

After 7 years I decided to release some of my own indicators and EAs for free.
If you find them useful please Show support with a 5-star rating! Your feedback keeps the free tools coming! See other my free tools as well here
_________________________________ Bollinger Bandwidth Indicator for Advanced Market Volatility Analysis The Bollinger Bandwidth Indicator, meticulously developed in MQL4, is a sophisticated tool designed to elevate forex trading analysis. It harnesses the
FREE
This Expert Advisor monitors all open trades and saves them to a CSV file whenever a change is detected. It’s a lightweight tool for exporting trade data from MetaTrader 4 in real time. What it does: Monitors all open positions on the terminal Detects changes (order type, volume, price, SL, TP, etc.) Writes updated trade data to a .csv file ( TradeCopy.csv ) Includes order ID, symbol, type, lot size, price, SL, and TP Saves files in the Common Files folder for easy access by other applications H
FREE

Th3Eng Panda trend is a powerful indicator that works perfectly for scalping trades as well as swing trades. Th3Eng Panda trend is not just an indicator, but a very good trend filter. You can setup it on H4/H1 to Find the main trend and start scalping on M5/m15/m30 Time Frames. Works with all pairs and all Time Frames.
Inputs:
Section #1 History : Maximum number or bars to draw the last signals. (Default 5000) Draw Candles : Draw red candle when sell signal and green when buy signal. (true
FREE

The Time Zone indicator allows users to set specific time periods for major trading sessions (Asian, European, North American) and display them with distinct colors on the chart. Users can choose how many days of trading zones to show, set the start and end times for each session, and define the color to represent each trading period. The chart refreshes at user-defined intervals to ensure the time zone data is accurate and current. Key Features: Display Trading Zones: Users can choose to
FREE

With this indicator, you can easily make price regions in all time zones. In addition, with the automatic supply demand finder, you can ensure that the new regions are found automatically. You can increase your transaction quality by reaching more accurate operations with this auxiliary Tool and indicator.
I share your trial version of EURUSD for free with you. If you want to buy the working version in all parities, you can contact me. +New version Gap Bar Add ( Press G keyboard ) Default con
FREE
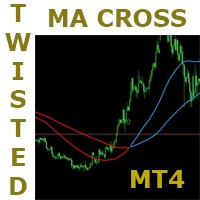
This is a very simple but very powerful strategy. It has a lot of potential. This strategy is based on the popular moving average crossover but with a very interesting twist to it. It has some mechanisms to delay signals untill direction is clear and confirmed. Follow the indication colors and arrows for trade ideas It has a potential winning rate of somewhat greater than 70%. Try it in all timeframes and determine which one is good for you. ===========
FREE

MetaTrader to Prometheus Exporter Optimize your trading by easily exporting your MetaTrader data to Prometheus and transform it into powerful visual insights through Grafana dashboards. This utility bridges the gap between your trading platform and modern monitoring solutions.
Key Features:
Automatic export of trading metrics from MetaTrader (MT4/MT5) Full Prometheus format compatibility for immediate integration Simple and flexible metric configuration Low performance impact on MetaTrader Su
FREE

Diversify the risk in your trading account by combining our Expert Advisors. Build your own custom trading system here: Simple Forex Trading Strategies
The expert advisor opens trades when the SMAs cross and when the WPR has left overbought/oversold areas. The SMAs are also programmed to close the trades if the trend changes. The Stop Loss, Take Profit, and Trailing Stop are calculated based on the ATR indicator. The recommended currency pair is NZDUSD and the recommended timeframe to operat
FREE

The "Gold Trader Pro Indicator" is an advanced technical analysis tool for the MetaTrader 4 platform, designed to help you make informed trading decisions about gold. Using a combination of moving averages, RSI, ADX, MACD, and volume analysis, this indicator provides clear trading signals across multiple timeframes, including M5, M15, M30, H1, H4, and D1. Main Features Multi-Timeframe Analysis : Confirms trading signals between lower and higher timeframes for improved accuracy. Buy and Sell Sig
FREE

Please contact me at telegram https://t.me/smartforex7 After purchasing SmartForex Indicator then Use This Indicator...................... SMART EXIT PROFIT LINE Indicator is very Helpful with SmartForex Indicator ........................................ SMART EXIT PROFIT LINE Indicator Attach with SmartForex Indicator after then Red Line Show Exit buy Profit , Green Line show Exit Sell Profit................
FREE
Drawdown Control (DC) is a helpful utility that can be used like an EA to limit the drawdown of any MT4 account . You can choose between different, fully customizable options of how DC must react if the drawdown reaches critical levels. To utilize the symbol with the most ticks per minute it is highly recommended to put the product on a EURUSD-M1 chart.
Input Parameters Equity / Balance in % to stop trading (0 = disabled) : 85.0 [etc.] Current Balance / Initial BalanceHW in % (0 = disabled) : 6

This EA is a free version of Vino EA . Unlike the full version, the parameters cannot be changed and the lot size is set to 0.01.
Description Vino EA is a grid Expert Advisor using mainly customized oscillators to analyze the market prices and volatility in order to identify trend reversals. It uses a grid of orders which increases the lot size only after the stop loss is reached. It includes an automatic stop loss, which computes the stop loss value based on the volatility of prices.
Require
FREE
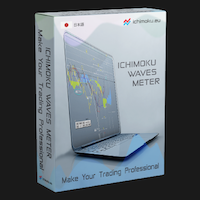
The professional utilities "Ichimoku Waves Meter" to analyse graphs using the correct interpretation of Ichimoku kinkōhyō!
Is a graphic program that allows traders to quickly and easily measure the proportions between the indicated points on the price graph. This time and price indicator is a basic tool for analysing the chart according to the Ichimoku strategy on the MT4 platform. Using this tool allows an insightful and complete analysis of time waves as well as price waves in a very short ti
FREE

Note: This is a Limited Edition of Lion Grid . It works only on Mondays.
The trading strategy has been been created by using machine learning algorithms to build a model directly from the historical data. Machine learning is an application of artificial intelligence (AI) that provides the ability to automatically learn and improve from experience without being explicitly programmed. The strategic focus of this robot is to identify trend reversals by analyzing multiple technical indicators (
FREE

Binary Win 60 Description of the Binary Win 60 Indicator for MT4 Binary Win 60 is a professional tool for binary options trading, designed to operate on the M5 (5-minute) timeframe. The indicator is ideal for trading popular currency pairs, such as: AUDCAD, AUDNZD, CHFJPY, EURCAD, EURAUD, EURCHF, EURGBP, EURNZD, GBPAUD, GBPJPY, GBPUSD, USDJPY. Key Features: Clear arrow signals: Green arrow — Buy option signal. Red arrow — Sell option signal. Instant alerts: When a signal appears, the in

The Commitments of Traders Ratio Indicator is one of these things you never thought about it before you really see the magic behind it. The indicator shows the Ratio of long/short positions released by the CFTC once a week.
If you have a look on the Sreenshot you can see two (three) zones of interest. Zone 1: The Switches (Red -> Green, Green -> Red) Zone 2: MA cross Zone 3: If you combine this with the COX indicator an additional zone will appear. You also can experiment with Ratio crossing MA
FREE
Vanesa RSI Reverse provides an amazing trading strategy. Use optimization function of Strategy Tester in MetaTrader 4 to find out many high potential parameter sets in very long term of history data (more than 2 years). The EA works well with XAUUSD in M15 but it also give similar results in others symbols and time frame. It just takes some minutes to try it out in your own history data to see the very good performance. We will continue to improve the strategy to get better performance in next v
FREE

It's an expert to open and close orders on specific day and time. Expert open and close orders only with the same symbol it attached. Can set time open and close orders based day of year or day of week. Expert can send market orders and pending (stop or limit). Each order can placed with take profit and stop loss. There is option to use trailing stop loss and break even. Expert can manage only own orders or all orders of account.
Information about the expert's parameters can find on the blog .
FREE
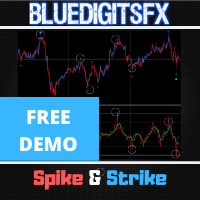
NOTE : This Free version only works for the EURUSD & AUDUSD Symbol !
MT4 Version Available Here: https://www.mql5.com/en/market/product/43438
MT5 Version Available Here: https://www.mql5.com/en/market/product/50255
Telegram Channel & Group : https://t.me/bluedigitsfx
V.I.P Group Access: Send Payment Proof to our Inbox
Recommended Broker: https://eb4.app/BDFXOsprey
* Breakthrough Solution For Reversal Trading And Filtering With All Important Features Built Inside One Tool! BlueDi
FREE
This is a classic Expert Advisor with the most popular trading functions. But the main feature is that the Expert Advisor is completely generated with the help of a script according to the signals of an arrow indicator. You can get the same EA, but which will enter on your indicator . And with full source code and the possibility of unlimited use, including sale on Market. This version with a full set of functions, but in the process of creating an EA, you can form your own set of settings.
FREE

This is an example of how the MetaTrader terminals's Strategy Tester can help to find good input parameters for an old and widely known MACD Sample Expert Advisor, which is available in the Navigator window (tab: Expert Advisors).
Input parameters Indicator MACD: fast - fast Period; slow - Slow Period; sign - Signal Period; appPrice - PRICE_CLOSE=0; PRICE_OPEN=1; PRICE_HIGH=2; PRICE_LOW=3; PRICE_MEDIAN=4; PRICE_TYPICAL=5; PRICE_WEIGHTED=6; MACDOpenLevel ; MACDCloseLevel ; Indicator Moving Avera
FREE

Qv² OBOS is an indicator that aims to identify overbought and oversold regions considering price standard deviation and volume analysis.
Oversold signals are indicated by arrows pointing upwards.
Overbought signals are indicated by arrows pointing downwards. Can be used in all timeframes. Can be used on all pairs. I use in H1 Important note, the histogram is displayed to improve the trader's analysis. But the signs of overbought and oversold are the arrows as mentioned above.
Important note:
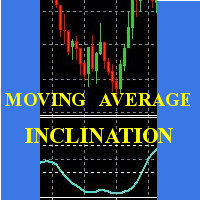
Scalp using the behavior of a short moving average, the indicator gives the slope and identifies the "hyper" moments.
Operational advice:
Use M1 chart. Period 20 : open buy after two rising lows; sell after two max downhill; avoid countertrend openings; when the line goes flat put a stop at the opening price. Avoid actions in low volatility timeslots. When the curve that draws the min / max is very flat, it is better to postpone at least 15'.
Period 50 : matches the trend, when it is at the
FREE

THE PLATE EA IC Market or FTMO Recomment Broker.
This EA „PLATE“ BUY and SELL in one.
Only DE40 with this Standart Settings (You can Change the Take Profit to 500 for other Endpoints or the Stopp Loss to 60 or higher)
M1, M5, M15, M30, H1.
Minumum 1000$/€ ...Lot 1 in first Week. The EA work with a small Stop Loss and a good Take Profit Risk Ratio. When you a undecided or have any Question write me a Message.
FREE

This Dashboard is free to download but is dependent on you owning the Advanced Trend Breaker . Get the indicator here: https://www.mql5.com/en/market/product/66335
The Dashboard will show you on a single chart all the timeframes (M1 to Monthly) with their own status for the indicator: Advanced Trend Breaker
all time frame and all symbol: smart algorithm detects the trend,Support and resistance, filters out market noise and find breaker of entry signals!!!
!!!
How to understand th
FREE

Key Level Key Level is a MetaTrader 4 Indicator that uses a proprietary algorithm based on Price Retracement/Breakout Method to show the Entry-Line on your trading.
Instead, it analyzes data of market and identify entry points and opportunities. (Price Retracement / Price Breakout)
It's also a trading tool that be used to practice and enhance your manual trading skills.
Key Level is an amazing tool for Scalping Trader. It also a trading tool that be used to practice and enhance your manual trad
FREE

Triple Exponential Moving Average ( TEMA ) is a moving average (MA) that gives the most weight to recent price data. TEMA is more reactive to all price fluctuations than a Simple Moving Average (SMA) or an Exponential Moving Average (EMA) or even a Double Moving Average (DEMA) and surely can help traders to spot reversals sooner because it responds very fast to any changes in market activity. TEMA was developed by Patrick Mulloy in an attempt to reduce the amount of lag time found in trad
FREE
Lord Info is an indicator for the financial market on the META TRADER 4 platform.
You can place Lord Info on any stock / currency pair on your platform.
Lord Info is able to show us the ATR report for the last (10) days or configurable, where we can see the base volatility of the pair, and its consequence.
The average true range (ATR) is an indicator of market volatility used in technical analysis. It is typically derived from the 14-day simple moving average from a series of real-range indi
FREE
This indicator allows to hide ZigZag indicator (on all MT4 timeframes) from a date define by the user with the panel ("Hidden Candles"). This indicator can be use with other "Hidden Indicators". Indicator Inputs: Depth Deviation Backstep Information on "ZigZag" indicator is available here: https://www.mql5.com/en/articles/1537 ************************************************************* Hey traders!! Give me your feeds! We are a community here and we have the same objective.... make some mo
FREE

Advantages: Based on classic indicators - ATR, Moving Average Determines the trend / flat in the market by coloring the histogram with the appropriate color Arrows indicate confirmed signals It is an excellent filter for channel strategies (by extremes)
Settings:
Наименование Описание настройки Period of Flat Detector Number of bars / candles for analysis Period of EMA Period of EMA (Moving Average) Period of ATR Period of ATR (current timeframe) Coefficient of deviation Coefficient of deviati
FREE

The dashboard should help to get a quick overview of the correlations of different assets to each other. For this, the value series are compared according to the Pearson method. The result is the value of the correlation (in percent). With the new single asset mode, you can immediately see which symbols have the highest positive or negative correlation. This prevents you from accidentally taking a risk on your trades with highly correlated symbols. Usage There are different methods for the corre
FREE

The advisor NewsCatcher Free opens trades when the price makes a reversal move from support and resistance levels. Market entries should be confirmed by the Relative Strength Index (RSI). The RSI is implemented as a tachometer.
It is recommended to use this advisor in a highly volatile market after a political event or a release of major economic data.
You can use this advisor in the semi-automated mode (the RSI performs an information role) or in the fully automated mode (the RSI decides when t
FREE

Currency Strength Gauge incicator
The currency strength gauge is an indicator to measure of the strength or weakness of currencies in the Forex market. Comparing the strength of currencies in a graphic representation will lead to a good overview of the market and its future trends. You will see in a graphic chart both the strength of the currencies and their correlation, and this will help you in your decisions to get better trades. -To easy detection of over Overbought and Oversold points,

This is a standard Bollinger Bands indicator. I have added a quick control panel in the bottom left corner for it. When multiple different parameters of this indicator are simultaneously enabled, the control panel can quickly switch between different parameters of the indicator, making it easier to observe multiple indicators simultaneously. For example, it is possible to quickly switch observations while combining a period of 20 and a period of 30. Parameter description: Indicator ID: The uniqu
FREE

The principle of this indicator is very simple: detecting the candlestick pattern in M30 timeframe, then monitoring the return point of graph by using the pullback of High-Low of M5 Candlestick and finally predicting BUY and SELL signal with arrows, alerts and notifications. The parameters are fixed and automatically calculated on each time frame. Example:
If you install indicator on XAUUSD, timeframe M5: the indicator will detect the reversal, pullback, price action on this timeframe (for exa
FREE
Volume Oscilator is a popular indicator available in trading view which is very popular among traders Definition The Volume Oscillator is an indicator made up of two Moving Averages (MA) surrounding volume, one being fast and the other slow. The slow volume MA value is then subtracted from the value of the fastlow Moving Average. The Volume Oscillator measures volume by analyzing the relationship between the two Moving Averages mentioned. When combined with other indicators it provides a very st
FREE

This reliable, professional trade copier system is without a doubt one of the best on the market, it is able to copy trades at very fast speeds from one master account (sender) to one or multiple slave accounts (receivers). The system works very fast and mimics the master account a full 100%. So changing stop losses, take profits, pending orders on the master account is executed on the slave accounts too, like each other action. It is a 100% full copy (unlike many other copiers who only copy ma
FREE
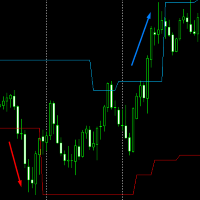
Volatility Channel from JagzFX helps you find breakouts by displaying a channel on the price chart. Volatility Channel is simple to use - there are no parameters - and works on any timeframe. BASIC USE of Volatility Channels The channel can be used as a 'No Trade Zone': you don't trade when the price is inside the channel. However:
When the price breaks above the channel: go Long. When the price breaks below the channel: go Short. The indicator works on all timeframes to suit your trading style.
FREE

The StrikePin indicator is a technical, analytical tool designed to identify trend reversals and find optimal market entries. The StrikePin indicator is based on the pin bar pattern, which is the Price Action reversal pattern.
An entry signal, in a trending market, can offer a very high-probability entry and a good risk to reward scenario.
Be careful: the indicator is repainting since it is looking for highest high and lowest lows. You should avoid to use it in experts but you can use it in
FREE
"All in One" panel. You can simultaneously control: up to 3 symbols; up to 6 periods; up to 31 popular signals. You can see the sum for all signals taking into account the weight of the signal Version for MetaTrader 4: https://www.mql5.com/ru/market/product/27880 Version for MetaTrader 5: https://www.mql5.com/ru/market/product/27830
Parameters NUM_BAR - number of the bar to analyze (set a value greater than 0 to work on closed bars). timeframe_1....timeframe_6 - working timeframes (if set to "c
FREE

Harrow Order is an Expert Advisor (EA) that works based on Support and Resistance, Martingale and Anti-Martingale methods. Support and Resistance is used to indicate the best position to place orders. Martingale is used to fix unprofitable orders. And Anti-Martingale is used for increasing potential profitable orders. This EA runs with two basic steps, namely try and execute. First, it will send one initial order to find out the market conditions at a nearest Support or Resistance level. Second,
FREE
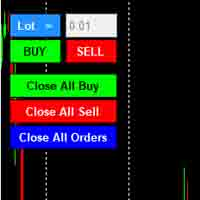
Note: This is EA only panel for manage Orders ------------------------- EA input inclde
- EA_Comment
------------------------
The panel include - Lot size input for BUY and SELL button
- Close ALL SELL orders (same symbol)
- Close ALL BUY orders (same symbol)
- Close ALL orders (same symbol)
-------------------------
You can use on any pair and any time frame
Thanks
FREE

Features: fast opening / closing deals the number of deals and the total profit for the Symbol
Fast open deals: set the Lot volume set StopLoss / TakeProfit in points (if you set "0", then it is not used) set slippage set Magic (if necessary) set comment (if necessary)
Fast open features: fast open Buy fast open Sell fast close ALL open orders for the current Symbol
Attention: this utility works only on the current instrument this utility works on a VPS must enable Algo trading in the termi
FREE

MTF Heiken Ashi MA is a multiple timeframe Heiken Ashi & Moving Average indicator. Fully customizable for advanced & unique Heiken Ashi & Moving Average calculations.
Key Features Modified appearance and appeal from the traditional using only H eiken Ashi MA bodies. MTF Higher or lower timeframes available making this it great for trends and scalping. There are many settings that can be non-repaint for signals at a new bar and at bar 0.
Inputs Timeframe = PERIOD_CURRENT - timeframe of Moving
FREE

VR Assistant Charts is a convenient tool for traders working with graphical objects in the MetaTrader trading terminal window. The program allows you to change the color, style, thickness and other characteristics of trend lines, Fibonacci levels, Gann fans and other graphic elements in the MetaTrader terminal with one click of the mouse. You can find settings, set files, demo versions, instructions, problem solving, at [blog]
You can read or write reviews at [link]
Version for [MetaTrader 5]
FREE

TIRED OF HAVING TO CALCULATE THE LOTSIZE EVERY TIME?
This indicator will do it for you, WHATEVER ASSET YOU CHOOSE in 10 seconds !!!
INSTRUCTIONS
The things to do in order to activate this indicator will take around 10 seconds once you understand how to use this indicator properly.
Here are the steps to follow:
Place the indicator on the chart of the asset you want to trade on.
Go to " Inputs ".
Enter where you want to set the stop loss .
Choose risk in $ .
You can also choose whethe
FREE

Are You Better than Monkey? Prove it...
The trade of this EA is based on random output with customizable lot size (use martingale or not), stop-loss, and take-profit levels. Easy to use and Simple Great for benchmarking tests against other EAs or manual trade. Works for ECN/Non-ECN brokers and 2-3-4-5 digit symbols Support us by open My recommended broker. Exness Tickmill robot monkey uses Adx trend filter for fair game no-trade unfavorable market ( you can turn off set adx = 0) . EA starts w
FREE
Learn how to purchase a trading robot from the MetaTrader Market, the store of application for the MetaTrader platform.
The MQL5.community Payment System supports transactions via PayPal, bank cards and popular payment systems. We strongly recommend that you test the trading robot before buying, for a better customer experience.
You are missing trading opportunities:
- Free trading apps
- Over 8,000 signals for copying
- Economic news for exploring financial markets
Registration
Log in
If you do not have an account, please register
Allow the use of cookies to log in to the MQL5.com website.
Please enable the necessary setting in your browser, otherwise you will not be able to log in.