MetaTrader 4용 Expert Advisor 및 지표 - 58

Key Features: Type of Indicator: Line Break Chart Indicator Usage: Identifying trend reversals and potential market turning points. Input Parameters: The primary input parameter is 'Lines_Break,' which represents the number of lines the price needs to move to create a new line in the opposite direction. How it works: The indicator draws green and red histogram bars to represent the line break chart. Green bars indicate an upward trend, and red bars indicate a downward trend. The indicator calcul
FREE

Rung 추세 표시기. 이 표시기는 가격 움직임의 주요 추세를 식별하고 다른 색상으로 표시하는 동시에 주요 추세에 대한 노이즈 및 단기 가격 움직임을 제거하고 반응하지 않습니다. 지표는 시장의 현재 추세를 결정하는 도구입니다. 기본 설정인 상승("강세" 추세)에서 표시기는 녹색 선으로 표시되고 하락 추세("약세") 추세 - 빨간색 선으로 가격이 채널에서 움직일 때 옆으로 또는 평평한 가격 움직임으로 표시 , 표시기가 반응하지 않습니다. 코리더 값이나 횡보 가격 움직임은 지표 설정으로 조정할 수 있습니다.
표시기 설정 설명 제한점 - 복도의 크기(포인트). coefficient_smoother - 평활 계수. 경고 - 사용자 데이터가 포함된 대화 상자를 표시합니다. Text_BUY - 구매 신호에 대한 사용자 정의 텍스트입니다. Text_SELL - 판매 신호에 대한 사용자 정의 텍스트입니다. Send_Mail - 메일 탭의 설정 창에 지정된 주소로 이메일을 보냅니다. 제목 -
FREE

SmartChanelFree is a universal indicator for all types of markets. This indicator should have in its arsenal every trader, since it represents a classic approach to analyzing the price of a trading instrument and is a ready-made trading strategy. The indicator forms the upper, average price movement limit. Attention !!! This version of the indicator is trial and works only on the chart with the period M1. The full version of the indicator can be found at: https://www.mql5.com/en/market/product/
FREE

MAIN FEATURES
- Index Master is a 100% automated system. - Not martingale! Not Grid! Not Hedge! No dangerous strategies are used! - Every orders has a StopLoss and a TakeProfit. - This Expert will win and will lose but in the long run will produce a good profit with quite low temporary drawdown. - Recommended broker : low spread; low comission; not market maker: https://bit.ly/38hfs2D - No need set files . Just attach to the following charts and let it work. - Designed for US30 - USTEC and
FREE

Candle size oscillator is an easy to use tool to figure out candle size from highest to lowest price of each candle. It's a powerful tool for price action analysts specifically for those who works intraday charts and also a perfect tool for short term swing traders. Kindly note that you can also edit the Bullish and Bearish candles with different colors.
#Tags: Candle size, oscillator, price action, price range, high to low, candle ticks __________________________________________________________
FREE

Fibonacci retracement is really one of the most reliable technical analysis tools used by traders. The main problem with using these levels in trading is that you need to wait until the end of the impulse movement to calculate the retracement levels, making difficult to take a position for limited retracement (0.236 or 0.382). Fibo Dynamic solves this problem. Once the impulse movement is identified the retracement levels are automatically updated allowing very dynamic trading in trends with onl
FREE

Classic Range BreakOut Expert Advisor "The opening range breakout strategy is a logical and repeatable strategy that involves traders building firm market direction biases after price breaks above or below the market defined opening price range of a session"
You can select the number of bars and width in pips. Works in all pairs. RECOMMENDED: test first in a Demo account for 1 or 2 weeks.
FREE
The Indicator automatically draws trend lines ( Support & Resistance Lines) when attached to any opened chart with any time frame. Button controls with on(green)/off(red) are provided to display the Support & Resistance lines of short, medium, long, very long, v.v.long trends. For ex: to display only short, long term trend lines, make sure that the short and long buttons are in green color and the remaining 3 buttons in red color. This free version works only with EURJPY pair. Please buy paid ve
FREE

Strong and weak Pairs is a trend following indicator to help you choosing the pairs to trade based on the currency score. Strong and weak Pairs is comparing currencies position to the moving average for all major pairs then display the position score from Zero (0) to Seven (7) with two lines on the chart. 7 is the strongest currency and zero is the weakest currency. Additionally there is a dashboard displaying all the currencies score to choose the pair you will trade. Strong and Weak Indicator
FREE

Attention, for the indicator to work correctly, you need to put the "MQL5" folder in your terminal folder, you can download it from the link below: https://disk.yandex.ru/d/DPyo0ntaevi_2A
One of the best arrow indicators for Binary Options, which can also be used in the Forex market. Any time frame from M1 to MN, any currency pair, can also be used on stocks - the indicator is universal. Expiration from 1 to 5 candles. Displays traffic statistics on a graph. The indicator gives signals along th
FREE

7년의 개발 끝에 제가 개인적으로 만든 일부 지표와 전문가 어드바이저(EA)를 무료로 공개하기로 결정했습니다.
유용하다고 생각되면 5성급 평가로 지원해 주세요! 여러분의 피드백이 무료 도구를 계속 제공하는 원동력입니다. 저의 다른 무료 도구들도 여기 에서 확인해 보세요.
_________________________________ "RSI 밴드" 지표 – 더 나은 거래 결정 "RSI 밴드" 지표는 클래식 RSI에 단순한 밴드를 결합하여 매수 또는 매도할 최적의 시기를 더 명확하게 보여줍니다. 시장에 진입하고 탈출하는 최적의 타이밍을 포착하는 데 도움을 주도록 설계되었습니다. 주요 혜택: 정밀한 과매수 & 과매도 분석 : 진정한 시장의 극단을 부각시켜 공통적인 가짜 신호의 함정을 피하는 밴드가 추가된 RSI를 향상시킵니다. 명확한 신호 : 가격이 너무 높거나 낮을 때 쉽게 볼 수 있어 거래 결정을 내릴 수 있습니다. 더 나은 타이밍 : 밴드는 기존
FREE

It's an expert to use prices action and trade level to open each order. Expert can to trade up 12 pairs, uses the corresponding default setting for each pair.
Default settings are good for EURUSD pair and IC Markets broker.
Time Frame: H1
Parameters
PresetsParameters = Uses prosets parameters (12 pairs). Broker GMT Offset = Set broker different time from GMT time. Time Frame Use = Time frame of chart to run expert. Type Of Signals = Mode of signals. Time Set Levels = Time set levels to trade.
FREE

UniversalFiboChannel is a universal indicator, it builds a trading channel according to Fibonacci levels. This indicator is a full-fledged channel trading strategy. The indicator is installed in the usual way and works with any trading tool. Options HelpBasisTF = "M: 43200; W: 10080; D1: 1440; H4: 240; H1: 60" is a hint for the BasisTF parameter
BasisTF = 1440 - base period for calculating Fibonacci levels DisplayDecimals = 5 - the number of decimal places of the price of the trading instrumen
FREE

The Unreal Engine Official MQL5 Channel
https://www.mql5.com/en/channels/theunrealengine contribution of profitable patterns by you are welcome ,You will find the discussion group in the channel. Please Read The Robot description carefully. It's not the usual yada yada!
What is The Unreal Engine? The Unreal Engine is a revolutionary EA designed to trade static patterns. The difference between other neural networks robots and the Unreal Engine is that the user can set his own p
FREE

Advantages of the Tick Volume Indicator: Identifying Market Sentiment : A predominance of green bars on the histogram may indicate an uptrend or strong buying pressure, useful for determining entry points for long positions. A predominance of red bars indicates a downtrend or strong selling pressure, useful for determining entry points for short positions. Analyzing Market Activity : The indicator helps identify periods of high activity, when significant changes are occurring in the market, and
FREE

The EJ_15_201514104_S_SM_CF_SQ4 is an algorithmic trading strategy for MetaTrader, tested on EURJPY using the M15 timeframe from April 1, 2004, to April 24, 2024. There is no need to set up parameters, all settings are already optimized and fine-tuned.
Recommended broker RoboForex because of EET timezone.
You can find the strategy source code for StrategyQuant at the link: https://quantmonitor.net/eurjpy-awesome-oscillator-master/
Key details are:
MagicNumber: 201514104
Main Chart: Curre
FREE
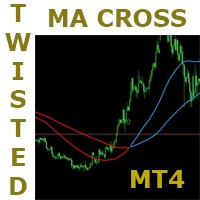
This is a very simple but very powerful strategy. It has a lot of potential. This strategy is based on the popular moving average crossover but with a very interesting twist to it. It has some mechanisms to delay signals untill direction is clear and confirmed. Follow the indication colors and arrows for trade ideas It has a potential winning rate of somewhat greater than 70%. Try it in all timeframes and determine which one is good for you. ===========
FREE

With this indicator, you can easily make price regions in all time zones. In addition, with the automatic supply demand finder, you can ensure that the new regions are found automatically. You can increase your transaction quality by reaching more accurate operations with this auxiliary Tool and indicator.
I share your trial version of EURUSD for free with you. If you want to buy the working version in all parities, you can contact me. +New version Gap Bar Add ( Press G keyboard ) Default con
FREE

ADR 20 mostra l'intervallo medio di pips di una coppia Forex, misurato su un numero di 20 giorni . I traders possono utilizzarlo per visualizzare la potenziale azione dei prezzi al di fuori del movimento medio giornaliero.
Quando l'ADR è al di sopra della media, significa che la volatilità giornaliera è superiore al normale, il che implica che la coppia di valute potrebbe estendersi oltre la sua norma.
L'ADR è utile anche per il trading di inversioni intraday. Ad esempio, se una coppia di valu
FREE

A stochastic oscillator is a momentum indicator comparing a particular closing price of a security to a range of its prices over a certain period of time. The sensitivity of the oscillator to market movements is reducible by adjusting that time period or by taking a moving average of the result. It is used to generate overbought and oversold trading signals, utilizing a 0-100 bounded range of values. This indicator show 15 stochastic on one chart.
FREE
Vanesa RSI Reverse provides an amazing trading strategy. Use optimization function of Strategy Tester in MetaTrader 4 to find out many high potential parameter sets in very long term of history data (more than 2 years). The EA works well with XAUUSD in M15 but it also give similar results in others symbols and time frame. It just takes some minutes to try it out in your own history data to see the very good performance. We will continue to improve the strategy to get better performance in next v
FREE
The professional utilities "Ichimoku Waves Meter" to analyse graphs using the correct interpretation of Ichimoku kinkōhyō!
Is a graphic program that allows traders to quickly and easily measure the proportions between the indicated points on the price graph. This time and price indicator is a basic tool for analysing the chart according to the Ichimoku strategy on the MT4 platform. Using this tool allows an insightful and complete analysis of time waves as well as price waves in a very short ti
FREE

This indicator shows ratios between extremes on the chart. You can specify your own ratios (e.g. Fibonacci).
Parameters Most important Density - how much in details to search ratios in extremes. Bigger number means less details, smaller number means more details. Base unit is 1 bar on the chart. History - how far to go in history while searching. When you set -1, the indicator processes all bars from history. Base unit is 1 bar on the chart. Range - how far search ratios from given extreme. Bas
FREE
This Expert Advisor monitors all open trades and saves them to a CSV file whenever a change is detected. It’s a lightweight tool for exporting trade data from MetaTrader 4 in real time. What it does: Monitors all open positions on the terminal Detects changes (order type, volume, price, SL, TP, etc.) Writes updated trade data to a .csv file ( TradeCopy.csv ) Includes order ID, symbol, type, lot size, price, SL, and TP Saves files in the Common Files folder for easy access by other applications H
FREE

If you trade or wish to trade the popular HLHB Trend-Catcher System, then this indicator is for you! It detects when the HLHB system entry rules are met and sends out an alert in the form of notifications to your mobile phone and to your pc. By automatically sending you notifications, this indicator lessens your trading work load as you don't have to sit in from of your pc all day checking all the chats for when the entry rules are met. This indicator does all the dirty work for you. When the si
FREE

This EA is a free version of Vino EA . Unlike the full version, the parameters cannot be changed and the lot size is set to 0.01.
Description Vino EA is a grid Expert Advisor using mainly customized oscillators to analyze the market prices and volatility in order to identify trend reversals. It uses a grid of orders which increases the lot size only after the stop loss is reached. It includes an automatic stop loss, which computes the stop loss value based on the volatility of prices.
Require
FREE

The Time Zone indicator allows users to set specific time periods for major trading sessions (Asian, European, North American) and display them with distinct colors on the chart. Users can choose how many days of trading zones to show, set the start and end times for each session, and define the color to represent each trading period. The chart refreshes at user-defined intervals to ensure the time zone data is accurate and current. Key Features: Display Trading Zones: Users can choose to
FREE

Fibonacci Trend Marker — is a trend indicator that analyzes the behavior of the current candle relative to the High-Low (HL) range of previous candles using Fibonacci retracement levels. It visually tracks trend strength, signaling potential weakening or reversal through a change in candle color.
Features: Designed for trend-focused traders, it helps quickly identify trend changes based on Fibonacci levels. Effective on any timeframe with sufficient market volatility, when a sequence of 3–5 c
FREE

Check my p a id tools they work perfect please r ate Adjustable PIN BAR indicator is usefull tool alowing to search for pin bars you wish to find on the price chart, it has 2 parameters to filter out what type of pin bars you wish to search for: 1) MinTailProc 75% (default) which means to show pin bars that has minimum size of the Nose (Tail) as 75% of full candle size. If Upper Nose (Tail) size of the candle is minimum 75% of the candle size fully than candle is painted in RED. If Lower Nose
FREE

MetaTrader to Prometheus Exporter Optimize your trading by easily exporting your MetaTrader data to Prometheus and transform it into powerful visual insights through Grafana dashboards. This utility bridges the gap between your trading platform and modern monitoring solutions.
Key Features:
Automatic export of trading metrics from MetaTrader (MT4/MT5) Full Prometheus format compatibility for immediate integration Simple and flexible metric configuration Low performance impact on MetaTrader Su
FREE

Diversify the risk in your trading account by combining our Expert Advisors. Build your own custom trading system here: Simple Forex Trading Strategies
The expert advisor opens trades when the SMAs cross and when the WPR has left overbought/oversold areas. The SMAs are also programmed to close the trades if the trend changes. The Stop Loss, Take Profit, and Trailing Stop are calculated based on the ATR indicator. The recommended currency pair is NZDUSD and the recommended timeframe to operat
FREE

The robot examines candlestick highs and lows on multiple timeframes during the course of the week. Also, entry is made with predicting a reversal at that price. The best currency pair is EURUSD and the timeframes H1 and H4 are a good match. With certain settings, you can enter up to 10 entries at the same time, so please adjust the number of entries. Close the basket and close multiple entries together when the profit reaches a certain value. As a default, the stop loss is set to 30 pips, so pl
FREE

Please contact me at telegram https://t.me/smartforex7 After purchasing SmartForex Indicator then Use This Indicator...................... SMART EXIT PROFIT LINE Indicator is very Helpful with SmartForex Indicator ........................................ SMART EXIT PROFIT LINE Indicator Attach with SmartForex Indicator after then Red Line Show Exit buy Profit , Green Line show Exit Sell Profit................
FREE
Drawdown Control (DC) is a helpful utility that can be used like an EA to limit the drawdown of any MT4 account . You can choose between different, fully customizable options of how DC must react if the drawdown reaches critical levels. To utilize the symbol with the most ticks per minute it is highly recommended to put the product on a EURUSD-M1 chart.
Input Parameters Equity / Balance in % to stop trading (0 = disabled) : 85.0 [etc.] Current Balance / Initial BalanceHW in % (0 = disabled) : 6

Binary Win 60는 M5(5분) 타임프레임에서 작동하도록 설계된 바이너리 옵션 거래를 위한 전문 도구입니다. 이 인디케이터는 다음과 같은 인기 있는 통화 쌍에 적합합니다: AUDCAD, AUDNZD, CHFJPY, EURCAD, EURAUD, EURCHF, EURGBP, EURNZD, GBPAUD, GBPJPY, GBPUSD, USDJPY. 주요 특징: 화살표 형태의 명확한 신호: 초록색 화살표: 매수 신호. 빨간색 화살표: 매도 신호. 즉각적인 알림: 팝업 알림. 소리 알림. 권장 만료 시간: 1 캔들 (5분). 장점: 높은 정확도: 역사적 테스트에서 60% 이상의 수익률. 테스트 품질: Dukascopy의 99% 정확도 데이터 사용. 선물:
구매 후 7일 이내에 MT4용 Expert Advisor(EA)를 받으세요. 자동으로 거래를 시작합니다. ️ 사용 방법: 차트에 인디케이터 설치. 신호(초록색 또는 빨간색

The Commitments of Traders Ratio Indicator is one of these things you never thought about it before you really see the magic behind it. The indicator shows the Ratio of long/short positions released by the CFTC once a week.
If you have a look on the Sreenshot you can see two (three) zones of interest. Zone 1: The Switches (Red -> Green, Green -> Red) Zone 2: MA cross Zone 3: If you combine this with the COX indicator an additional zone will appear. You also can experiment with Ratio crossing MA
FREE

The Tarantulas expert Advisor is a night scalper and a robot for position trading at the same time.
Thanks to deep settings, this expert Advisor becomes an indispensable assistant in trading.
On the basis of this EA, you can implement dozens or even hundreds of profitable strategies.
Smart position tracking and time trading functions are enabled.
Trading is performed on pullbacks from overbought and oversold zones on trend changes.
The trend is determined using the author's "Providec Trend
FREE
NOTE : This Free version only works for the EURUSD & AUDUSD Symbol !
MT4 Version Available Here: https://www.mql5.com/en/market/product/43438
MT5 Version Available Here: https://www.mql5.com/en/market/product/50255
Telegram Channel & Group : https://t.me/bluedigitsfx
V.I.P Group Access: Send Payment Proof to our Inbox
Recommended Broker: https://eb4.app/BDFXOsprey
* Breakthrough Solution For Reversal Trading And Filtering With All Important Features Built Inside One Tool! BlueDi
FREE

After 7 years I decided to release some of my own indicators and EAs for free.
If you find them useful please Show support with a 5-star rating! Your feedback keeps the free tools coming! See other my free tools as well here
_________________________________ Bollinger %B Indicator for Enhanced Forex Trading Analysis The Bollinger %B Indicator, expertly crafted in MQL4, is a dynamic tool designed to revolutionize forex trading analysis. Leveraging the power of Bollinger Bands,
FREE

Martingala Assistance, as its name says ... It is an assistant, an expert advisor that monitors all the orders for the asset in which it has been placed, no matter if that order was by some other expert advisor or by the trader placed on the Manually, he will start his work after each order that is negative.
See more products on: https://www.mql5.com/en/users/joaquinmetayer/seller .
FREE
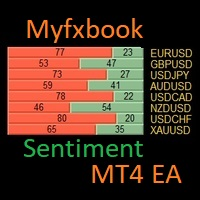
I have created this Free MT4 Tool EA to test if it is more profitable to trade in favor of the mass sentiment of traders or it is better to go against it. The EA is Multy-currency and can trade on Demo or Real if you want (but be carefully, this tool is made to understand if it is better to trade for or against market sentiment... Use at your own risk) This is the FREE version from Forex Sentiment Trader PRO EA
Remember to authorize Myfxbook url in WebRequest options in MT4. - Check the Video
FREE

It's an expert to open and close orders on specific day and time. Expert open and close orders only with the same symbol it attached. Can set time open and close orders based day of year or day of week. Expert can send market orders and pending (stop or limit). Each order can placed with take profit and stop loss. There is option to use trailing stop loss and break even. Expert can manage only own orders or all orders of account.
Information about the expert's parameters can find on the blog .
FREE
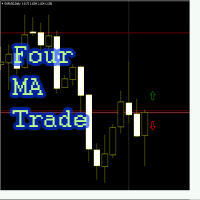
Советник "Four_MA_trade" входит в рынок по средним скользящим следующим образом: 1. две скользящие средние с большими периодами определяют общий тренд 2. две скользящие средние с малыми периодами определяют локальный тренд. Если направление общего и локального тренда совпадает, то на пересечении "локальных" средних скользящих открывается ордер. Возможно инвертирование сигнала, если период быстрой скользящей в настройках выставить больше по значению, чем период медленной. Для каждой валютной пар
FREE
This is a classic Expert Advisor with the most popular trading functions. But the main feature is that the Expert Advisor is completely generated with the help of a script according to the signals of an arrow indicator. You can get the same EA, but which will enter on your indicator . And with full source code and the possibility of unlimited use, including sale on Market. This version with a full set of functions, but in the process of creating an EA, you can form your own set of settings.
FREE

This EA trades the forex markets by a specific combination of ATR and parabolic SAR indicator signals and transaction management. the EA has stop loss and take profit. minimum trading account 500.
default settings for GBPUSD 1h. settings for optimization: ATRperiod lot sarStep sarMaximum tpFactor slFactor this EA(){ operates once per bar; fast methods of optimization are valid(){ user can optimize by model (control point); || (open prices only); }}
developed, tested and optimi
FREE

This is an example of how the MetaTrader terminals's Strategy Tester can help to find good input parameters for an old and widely known MACD Sample Expert Advisor, which is available in the Navigator window (tab: Expert Advisors).
Input parameters Indicator MACD: fast - fast Period; slow - Slow Period; sign - Signal Period; appPrice - PRICE_CLOSE=0; PRICE_OPEN=1; PRICE_HIGH=2; PRICE_LOW=3; PRICE_MEDIAN=4; PRICE_TYPICAL=5; PRICE_WEIGHTED=6; MACDOpenLevel ; MACDCloseLevel ; Indicator Moving Avera
FREE

Qv² OBOS is an indicator that aims to identify overbought and oversold regions considering price standard deviation and volume analysis.
Oversold signals are indicated by arrows pointing upwards.
Overbought signals are indicated by arrows pointing downwards. Can be used in all timeframes. Can be used on all pairs. I use in H1 Important note, the histogram is displayed to improve the trader's analysis. But the signs of overbought and oversold are the arrows as mentioned above.
Important note:

This is a standard Bollinger Bands indicator. I have added a quick control panel in the bottom left corner for it. When multiple different parameters of this indicator are simultaneously enabled, the control panel can quickly switch between different parameters of the indicator, making it easier to observe multiple indicators simultaneously. For example, it is possible to quickly switch observations while combining a period of 20 and a period of 30. Parameter description: Indicator ID: The uniqu
FREE

The principle of this indicator is very simple: detecting the candlestick pattern in M30 timeframe, then monitoring the return point of graph by using the pullback of High-Low of M5 Candlestick and finally predicting BUY and SELL signal with arrows, alerts and notifications. The parameters are fixed and automatically calculated on each time frame. Example:
If you install indicator on XAUUSD, timeframe M5: the indicator will detect the reversal, pullback, price action on this timeframe (for exa
FREE

THE PLATE EA IC Market or FTMO Recomment Broker.
This EA „PLATE“ BUY and SELL in one.
Only DE40 with this Standart Settings (You can Change the Take Profit to 500 for other Endpoints or the Stopp Loss to 60 or higher)
M1, M5, M15, M30, H1.
Minumum 1000$/€ ...Lot 1 in first Week. The EA work with a small Stop Loss and a good Take Profit Risk Ratio. When you a undecided or have any Question write me a Message.
FREE

Classical Keltner Channel Indicator, Extended version. Works on any instruments. It shows Keltner Bands under these parameters: * periodMa - Period of Moving Average * periodAtr - Period of ATR (Average True Range) * atrMultiplier - ATR Multiplier, multiplies range, calculated by PeriodATR parameter * modeMA - modes of moving average (MA) calculations (Simple, Exponential, Smoothed, Linear Weighted) * modePrice - modes of Price calculations for MA (Close, Open, High, Low, Median, Weighted) T
FREE

Kita Biikin acak saja karena ini adalah Ea untuk percobaan apakah bisa hasil compile SQuant di upload ke MQL5, dan hasilnya ternyata bisa . Find out how to add the product description . Product rating in the Market depends on the built-in editor . If your product has inputs, add them as a list of parameters with descript ou can freely edit data on all tabs. Don't forget to save your changes. Fill in all the information about your Product and send it for the moderator check using the "Ready"
FREE
Use Forex Trading Profit Tracker to keep a record of your earnings across accounts. This indicator will show a dashboard in the Meta Trader chart to show for the profit or loss money in your account. It’s easy to see just how much money you’re making matched betting with the Forex Trading Profit Tracker. Key features: Track your profit over time Check out your stats. Track expected profits against actual profits. Export account history to Excel.
MT5 version(*): https://www.mql5.com/en/market/
FREE

Key Level Key Level is a MetaTrader 4 Indicator that uses a proprietary algorithm based on Price Retracement/Breakout Method to show the Entry-Line on your trading.
Instead, it analyzes data of market and identify entry points and opportunities. (Price Retracement / Price Breakout)
It's also a trading tool that be used to practice and enhance your manual trading skills.
Key Level is an amazing tool for Scalping Trader. It also a trading tool that be used to practice and enhance your manual trad
FREE
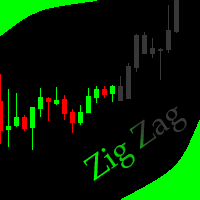
This indicator allows to hide ZigZag indicator (on all MT4 timeframes) from a date define by the user with the panel ("Hidden Candles"). This indicator can be use with other "Hidden Indicators". Indicator Inputs: Depth Deviation Backstep Information on "ZigZag" indicator is available here: https://www.mql5.com/en/articles/1537 ************************************************************* Hey traders!! Give me your feeds! We are a community here and we have the same objective.... make some mo
FREE

Network EURUSD - сеточный советник, настроенный для торговли валютной парой EURUSD. Для определения моментов для открытия сделок советник использует несколько индикаторов. Рекомендуемый период графика для торговли с настройками по-умолчанию - M15.
Настройки: Take profit
Размер тейк профита
Volume
Размер лота
Balance
Баланс для расчёта лота. Если ноль, то лот будет фиксированным
Period for indicators Период для индикаторов.
FREE

Talleyrand PitchFork EA: Your Ultimate Trading Diplomat Introducing the Talleyrand PitchFork Expert Advisor (EA), a revolutionary trading tool designed to elevate your trading strategy through a masterful blend of technical indicators and advanced trade management features. This sophisticated EA harnesses the precision of Gann Lines, Moving Averages (MA), Bollinger Bands, and the MACD to pinpoint the most advantageous moments for trade entry and exit, ensuring unparalleled accuracy and efficienc
FREE

VR Assistant Charts — 이는 MetaTrader 거래 터미널 창에서 그래픽 개체로 작업하는 거래자를 위한 편리한 도구입니다. 이 프로그램을 사용하면 한 번의 마우스 클릭으로 MetaTrader 터미널에서 추세선, 피보나치 수준, Gann 팬 및 기타 그래픽 요소의 색상, 스타일, 두께 및 기타 특성을 변경할 수 있습니다. 설정, 세트 파일, 데모 버전, 지침, 문제 해결 등은 다음에서 얻을 수 있습니다. [블로그]
다음에서 리뷰를 읽거나 작성할 수 있습니다. [링크]
버전 [MetaTrader 5] 이 유틸리티는 그래픽 개체를 사용하여 금융 상품을 분석할 때 거래자의 단조로운 작업을 크게 촉진합니다. 모든 작업은 차트에서 직접 컴퓨터 마우스를 사용하여 수행됩니다. 이 프로그램은 MetaTrader 4 및 MetaTrader 5 거래 플랫폼에 대한 기술 지표 형태로 구현되므로 다른 지표, 조언자 및 스크립트와 동시에 사용할 수 있습니다. 제어는 컴퓨터 마우스를 사용
FREE

Break Even Line by MMD
The Break Even line is a useful indicator for people using strategies that allow simultaneous trades in both directions, such as the MMD methodology. This indicator is useful when playing statistical models and averaging positions in accumulation and distribution zones. The indicator draws levels by summing positions in three groups: positions included in BUY, positions included in SELL and all positions included.
Functionality description:
Show BUY BELine - shows or
FREE

EA "GenisysX Knight" is an advanced system that exploits unique fluctuation between AUD, CAD, and NZD currencies. Historically results show that these pairs used in composition always return back first moved pair after fast movement in one direction. This observation can allow us to include a grid-martingale system where can get maximum points of these unique situations.
EA "Undefeated Triangle" uses only 3 pairs: AUDCAD, AUDNZD, and NZDCAD. Real account monitoring ; Much cheaper than si
FREE

The dashboard should help to get a quick overview of the correlations of different assets to each other. For this, the value series are compared according to the Pearson method. The result is the value of the correlation (in percent). With the new single asset mode, you can immediately see which symbols have the highest positive or negative correlation. This prevents you from accidentally taking a risk on your trades with highly correlated symbols. Usage There are different methods for the corre
FREE

Introduction
Virtual Money Flow free - Lightweight free trading robot based on Money Flow index. Orders set with ISL and take profit is virtual. Equipped with trailing stop and limited money management. How to? Any account type,leverage and time frame Works only on currency pair EURUSD, optimizations needed in regualar intervals You can start with as low as $20-50 based on leverage 500 This is not a scalper and trades can therefore be less frequent, be patient! Limited contract size
FREE

Currency Strength Gauge incicator
The currency strength gauge is an indicator to measure of the strength or weakness of currencies in the Forex market. Comparing the strength of currencies in a graphic representation will lead to a good overview of the market and its future trends. You will see in a graphic chart both the strength of the currencies and their correlation, and this will help you in your decisions to get better trades. -To easy detection of over Overbought and Oversold points,

Vertical time lines. A simple indicator that draws on the graph vertical lines of time. 1,3,5,10,12,15,20,30,60 minutes. You can change the line color, line style, select a time period from 1 to 60 minutes. Applies to any chart, timeframe. Incoming parameters: Minute_Num = 20; // step 3,5,12,10,20,15,30,60 minutes color Line_Color = clrYellow; // color line Line_Dash = 2; //0,1,2,3,4... solid, dash, dot, dash dot,dash dot dot
FREE

The parabolic stop and reverse (PSAR) indicator was developed by J. Welles Wilder, Jr. as a tool to find price reversals which can be utilized as stop-loss levels as well as trade triggers. The notable difference about the PSAR indicator is the utilization of time decay. The PSAR indicator forms a parabola composed of small dots that are either above or below the trading price. When the parabola is below the stock price, it acts as a support and trail-stop area, while indicating bullish up t
FREE
This simple but useful script calculates the lot in % of the deposit. It is indispensable for risk management. There is only one customizable parameter: MaxRisk - risk in % for lot calculation. The product works as a standard script. Launch it once on an appropriate chart and start trading using the calculated lot value. Genious is simplicity! Happy trading!
FREE
As we know, МТ4 and МТ5 do not store tick history, which may be necessary to develop trading strategies and market analysis. I have developed a method allowing you to receive tick history very easily. The indicator gathers tick history in real time and writes it to XXXXXX2.hst file, where XXXXXX is a symbol name. This file can be used to create an offline chart or something else. If you use a trading robot, then launch the indicator and control your broker by examining the spread and quotes. All
FREE
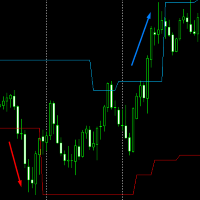
Volatility Channel from JagzFX helps you find breakouts by displaying a channel on the price chart. Volatility Channel is simple to use - there are no parameters - and works on any timeframe. BASIC USE of Volatility Channels The channel can be used as a 'No Trade Zone': you don't trade when the price is inside the channel. However:
When the price breaks above the channel: go Long. When the price breaks below the channel: go Short. The indicator works on all timeframes to suit your trading style.
FREE

Introduction and Description
Colored candlesticks showing the trend based on two moving averages and the slope of the slow moving average. A trend is the overall direction of a market or an asset's price. In technical analysis, trends are identified by trendlines or price action that highlight when the price is making higher swing highs and higher swing lows for an uptrend, or lower swing lows and lower swing highs for a downtrend. Many traders opt to trade in the same direction as a trend, whil
FREE

Same behavior of https://www.mql5.com/en/market/product/25552 but fixed lot 0.01 The EA waits for a spike according to a specific logic and opens a position in spike direction setting stop loss and take profit. When positions are in profit they are managed with smart trailing mechanism based also on elapsed time from opened position. It works with 5-digit and 4-digit broker. Must be used on the M1 chart. Does not need historical data. It does not use Martingale Grid Hedge
Parameters spikeFilte
FREE
MetaTrader 마켓은 거래로봇과 기술지표를 판매하기에 최적의 장소입니다.
오직 어플리케이션만 개발하면 됩니다. 수백만 명의 MetaTrader 사용자에게 제품을 제공하기 위해 마켓에 제품을 게시하는 방법에 대해 설명해 드리겠습니다.
트레이딩 기회를 놓치고 있어요:
- 무료 트레이딩 앱
- 복사용 8,000 이상의 시그널
- 금융 시장 개척을 위한 경제 뉴스
등록
로그인
계정이 없으시면, 가입하십시오
MQL5.com 웹사이트에 로그인을 하기 위해 쿠키를 허용하십시오.
브라우저에서 필요한 설정을 활성화하시지 않으면, 로그인할 수 없습니다.