YouTube'dan Mağaza ile ilgili eğitici videoları izleyin
Bir alım-satım robotu veya gösterge nasıl satın alınır?
Uzman Danışmanınızı
sanal sunucuda çalıştırın
sanal sunucuda çalıştırın
Satın almadan önce göstergeyi/alım-satım robotunu test edin
Mağazada kazanç sağlamak ister misiniz?
Satış için bir ürün nasıl sunulur?
MetaTrader 4 için yeni teknik göstergeler - 3

Unlock the Secrets of Successful Trading with AI TREND SENTIMENT! Welcome to the world of smarter trading! Discover the AI TREND SENTIMENT Indicator, a tool that has been a game-changer in my trading journey and could be for you too! The Histograms of this Indicator are SUPER IMPORTANT in trading, and here's why you'll LOVE them: Instant Insight: Understand price cycles like a pro! WHOA! It's that simple. Decision Time: Cross points show EXACTLY where you need to make a move – N
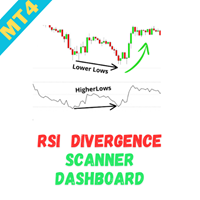
Welcome to the RSI Divergence Multicurrency Scanner Dashboard , an advanced tool designed to help traders efficiently detect RSI divergence patterns across multiple currency pairs. This scanner enables quick identification of potential reversal opportunities, giving you an edge in your trading strategy. Key Features: Effortless Multicurrency Scanning
Monitor multiple currency pairs in real-time and receive instant alerts when significant RSI divergence patterns are detected. This allows you to
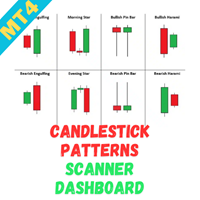
Welcome to the Candlestick Pattern Multicurrency Scanner Dashboard , a powerful tool designed to help traders identify key candlestick reversal patterns across multiple currency pairs. This scanner is equipped to detect a wide variety of candlestick formations, allowing for timely identification of market turning points and enhancing your trading strategy. Key Features: Effortless Multicurrency Scanning
Monitor numerous currency pairs in real-time and receive instant alerts when significant ca
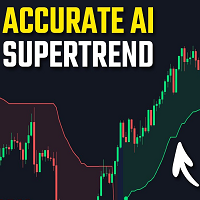
Machine Learning Adaptive SuperTrend - Take Your Trading to the Next Level!
Introducing the Machine Learning Adaptive SuperTrend , an advanced trading indicator designed to adapt to market volatility dynamically using machine learning techniques. This indicator employs k-means clustering to categorize market volatility into high, medium, and low levels, enhancing the traditional SuperTrend strategy. Perfect for traders who want an edge in identifying trend shifts and market condit

The indicator is a histogram for scalping the lower timeframes
When the hill behind appears go short and when it disappears go long
The indicator has only sound alerts
The colors can be adjusted as preferred
Suitable for lower timeframes - 1 - 5 minutes
Test in demo before purchase
Enjoy -----------------------------------------------------------------------

Leonardo Breakout SMC – Advanced Trading Indicator
Overview The Leonardo Breakout SMC is a masterpiece of precision and innovation, crafted for those who seek to understand and harness the unseen forces within the market. Just as Da Vinci observed the natural world with meticulous detail, this MetaTrader 4 (MT4) indicator reveals the hidden structures of price movement, enabling traders to capture the essence of smart money concepts (SMC) and execute flawless breakout strategies. Every elem
FREE

Statistical Trend Indicator is an advanced custom indicator designed to analyze market movements and provide traders with calculated probabilities of upward or downward trends. By analyzing historical price data over a specified lookback period, this indicator computes the likelihood of the market continuing in either direction, offering traders a statistical edge in decision-making.
Key Features: Probability Display: It calculates and displays the percentage probabilities of an upward or dow

Scopri l'Indicatore Avanzato di Zone di Offerta e Domanda Sei pronto a portare il tuo trading al livello successivo? L'indicatore "Advanced Supply and Demand Zone" è lo strumento definitivo per identificare con precisione le zone chiave di supporto e resistenza sul mercato, permettendoti di prendere decisioni informate e tempestive. Come Funziona Questo indicatore innovativo analizza il mercato utilizzando frattali veloci e lenti per individuare i punti di inversione del prezzo. Si basa sui prin
Bu gösterge, ticaret terminalindeki grafiklerin ekran görüntülerinin rahat ve hızlı bir şekilde oluşturulması için tasarlanmıştır. Grafikleri belirli bir dizine kaydetme işlemini büyük ölçüde basitleştirir ve grafik üzerinde tek bir tıklama ile etkinleştirilen bir düğme ile kullanışlı bir arayüz sağlar.
Göstergenin ana işlevleri şunlardır:
Düğmeye basıldığında otomatik olarak bir grafik ekran görüntüsü oluşturma. Ekran görüntülerini kaydetmek için bir dizin seçme imkanı. Bir grafik üzerinde
FREE

Bu gösterge, mevcut grafik ayarlarını tek bir düğmeye tıklayarak bir şablona kaydetmenize olanak tanıyarak grafik şablonları oluşturma sürecini basitleştirir. Gösterge, şablonu belirli bir ad ve önekle otomatik olarak kaydeden ve şablonları düzenlemeyi ve kullanmayı kolaylaştıran bir düğmeyi doğrudan grafiğe ekler.
Göstergenin ana işlevleri şunlardır:
Düğmeye tek bir tıklama ile mevcut grafiğin bir şablonunu oluşturma. Şablon adı için bir önek belirleme imkanı, bu da onları ayırt etmeyi kol
FREE
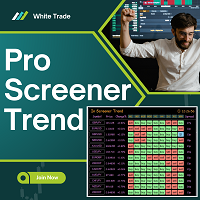
Profesyonel Eleme Trendi Pro Screener Trend ticaret göstergesi, modern makine öğrenimi algoritmalarını kullanarak finansal piyasalardaki trendin yönünü belirlemek için tasarlanmıştır. Bu gösterge, hem yeni hem de deneyimli yatırımcılara pozisyon açma ve kapatma konusunda net sinyaller sağlayarak ticareti büyük ölçüde kolaylaştırabilir.
Temel Özellikler: 1. Birden fazla para biriminin bulunduğu kontrol paneli: Gösterge, 10'dan fazla döviz çiftinin trendlerini aynı anda görüntüleyen etkileşimli
FREE
FVG Bölge Göstergesi, piyasadaki Adil Değer Boşluklarını (FVG) belirlemek ve adil değer ile piyasa fiyatı arasındaki fiyat dengesizliklerini vurgulamak için tasarlanmış güçlü bir araçtır. Boşlukların bu şekilde kesin bir şekilde belirlenmesi, yatırımcıların potansiyel piyasa giriş ve çıkış noktalarını tespit etmelerini sağlayarak, bilinçli işlem kararları alma yeteneklerini önemli ölçüde artırır. Sezgisel ve kullanıcı dostu arayüzüyle FVG Bölge Göstergesi, grafikleri Adil Değer Boşlukları açıs
Ephraim Umpan Göstergesi, Manuel Ticaret yapmak isteyen Forex Yatırımcıları için harika bir göstergedir. Bu gösterge ile her yatırımcı, işlemlerinde avantaj elde edecek ve harika, istikrarlı sonuçlar elde edecektir. Bu gösterge yalnızca Piyasadan nasıl öğrenebileceğimizin bir kanıtı değildir. Üstelik bu gösterge harika bir araçtır. Forex Piyasasında büyük gelir elde etmek için bu aracı kullanalım.
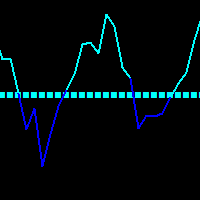
Çeşitli ticaret sistemleri için basit bir gösterge. Fiyat yönünde erken sinyaller verir.
Ana düzeltilmiş bir eğilim ve kısa vadeli yönlerin bir kayması var. Kullanırken, hesaplama yöntemini seçebilir ve ana eğilimi düzeltebilirsiniz, kalan parametreler zaten yapılandırılmıştır.
Kullanımı kolay, sadece programa eklemeniz ve ticaret için basit bir öneri izlemeniz gerekir.
Satın Alımlar için Sinyal: Ana Trend + Mavi Sinyal Hattı Mavi Kareleri Yukarı doğru geçiş 0. Satış sinyali: mavi Mavi
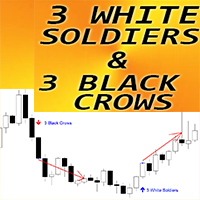
Forex Indicator " 3 White Soldiers & 3 Black Crows patterns" for MT4 Indicator "3 White Soldiers & 3 Black Crows" is very powerful for Price Action trading: No repaint, No delays; Indicator detects 3 White Soldiers and 3 Black Crows patterns on chart: Bullish 3 White Soldiers pattern - Blue arrow signal on chart (see pictures) Bearish 3 Black Crows pattern - Red arrow signal on chart (see pictures) P C, Mobile & Email alerts are included Indicator " 3 White Soldiers & 3 Black Crow
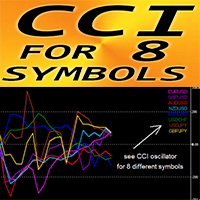
Forex Indicator "CCI for 8 Symbols" for MT4. CCI is one of the most popular oscillators for trading Commodity Channel Index (CCI) measures the difference between the current price and the historical average price. Important levels: +/-200; It is great to take Sell entries from above +200 zone and Buy entries from below -200 "CCI for 8 Symbols" gives opportunity to control CCI values of up to 8 different symbols just on 1 chart
This indicator is excellent to combine with Price Action entri
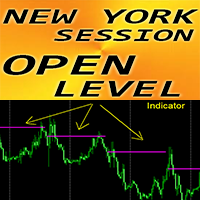
Forex Indicator "New York Session Open Level" for MT4 Indicator "New York Session Open Level" is very useful auxiliary indicator for intraday trading Session open price level is so important because very often price returns back to that area during the day. Indicator shows you NY session open price level daily for each day Also indicator shows week open level on Mondays It is useful for intraday traders to set up targets or use as support/resistance area. // More great Expert Advisors and In
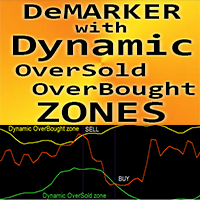
Forex Indicator "DeMarker with Dynamic OverSold/OverBought zones" for MT4. DeMarker oscillator curve indicates the current price position relative to previous highs and lows during the indicator calculation period It is great to take Sell entries from dynamic OverBought zone and Buy entries from dynamic OverSold zone T his indicator is excellent to combine with Price Action entries as well . . D ynamic OverBought zone - above yellow line
Dynamic OverSold zone - below green l
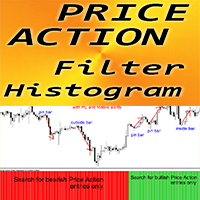
Price Action Filter Histogram - is an efficient auxiliary trading tool for Price Action trading! This indicator suggests to trader the direction of entries. Then trader just need to search for Price Action signals in that direction. Price Action Filter Histogram should be combined with Price Action patterns and support/resistance levels Green color histogram - Look for Bullish entries Red color histogram - Look for Bearish entries There are plenty of opportunities to upgrade eve
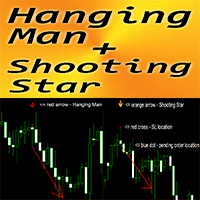
Forex Indicator " Hanging Man and Shooting Star pattern" for MT4 Indicator " Hanging Man and Shooting Star pattern " is very powerful indicator for Price Action trading: No repaint, No delays; Indicator detects bearish Hanging Man and Shooting Star patterns on chart: Bearish Hanging Man - Red arrow signal on chart (see pictures) Bearish Shooting Star - Orange arrow signal on chart (see pictures) P C, Mobile & Email alerts are included Indicator " Hanging Man and Shooting Star" is
Order Block Tracker is here to solve one of the biggest challenges traders face: identifying order blocks. Many traders fail to spot these critical zones, often missing out on key market entries. But with Order Block Tracker , you no longer have to worry about that. This advanced indicator automatically highlights these crucial zones for you, giving you the confidence to enter the market at the right time. MT5 Version - https://www.mql5.com/en/market/product/123362/ Key Features of Order Block

Detailed blog post with extras downloads: https://www.mql5.com/en/blogs/post/759154
About: Price ranges most of the time in forex… Like 70-80% of the time. And then it breaks out of the range to continue in a trend. Even in a trend, price makes smaller ranges all the time. Range Breaker Scalper is a tool to find the times when price breaks out of a range. A sudden break means that price will continue on for next few bars towards the breakout. So, these areas are best for scalping. Especially i

To access the TD sequential Scanner for MT5, please check https://www.mql5.com/en/market/product/123369?source=Site +Market+My+Products+Page. One of the MT5 versions includes additional timeframes such as M1, M2, M3,H2,H6,H8 and so on.( https://www.mql5.com/en/market/product/123367?source=Site +Market+My+Products+Page) TD Sequential Scanner: An Overview The TD Sequential scanner is a powerful technical analysis tool designed to identify potential price exhaustion points and trend reversals in fi

THE INDICATOR WITH A DOUBLE MOVING AVERAGE (MA).
Recommendations: The indicator works better if two lines are of the same color at the same time. (if one is green and the other is red, the price is in the flat zone (it's better not to do anything)).
Input parameters:
1. The period of the first and second MATCH. 2. The thickness of the line of the first and second MATCH. 3. The color of the line of the first and second MATCH.
I would appreciate it if you rate my other products as
FREE
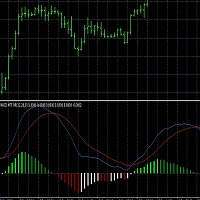
This script generates a MACD with 6 color-coded histogram bars based on the position (above or below zero) and direction (rising or falling) of the histogram. It provides multi-time frame support , allowing users to view the MACD from different time frames on a single chart. The indicator uses customizable settings for MACD periods, histogram width, and vertical scaling. This script could be useful for traders who want a visually enhanced MACD with clearer trend and momentum representation acro
FREE

CYCLE WAVE OSCILLATOR indicator is an indicator based on cyclical price fluctuations. This indicator can help you determine overbought and oversold levels, and help you predict price trends within the cycle. MT5 Version here! You can combine it with our indicators below to make your trading decisions more accurate: Supply Demand Ribbon MT4 Basic
Feature: - Three Trend Types: + Zero + Basic + Advanced
FREE

This scanner is for showing Cross of various TDI elements: PriceLine, Trade Signal Line and Market Base Line And for getting alerts, so you can be prepared for finding good trade setups before they happen. It also shows TDI signals, trend, volatility and different timeframe alignment.
Detailed blog post:
https://www.mql5.com/en/blogs/post/759050
Features: Show TDI Signal and Trend Show Volatility & Overbought/Oversold Show cross between: PriceLine & TSL PriceLine & MBL MBL & TSL PriceLine

The Great Oracle is a powerful trend-following indicator designed for traders who seek precision in their entries and exits. Whether you’re navigating trending markets or spotting opportunities in ranging conditions, The Great Oracle provides you with accurate signals and a second chance to join strong market trends. It’s the ultimate tool for traders who want to maximize profits while keeping risks manageable. Key Features: • Can be used for any asset: Metal (Gold), Cryptocurrency (Bitcoin), Cu
Simple SuperTrend indicator, similar to that of TradingView's.
It has buffers for buy and sell signal, if you want to integrate this into an EA.
It helps traders easily identify trends by providing clear buy and sell signals based on price movements. Designed for simplicity, it’s easy to use and integrates well with various trading strategies, making it a great option for traders of all levels.
Happy trading!
FREE
Customisable Timelines Indicator for MT4
Transform your technical analysis with our Customisable Timelines Indicator for MT4! This powerful indicator allows you to mark specific moments on the chart by plotting vertical lines at times set by you. Ideal for highlighting market openings, important economic events, or any other crucial moment for your trading strategies.
Main features:
Flexible Configuration: Adjust the schedules of the vertical lines as per your need. Clear Viewing: Coloure
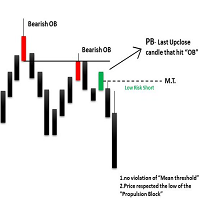
The ICT Propulsion Block indicator is meant to detect and highlight propulsion blocks, which are specific price structures introduced by the Inner Circle Trader (ICT). Note: THIS IS MTF version. Single Timeframe version avaiable at here
Propulsion Blocks are essentially blocks located where prices interact with preceding order blocks. Traders often utilize them when analyzing price movements to identify potential turning points and market behavior or areas of interest in the market.

This scanner uses Quarters Theory. It finds the nearest quarters to current price. And when price gets close within a few points, then it highlights and sends alerts. Features: Define Major Quarters Distance for every timeframe Option to use: Half Point between majors Quarters between half point and majors Search for nearest quarter point and price Show Highlight and send Alerts Show/Hide Quarter Lines Show/Hide Price and QP Distance
Detailed post and Extras: https://www.mql5.com/en/blogs/post
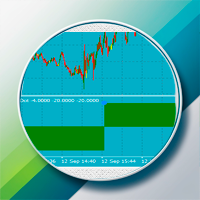
A powerful tool for traders that helps analyze market trends and make informed decisions in the currency market. The indicator uses advanced algorithms to determine the direction of the trend. The indicator automatically identifies the current trend based on historical data, allowing traders to quickly respond to market changes. Users can easily customize the indicator's parameters according to their trading strategies and preferences. The simplicity of use makes the indicator accessible to both
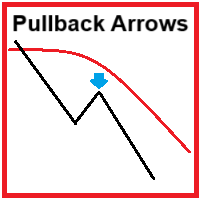
The indicator provides buy and sell arrows with a moving average
The arrows are based on a reversal algorithm - Different than my other indicator MA with Arrows that is continuation based
Only buy arrows are shown above the moving average and only sell arrows are shown below the moving average - Where the candle closes
The arrows are non repaint
Alerts can be activated as preferred
Suitable to any timeframe or instrument of choice
Please test in demo before purchase
Available to

Features:
Sharkfin Alerts Multi-timeframe Multi-currency SM TDI: To show TDI lines with sharkfin levels Zigzag MTF: To see Higher Timeframe trend Detailed blog post and extras: https://www.mql5.com/en/blogs/post/759138
Arrows works on a single timeframe and single currency. But it’s visually helps see that sharkfins. You can also get the simple arrows from mql5 site product: https://www.mql5.com/en/market/product/42405
About Scanner: It is an easy to use simplified scanner. It will show w

Filter out small price movements and focus on the larger trend . Renko chart indicator will help you to filter out a minor price movements so that you can focus on the overall trend. The price must move a specified amount to create a Renko brick. This makes it easy to spot the current trend direction in which the price is moving. My #1 Utility : includes 65+ features | Contact me if you have any questions | MT5 version In the settings of the indicator, you can configure: Calculation Se
** NOTE: This indicator uses realtime data. Thus DO NOT download Demo version. If you still need demo version, please refer to free version .
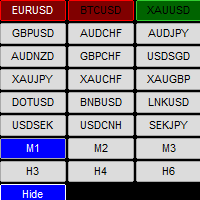
Symbol Chart Changer is an indicator/utility that offers you the option to switch between symbols and timeframes.
You can choose any symbol and timeframe on the same chart with just a few clicks. In addition, this indicator also shows the profit of the symbol through the color of the buttons.
Features: Click buttons on the chart to monito
Nadaraya Watson Envelop Scanner for MetaTrader 4 Overview
The Nadaraya Watson Envelop Scanner for MT4 is a powerful multi-symbol and multi-timeframe tool that extends the functionality of the Nadaraya Watson Envelop indicator. By scanning across multiple symbols and timeframes, this scanner allows traders to detect key signals and trend reversals efficiently within the MT4 environment. Key Features Multi-Symbol & Multi-Timeframe Scanning : Automatically scans various symbols and timeframes to
Ephraim Umpan Gold Coins Magnet Indicator is an Indicator that helps traders do the decisions. With this Indicator, Every trader will now have an edge in trading and will be more profitable in their trades. Accordingly, this indicator can help increased the winning capability of every trader. Would you like to try of this indicator? Now is your chance to do so.

Dynamic Forex28 Navigator - Yeni Nesil Forex Ticaret Aracı. ŞU ANDA %49 İNDİRİM.
Dynamic Forex28 Navigator, uzun zamandır popüler olan göstergelerimizin evrimidir ve üçünün gücünü tek bir göstergede birleştirir: Gelişmiş Döviz Gücü28 Göstergesi (695 inceleme) + Gelişmiş Döviz İMPULS ve UYARI (520 inceleme) + CS28 Kombo Sinyalleri (Bonus).
Gösterge hakkında ayrıntılar https://www.mql5.com/en/blogs/post/758844
Yeni Nesil Güç Göstergesi Ne Sunuyor? Orijinallerde sevdiğiniz her şey, şimdi ye

Gösterge, seçilen bir dönem boyunca boğalar ve ayılar arasındaki dengesizliği ölçer ve iki nokta arasında düz bir çizgi gösterir.
Boğalar ayılardan daha fazla hacme sahipse, çizgi yeşile döner. Ayılar daha fazla hacme sahipse kırmızı olur. Çizgi ayrıca hacimdeki yüzde farkını da gösterir.
Gösterge aynı verileri ayrı bir pencerede gösterir. Bölünmüş hacmi de görebilirsiniz.
Göstergenin iki modu vardır.
Bu amaçla, sol üstte bir düğme vardır,
- basılı değilse, piyasadaki rastgele bir
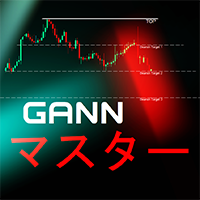
GANN’ın kesin hedefleri, yıllarca test edilmiş yöntemlerine dayanarak hesaplanır ve karşınızda sunulur. Bu araç, ticareti daha kolay ve sezgisel hale getirmek için tasarlanmıştır. Beyaz çizgiyi yukarı veya yeşil çizgiyi aşağı doğru hareket ettirdiğinizde, GANN'ın tekniklerinin ticaret dünyasında neden hala etkili olduğunu hemen anlayacaksınız. GANN’ın stratejileri, piyasa hareketlerini yüksek bir doğrulukla tahmin etmeye odaklanır ve bu araç bu gücü parmaklarınızın ucuna getirir. İster deneyimli
MetaTrader mağazası, geliştiricilerin alım-satım uygulamalarını satabilecekleri basit ve kullanışlı bir sitedir.
Ürününüzü yayınlamanıza yardımcı olacağız ve size Mağaza için ürününüzün açıklamasını nasıl hazırlayacağınızı anlatacağız. Mağazadaki tüm uygulamalar şifreleme korumalıdır ve yalnızca alıcının bilgisayarında çalıştırılabilir. İllegal kopyalama yapılamaz.
Alım-satım fırsatlarını kaçırıyorsunuz:
- Ücretsiz alım-satım uygulamaları
- İşlem kopyalama için 8.000'den fazla sinyal
- Finansal piyasaları keşfetmek için ekonomik haberler
Kayıt
Giriş yap
Gizlilik ve Veri Koruma Politikasını ve MQL5.com Kullanım Şartlarını kabul edersiniz
Hesabınız yoksa, lütfen kaydolun
MQL5.com web sitesine giriş yapmak için çerezlerin kullanımına izin vermelisiniz.
Lütfen tarayıcınızda gerekli ayarı etkinleştirin, aksi takdirde giriş yapamazsınız.