MetaTrader 4용 새 기술 지표 - 3

Session Average Date Range: Analyze and average the low - high of specific trading sessions within custom date ranges, offering insights into price movements and market behavior over selected periods. The "Session Average Date Range" tool is an advanced analytical utility designed to empower traders and analysts by allowing them to dissect and evaluate the high and low range of specific trading sessions within a user-defined date range. This tool provides a flexible and precise approach to analy
FREE

FREE Spread indicator for MetaTrader 4 this indicator includes: -average spread -current spread -minimum spread -maximum spread
If you are interested in my products I recommend you visit my page where you can find: Experts Advisors: https://www.mql5.com/it/market/product/119456?source=Site+Profile indicators: https://www.mql5.com/it/market/product/120038?source=Site+Profile
I hope the spread indicator will be useful to you.
https://www.mql5.com/it/users/kappa05
FREE

Order block hunter indicator is the best indicator for hunt the order blocks that area where there has been a large concentration of limit orders waiting to be executed Order blocks are identified on a chart by observing previous price action and looking for areas where the price experienced significant movement or sudden changes in direction .This indicator does that for you by using very complicated codes and helps you to take the best areas To buy and sell because it make marks at the best a

Introducing the Volume Order Blocks indicator, a game-changing tool designed for traders who demand precision and clarity in their market analysis. This advanced indicator not only identifies order blocks but also integrates crucial volumetric data, allowing you to gauge the strength of these blocks with unparalleled accuracy. MT5 version - https://www.mql5.com/en/market/product/121238/ Key Features of the Volume Order Blocks: Bullish & Bearish Order Blocks: Easily visualize and dif
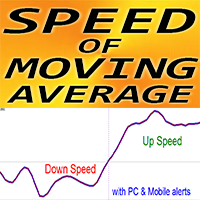
MT4용 외환 지표 "MA 속도", 리페인트 없음.
이동 평균 속도 - 고유한 트렌드 지표
이 지표의 계산은 물리학의 방정식을 기반으로 합니다. 속도는 이동 평균의 1차 도함수입니다. MA 속도 지표는 MA 자체가 방향을 얼마나 빨리 바꾸는지 보여줍니다. MA 속도로 표준 전략도 업그레이드할 수 있는 기회가 많습니다. SMA, EMA, SMMA 및 LWMA에 적합합니다. MA 속도는 트렌드 전략에서 사용하는 것이 좋습니다. 지표 값이 < 0이면 트렌드가 하락하고 지표 값이 > 0이면 트렌드가 상승합니다. 시간 프레임 - 모두; 거래 쌍 - 모두 지표에는 모바일 및 PC 알림이 내장되어 있습니다.
매개 변수(설정이 매우 쉽습니다): 1) 속도 기간. 권장 값은 3~7입니다. 지표의 민감도는 속도 기간이 낮을 때 증가하고 그 반대의 경우도 마찬가지입니다. 2) MA 기간(이 MA의 속도가 계산됨) 3) MA 방법: SMA, EMA, SMMA, LWMA 4) MA 적용 가격(
Day Trader Edge is a Range Breakout Correlation With Multi Symbol Lookup (NON-REPAINT Enhance your trading strategy with our cutting-edge Indicator! This versatile tool is designed to provide precise breakout signals and comprehensive analysis to help you make informed trading decisions. Discover the features that make our indicator a must-have for any forex trader: -INDEPENDENT COMPLETE DAY TRADING SYSTEM- Key Features: Range Breakout Time-Based Analysis: Accurately identifies breakout level
"메이저 ADX" 지표는 외환시장에서 주요 통화쌍의 강세를 측정하는 데 사용되는 기술 도구입니다. 이는 추세의 강도와 방향을 결정할 수 있는 방향성 이동 지수(ADX)를 기반으로 합니다.
이 지표는 트레이더가 주어진 시간에 시장에서 가격 움직임이 얼마나 활발한지 알 수 있도록 도와줍니다. 또한 "메이저 ADX"는 주요 통화 중 리더의 변화에 대한 신호를 제공하여 거래 결정을 내리는 데 유용한 정보가 될 수 있습니다.
트레이더는 이 지표를 사용하여 교차 환율 거래에서 진입 및 청산 시점을 결정할 수 있습니다.
예를 들어 NZDUSD의 리더십(성장)에 대한 신호를 받았다고 가정해 보겠습니다. 이는 NzdChf를 매수해야 하고 AudNzd를 매도해야 한다는 뜻입니다. 행복한 거래 되세요!l ................................................... ...................................................
FREE

SpreadChartOscillator is an indicator that displays the spread line of a symbol in the subwindow of the oscillator. In the parameters it is possible to specify another symbol from which the spread line will be broadcast. If the "Symbol" parameter is left empty, the spread line will be displayed from the current symbol on which the indicator is set. This tool is ideal for traders who want to see the spread dynamics in the oscillator format and use it to protect themselves from entering the market
FREE

TickChartOscillator is an indicator that displays a symbol's tick chart in an oscillator subwindow. It offers flexible customization options, including: · The ability to hide the price line in the oscillator. · The option to specify a different symbol for tick chart display. If the "Symbol" parameter is left blank, the tick chart will be shown for the current symbol where the indicator is applied. This tool is perfect for traders who want to view tick dynamics in an oscillator format and u
FREE
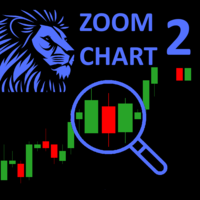
The ZoomChart indicator works with two charts - the current chart on which it is launched and the next one. The indicator translates the second chart to the time where the first one is now. Thus, the second chart depicts the same situation on the first chart (where the indicator is launched), but on a different time-frame. In other words, this indicator serves as a magnifying glass or, on the contrary, reduces the chart to display the situation on a larger time-frame.
The ZoomChar indicator a
FREE

DTFX Algo Zones are auto-generated Fibonacci Retracements based on market structure shifts.
These retracement levels are intended to be used as support and resistance levels to look for price to bounce off of to confirm direction.
USAGE Figure 1 Due to the retracement levels only being generated from identified market structure shifts, the retracements are confined to only draw from areas considered more important due to the technical Break of Structure (BOS) or Change of Character
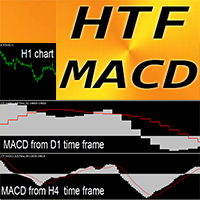
MT4용 외환 지표 HTF MACD 오실레이터
HTF는 - 상위 시간 프레임을 의미합니다. MACD 지표 자체는 트렌드 트레이딩에 가장 인기 있는 지표 중 하나입니다. 이 지표는 가격 액션 항목이 있는 다중 시간 프레임 트레이딩 시스템이나 다른 지표와 조합하는 데 탁월합니다. HTF MACD 지표를 사용하면 상위 시간 프레임의 MACD를 현재 차트에 첨부할 수 있습니다. --> 이는 전문적인 트레이딩 접근 방식입니다. 지표에는 모바일 및 PC 알림이 내장되어 있습니다.
// 더 훌륭한 전문가 자문가와 지표는 여기에서 확인할 수 있습니다. https://www.mql5.com/en/users/def1380/seller 이것은 이 MQL5 웹사이트에서만 제공되는 오리지널 제품입니다.
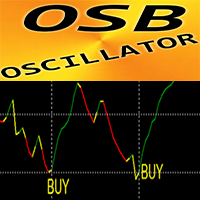
OSB 오실레이터 - 고급 사용자 지정 지표, 효율적인 가격 액션 보조 도구!
고급 새로운 계산 방법이 사용됩니다. 새로운 세대의 오실레이터 - 사용 방법을 확인하려면 그림을 참조하세요. OSB 오실레이터는 가격 액션, 다이버전스 및 과매도/과매수 신호에 대한 정확한 진입점을 찾는 보조 도구입니다. 과매도 값: 30 미만 과매도 값: 70 이상 이 지표로 표준 전략도 업그레이드할 수 있는 기회가 많이 있습니다. 표준 오실레이터보다 훨씬 빠르고 정확합니다. 지표 설정은 매우 쉽습니다. 민감도라는 매개변수가 하나뿐입니다. 사용 방법: 가격 액션 필터로(그림 참조) 주요 추세 방향의 진입 신호로(그림 참조) 정확한 신호가 있는 분기 지표로(그림 참조)
// 더 훌륭한 전문가 자문가와 지표는 여기에서 확인할 수 있습니다: https://www.mql5.com/en/users/def1380/seller 이 MQL5 웹사이트에서만 제공되는 오리지널 제품입니다.
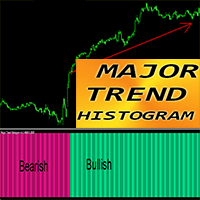
MT4용 외환 지표 "주요 추세 히스토그램"
매우 큰 추세를 포착하도록 설계된 주요 추세 히스토그램 지표 지표는 두 가지 색상으로 제공됩니다. 하락 추세의 경우 DeepPink, 상승 추세의 경우 SpringGreen(색상 변경 가능) 초기 단계에서 추세를 감지합니다. 표준 MA 교차보다 훨씬 효율적입니다. 주요 추세 히스토그램은 다른 거래 방식과 결합할 수 있습니다. 가격 활동, VSA, 기타 지표 지표에는 모바일 및 PC 알림이 내장되어 있습니다. ............................................................................................................................................... // 더 훌륭한 전문가 자문가와 지표는 여기에서 확인할 수 있습니다. https://www.mql5.com/en/users/def1380/seller 이 MQL5 웹사이트에서만
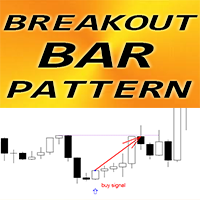
MT4용 외환 지표 "브레이크아웃 바 패턴"
지표 "브레이크아웃 바 패턴"은 가격 액션 거래에 매우 강력한 지표입니다. 다시 칠하거나 지연할 필요가 없습니다. 지표는 차트에서 브레이크아웃 바 패턴을 감지합니다. 강세 브레이크아웃 바 패턴 - 차트에 파란색 화살표 신호(그림 참조) 약세 브레이크아웃 바 패턴 - 차트에 빨간색 화살표 신호(그림 참조) PC, 모바일 및 이메일 알림 지표 "브레이크아웃 바 패턴"은 지지/저항 수준과 결합하기에 매우 좋습니다. ..................................................................................................................................................... // 더 많은 훌륭한 전문가 자문가와 지표는 여기에서 확인할 수 있습니다. https://www.mql5.com/en/users/def1380/seller 이 MQ
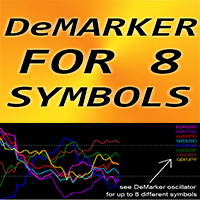
MT4용 외환 지표 "DeMarker for 8 Symbols", 리페인트 없음
DeMarker 오실레이터 곡선은 지표 계산 기간 동안 이전 최고가와 최저가에 대한 현재 가격 위치를 나타냅니다. DeMarker는 다른 오실레이터 중에서 가장 효율적인 정기적 발산 신호를 제공합니다. 매수 과다 영역(0.7 이상)에서 정기적 발산으로 매도 진입을 취하고 매도 과다 영역(0.3 미만)에서 정기적 발산으로 매수 진입을 취하는 것이 좋습니다. "DeMarker for 8 Symbols"는 단 하나의 차트에서 최대 8개의 다른 심볼의 DeMarker 값을 제어할 수 있는 기회를 제공합니다. 이 지표는 매도 과다/매수 영역의 가격 액션 진입과 결합하기에 매우 좋습니다.
// 더 많은 훌륭한 전문가 자문가와 지표는 여기에서 확인할 수 있습니다. https://www.mql5.com/en/users/def1380/seller 이 MQL5 웹사이트에서만 제공되는 오리지널 제품입니다.
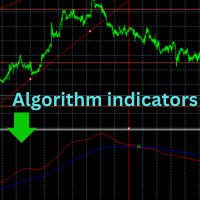
Welcome, thank you for choosing us Read carefully before starting When you turn on the indicator, leave it for about an hour or two. It will automatically collect the data, and then its shape will be complete and it will start balancing the new data. We offer you the latest indicators that will help you make decisions after creating your own technical analysis
You will see the entry point that you will use to get a good deal
At each intersection there is an opportunity for a deal that the i
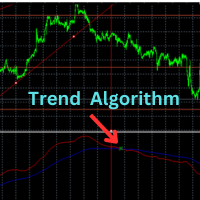
Welcome, thank you for choosing us
Read carefully before starting
If you want to trade on a demo account, put the indicator there. If you want to trade on a real account, put the indicator there and wait about two hours for the data to be collected again. The data differs between the demo and real accounts in several factors. We offer you the latest indicators that will help you make decisions after creating your own technical analysis
You will see the entry point that you will use to get

User feedback : "This indicator is collection of important dynamic support and resistance giving a trader crystal clear idea , where to sell and where to buy. it completely complements trend lines, support, resistance, and sideways market and allow a trader to make sustainable profits. The thickness of lines suggests its strengths, the thicker the dynamic line, the stronger is rejection or pullback allowing a trader to make multi-fold profit, as they can clearly see them."
Introducing Your Ult

This indicator is based on Zigzag. It shows the HH, HL, LL, LH counts. This helps in finding ongoing trends. Or ranges:
Features: Show symbols for: Higher-Highs, Higher-Lows Lower-Lows, Lower-Highs And show counter for each Non-repainting option Customize Color and horizontal/vertical labels Corresponding scanner dashboard: https://www.mql5.com/en/market/product/85346
Symbols Described: HH = Higher-Highs (Current price high is more than previous high) HL = Higher-Lows (Current price low is
FREE

Simple but great indicator to improve your trading. ----------------------------------------------------- Test it as it proves its value with its results.
Settings: AlertConfirmation: turns on and off alerts CalculatedBars: how many bars will be calculated Distance : arrow distance
Buffers: Buffer0 (Arrow Buy) Buffer1 (Arrow Sell) Buffer2 (Buy value 1) Buffer3 (Sell value 1)
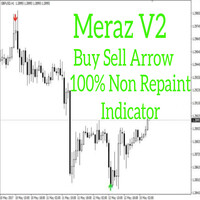
Hello
Alright. This indicator works on MT4 and is very easy to use. When you receive a signal from it, you wait for that candle with the signal to close and you enter your trade at the beginning of the next new candle. A red arrow means sell and a green arrow means buy. All arrows comes with a long dotted like for easy identification of trade signal. Are you okay with that? 100% non repaint Work All Major currency Pair, 1 minute time frame 1 minute expire, 5 minute timeframe 5 minute expire
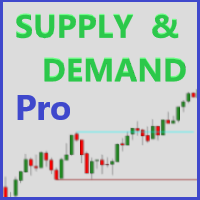
Supply and Demand Professional is a powerful tool suited for advanced traders! Easily see levels of supply and demand (or support and resistance) as they develop. *This is a NON-repainting indicator* How this can help you?
Levels can be used for stop loss and take profit targets Automatically identifying key levels in the market Spotting market imbalances Better entry levels and timing of trades Volume analysis Understanding market sentiment Predicting price movements Risk management Trend c

This indicator is based on a leading version of the EURUSD proxy trade, such that the day's underlying direction can be inferred through the intraday volatility and market noise.
Market price action is deceptive, misleading, no one has ever profitted consistently by just following latest price action. This also fools single market and momentum based indicators, since the main data used is market price.
Intermarket analysis on the other hand can tell what the broader market action is, across

Please contact me after purchase to immediately get your PDF strategy + documentation for Trend Pulse !
Official release price of $89 (3 /50 copies left). Next price is $199 .
Introducing Trend Pulse , a unique and robust indicator capable of detecting bullish, bearish, and even ranging trends! Trend Pulse uses a special algorithm to filter out market noise with real precision. If the current symbol is moving sideways, Trend Pulse will send you a ranging signal, letting you know that it'

제품을 구매하기 전에 아래 정보를 읽어보세요!
Apollo Pips PLUS SP는 독특한 제품입니다! 모든 거래 지표에 액세스할 수 있는 새로운 "APOLLO PIPS" 지표와 "슈퍼 팩" 보너스를 받고 싶은 분들을 위한 것입니다! Apollo Pips PLUS SP 제품을 구매하면 실제로 Apollo Pips 표시기의 완전히 새로운 버전을 구매하게 됩니다. 이 버전의 지표에는 개선된 알고리즘과 사용하기 쉬운 매개변수가 있어 모든 시장 및 거래 스타일에서 지표를 사용할 수 있는 기회를 제공합니다. 이 제품의 구매자는 슈퍼 보너스로 다른 모든 표시기에 무료로 액세스할 수 있습니다! 내 모든 거래 도구에 액세스하고 싶었다면 이 제품이 당신에게 딱 맞습니다! :) 하지만 이것이 전부는 아닙니다! :) 이 제품의 모든 구매자는 또한 내 새로운 지표를 무료로 받을 자격이 있습니다! :) 새로운 거래 지표를 사용할 수 있게 되었는데, 귀하는 저의 특별한 "SUPER PACK" 평생 보너스

A complex of indicators of recognizing reversal moments. Detects the peaks and hollows according to the combinations of candles after they deduct from two MA. Applicable for trading systems when using early inputs. You can use a trend for scalping and intraday trade, and for detecting a trend in the early stages.
Possibilities
The parameters provide flexible settings for any time floms and trading tools. There are several types of warning for signals. Yellow arrow - Sell signal , pink arr

This product is based on the methodologies of Gann, his follower Don E. Hall. The Indicator builds a working view grid, which is used to analyze graphics. The Pyrapoint tool, developed by Don Hall, is a grid based on the Pythagorean cube. In his calculations he uses the Gann Square 9 methodology and the relationship between Price and Time. This tool is used to predict changes in trend and overall market actions.
More information about the method HERE
MA Killer Indicator는 이동 평균을 사용하는 트레이더를 위한 최고의 무기입니다. 이는 관리 패널에서 직접 액세스할 수 있는 여러 도구를 사용하는 완전한 시스템입니다. 해당 도구 덕분에 시장 개요를 파악하고 입사를 위한 의사 결정에 귀중한 도움을 받을 수 있습니다.
그것은 다음과 같이 구성됩니다:
- 색상 코드를 사용하여 차트에 추세를 직접 표시하는 추세 차트 마스터 표시기입니다. 이 추세는 두 개의 이동 평균과 여러 오실레이터를 사용하는 알고리즘으로 계산됩니다.
- 9개 시간 단위에 걸쳐 여러 이동 평균(최대 4개)과 관련된 가격 위치를 표시하는 시장 스캐너인 이동 평균 스캐너 표시기입니다.
- 여러 이동평균을 독립적으로 표시할지 여부입니다. 표시기 탭을 통해 추가하거나 제거할 필요가 없습니다.
MT5 version
각 시스템에는 팝업, 이메일 및 푸시 알림을 통해 받을 수 있는 경고가 있습니다. 경고는 제어판을 통해 직접 활성화되거
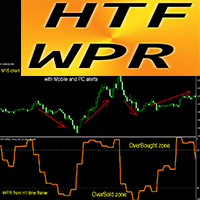
강력한 외환 지표 HTF WPR 오실레이터 MT4용
MT4용 전문 HTF WPR 오실레이터로 거래 방법을 업그레이드하세요. HTF는 - 더 높은 시간 프레임을 의미합니다. WPR은 스캘핑을 위한 최고의 오실레이터 중 하나입니다. 이 지표는 과매도/매수 영역에서 가격 액션 항목이 있는 다중 시간 프레임 거래 시스템에 적합합니다. HTF WPR 지표를 사용하면 더 높은 시간 프레임의 WPR을 현재 차트에 첨부할 수 있습니다 --> 이는 전문적인 거래 방식입니다. 지표에는 모바일 및 PC 알림이 내장되어 있습니다.
// 더 훌륭한 전문가 자문가와 지표는 여기에서 확인할 수 있습니다. https://www.mql5.com/en/users/def1380/seller 이 MQL5 웹사이트에서만 제공되는 오리지널 제품입니다.

It is FREE on EURUSD chart. All Symbols version! Contact me for any questions Introduction The breakout and retest strategy is traded support and resistance levels. it involves price breaking through a previous level. The break and retest strategy is designed to help traders do two main things, the first is to avoid false breakouts. Many false breakouts start with a candlestick that breaks out of a level but ends with an immediate candlestick that brings the price back into the level. The
FREE

ARFX link: https://linktr.ee/ARFX_Auto_Trade I made this Alligator Indicator with the concept of multi time frame monitors where friends can directly use the signals that appear with reference If a Buy Signal appears from D1 to M1, then we just focus on buying using the Breakout Candle as a reference If a Sell Signal appears from D1 to M1, then we just focus on Sell using the Breakout Candle as a reference If you want to get this indicator for free then you have to join the ARFX IB line https:
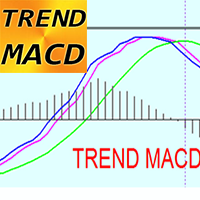
MT4용 TREND MACD 지표 - 훌륭하고 효율적인 거래 도구입니다!
이 지표는 큰 가격 변동을 포착하는 데 집중하는 트렌드 트레이더에게 좋습니다. TREND MACD는 3개의 선으로 구성되어 있습니다. 녹색 선 - 주요 추세 방향을 표시하고, 파란색 및 자홍색 선은 진입 및 종료를 나타냅니다. 지표를 사용하면 수익을 극대화할 수 있습니다. 수익성 있는 거래에서 너무 일찍 종료하지 마십시오. 지표에는 모바일 및 PC 알림이 내장되어 있습니다. 지표 사용 방법(그림 참조): 1) 파란색 및 자홍색 선이 모두 녹색 선 위에 있는지 확인합니다. 2) 그런 다음 파란색 선이 자홍색 선 위에 있으면 매수합니다. 3) 파란색 선이 자홍색 선 아래에 있으면 거래를 종료합니다. 4) 단기 거래의 경우 그 반대입니다.
// 더 많은 훌륭한 전문가 자문가 및 지표는 여기에서 확인할 수 있습니다. https://www.mql5.com/en/users/def1380/seller 이 MQL5
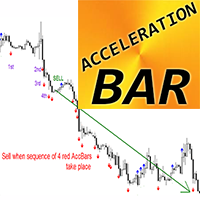
MT4용 외환 지표 가속 막대 - 거대한 추세를 포착할 수 있음
지표 "가속 막대"는 추세 거래를 위한 매우 강력한 도구입니다. 시장 침체 영향이 최소화됩니다. 상승 가속 막대(파란색)는 이전 5개 막대의 최대값보다 높고 최소값이 다음 5개 막대의 최소값보다 낮은 차트의 막대입니다. 하락 가속 막대(빨간색)는 이전 5개 막대의 최소값보다 낮고 최대값이 다음 5개 막대의 최대값보다 높은 차트의 막대입니다. 추세 거래: 매수 신호 - 차트에 4개의 상승 가속 막대가 연속으로 나타날 때 매도 신호 - 차트에 4개의 하락 가속 막대가 연속으로 나타날 때 PC, 모바일 및 이메일 알림이 포함되어 있습니다.
// 더 많은 훌륭한 전문가 자문가와 지표는 여기에서 확인할 수 있습니다: https://www.mql5.com/en/users/def1380/seller 이 MQL5 웹사이트에서만 제공되는 오리지널 제품입니다.
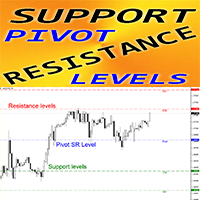
MT4용 외환 지표 "피벗 지지 저항 수준 일 주 월"
지표 "피벗 SR 수준 D_W_M"은 가격 액션 거래를 위한 매우 강력한 보조 지표입니다. 이 특정 지표는 계산에 피보나치 수를 사용합니다. 피벗 수준은 이전 거래 기간의 시장 성과에서 중요한 가격의 평균으로 계산됩니다. 피벗 수준 자체는 전체 시장 상황에 따라 가장 높은 저항 또는 지지 수준을 나타냅니다. 지표 "피벗 SR 수준 D_W_M"은 가격으로 도달할 수 있는 가장 가능성 있는 반전 수준을 보여줍니다. R - 수준(빨간색) - 저항 S - 수준(녹색) - 지지 일일, 주간 및 월간 이전 거래 기간은 계산 설정에서 사용할 수 있습니다. 지표 "피벗 수준 D_W_M"은 가격 액션 패턴을 통해 이익 실현 목표 또는 가격 반전을 계획하는 데 탁월합니다.
지표 사용 방법: 1) 지표를 해당 차트에 첨부합니다. 2) 필요한 설정을 선택하고 확인 버튼을 누릅니다. 3) 지표의 초기 정확한 계산을 위해 MT4에서 다른 시간

MT4용 외환 지표 "RSI와 2개 이동 평균"
이 지표는 모멘텀 거래 시스템에 매우 적합합니다. "RSI와 2개 MA" 지표를 사용하면 RSI 자체의 빠르고 느린 이동 평균을 볼 수 있습니다. 지표는 매우 일찍 추세 변화를 볼 수 있는 기회를 제공합니다. "RSI와 2개 MA"를 사용하면 추세 방향으로 모멘텀을 포착할 수 있습니다. 매개변수를 통해 이 지표를 설정하는 것은 매우 쉽습니다(그림 참조) 지표는 모든 시간 프레임에서 사용할 수 있습니다. ............................................................................................................................................... // 더 훌륭한 전문가 자문가와 지표는 여기에서 확인할 수 있습니다: https://www.mql5.com/en/users/def1380/seller 이 MQL5 웹사이트에서만
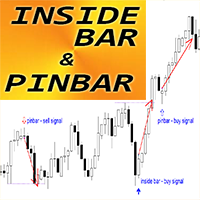
MT4용 외환 지표 "Inside Bar & PinBar Patterns"
지표 "Inside Bar & PinBar Patterns"는 가격 액션 거래에 매우 강력합니다. 지표는 차트에서 Inside Bar 및 PinBar 패턴을 감지합니다. 강세 패턴 - 차트에서 파란색 화살표 신호(그림 참조) 약세 패턴 - 차트에서 빨간색 화살표 신호(그림 참조) 다시 칠하지 않음; 지연 없음; Inside Bar 자체에 높은 R/R 비율(보상/위험)이 있음 PC, 모바일 및 이메일 알림 지표 "Inside Bar & PinBar Patterns"는 지원/저항 수준과 결합하기에 매우 좋습니다.
// 더 많은 훌륭한 전문가 고문 및 지표는 여기에서 확인할 수 있습니다. https://www.mql5.com/en/users/def1380/seller 이 MQL5 웹사이트에서만 제공되는 오리지널 제품입니다.
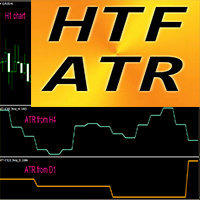
MT4용 외환 변동성 지표 HTF ATR
평균 참 범위 자체는 트레이더에게 가장 중요한 지표 중 하나입니다. 시장 변동성을 보여줍니다. HTF ATR은 기술 분석에 사용되는 시장 변동성 지표입니다. HTF는 - 더 높은 시간 프레임을 의미합니다. ATR은 동적 이익 실현/SL 위치를 계획하는 데 좋습니다. 예를 들어, 대부분의 최적 SL 값은 1.2-2.5 ATR 값에 있습니다. 이 지표는 모든 거래 시스템에 추가할 수 있는 유용한 도구입니다. HTF ATR 지표를 사용하면 더 높은 시간 프레임의 ATR을 현재 차트에 첨부할 수 있습니다. --> 이는 전문적인 거래 접근 방식입니다.
// 더 많은 훌륭한 전문가 자문가와 지표는 여기에서 확인할 수 있습니다. https://www.mql5.com/en/users/def1380/seller 이 MQL5 웹사이트에서만 제공되는 오리지널 제품입니다.
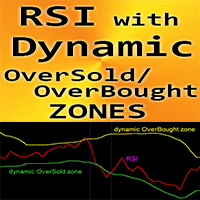
MT4용 외환 지표 "동적 과매도/과매수 구역이 있는 RSI"
RSI는 트레이딩에 가장 인기 있는 오실레이터 중 하나로, 스캘핑에 매우 좋습니다. 동적 과매수 구역에서 매도 진입을 취하고, 동적 과매도 구역에서 매수 진입을 취하는 것이 좋습니다. RSI 오실레이터는 또한 발산 감지에 매우 유용합니다. 이 지표는 과매도/매수 구역의 가격 액션 진입과 결합하는 데도 매우 좋습니다. 동적 과매수 구역 - 노란색 선 위 동적 과매도 구역 - 녹색 선 아래 ...................................... // 더 많은 훌륭한 전문가 자문가와 지표는 여기에서 확인할 수 있습니다: https://www.mql5.com/en/users/def1380/seller 이 MQL5 웹사이트에서만 제공되는 오리지널 제품입니다.

The Smart Divergence Dashboard is your ultimate tool for identifying high-probability trading opportunities. This cutting-edge indicator is meticulously designed to detect Regular Divergences, offering traders a clear and actionable advantage. MT5 Version - https://www.mql5.com/en/market/product/120703/ Key Features: Real-time Divergence Detection: Instantly pinpoints Higher High/Lower Low and Oscillator Higher Low divergences across multiple currency pairs and timeframes using Awesome Oscill

Iron: Your Guide to Mastering Trading Iron is an innovative trend indicator designed to precisely identify market directions and reversal points. This powerful tool enables traders to optimally manage their investments, minimizing risks and maximizing profits. Key Features and Benefits of Iron Intuitive Trend Identification: Iron shows the trend direction, allowing traders to make timely decisions about entering and exiting the market. High Success Rate: The indicator provides a high probabilit

Trend Divergence Indicator: Your Essential Tool for Market Analysis The Trend Divergence Indicator is a powerful tool designed to assist traders in identifying market trends and pinpointing entry points with precision. By leveraging price divergence, this indicator enhances your trading strategy, offering reliable insights and filtering unnecessary signals. Key Features and Benefits of the Trend Divergence Indicator Accurate Trend Analysis: The Trend Divergence Indicator uses price divergence t
MetaTrader 마켓 - 거래자를 위한 로봇 및 기술 지표는 거래 터미널에서 바로 사용할 수 있습니다.
The MQL5.community 결제 시스템은 MQL5.com 사이트의 모든 등록된 사용자가 MetaTrader 서비스에서 트랜잭션을 수행할 수 있습니다. 여러분께서는 WebMoney, 페이팔, 또는 은행 카드를 통해 자금을 예치하거나 인출하실 수 있습니다.
트레이딩 기회를 놓치고 있어요:
- 무료 트레이딩 앱
- 복사용 8,000 이상의 시그널
- 금융 시장 개척을 위한 경제 뉴스
등록
로그인
계정이 없으시면, 가입하십시오
MQL5.com 웹사이트에 로그인을 하기 위해 쿠키를 허용하십시오.
브라우저에서 필요한 설정을 활성화하시지 않으면, 로그인할 수 없습니다.