YouTubeにあるマーケットチュートリアルビデオをご覧ください
ロボットや指標を購入する
仮想ホスティングで
EAを実行
EAを実行
ロボットや指標を購入前にテストする
マーケットで収入を得る
販売のためにプロダクトをプレゼンテーションする方法
MetaTrader 4のための新しいテクニカル指標 - 3
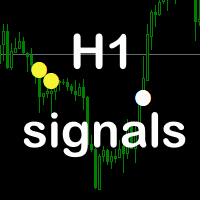
Semnal H1
Studiați indicatorul de semnal H1. Rezultate foarte bune. Este creat pentru gama H1.
Succes!
Note Dacă indicatorul nu este afișat, citiți comentariul meu în secțiunea de comentarii pentru a afla cum să faceți acest lucru.
IMPORTANT! Verificați mai întâi indicatorul sau expertul pe un cont DEMO, înainte de a-l cumpăra! Analizați-l bine!
Închiriați-l pentru o perioadă mai scurtă de timp. Pentru a vedea cum funcționează și dacă funcționează pe computer.

Volume Profile Indicator for MT4 Gain a trading edge with the "Volume Profile" indicator for MetaTrader 4 (MT4). This advanced technical analysis tool allows you to precisely identify key support and resistance levels based on transaction volume. Easily visualize market areas of high interest, where trading volumes are highest, and use this information to make more informed trading decisions. Key Features: Clear and detailed visualization : The indicator displays volume histograms directly on th

The principle of this indicator is very simple: detecting the candlestick pattern in M30 timeframe, then monitoring the return point of graph by using the pullback of High-Low of M5 Candlestick and finally predicting BUY and SELL signal with arrows, alerts and notifications. The parameters are fixed and automatically calculated on each time frame. Example:
If you install indicator on XAUUSD, timeframe M5: the indicator will detect the reversal, pullback, price action on this timeframe (for ex
FREE

The Accelerator Oscillator (AC) technical indicator measures the acceleration or deceleration of the current market strength. It is designed to identify potential trend reversal points and is used to determine the moment of buying or selling assets. The indicator helps traders make decisions based on changes in market dynamics. This implementation of the indicator is its creative version. Since the standard version is very limited by its built-in settings, this implementation has significantly
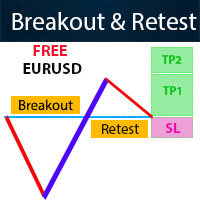
It is FREE on EURUSD chart. All Symbols version! Contact me for any questions Introduction The breakout and retest strategy is traded support and resistance levels. it involves price breaking through a previous level. The break and retest strategy is designed to help traders do two main things, the first is to avoid false breakouts. Many false breakouts start with a candlestick that breaks out of a level but ends with an immediate candlestick that brings the price back into the level. The
FREE

Săgeți H1 Este creat pentru gama H1. Funcționează mai bine pentru perechile EURUSD și EURJPY. Marcatorul nu revopsește. Succes! Dacă indicatorul nu este afișat, citiți comentariul meu în secțiunea de comentarii pentru a afla cum să faceți acest lucru. Verificați mai întâi indicatorul sau expertul pe un cont DEMO, înainte de a-l cumpăra! Analizați-l bine! Închiriați-l pentru o perioadă mai scurtă de timp. Pentru a vedea cum funcționează și dacă funcționează pe computer.

Trend oscillator indicator for tracking microtrends and pullbacks. Determines even a minor change in trend . Allows you to open positions in a timely manner in accordance with market changes. Works on all timeframes, all currency pairs, metals, indices and cryptocurrencies. Can be used when working with binary options. Distinctive features Does not redraw after the candle closes; Accurately detects trend changes; Simple and clear setup; Works on all timeframes and all trading instruments; Suit
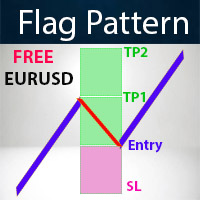
It is FREE on EURUSD chart.
All Symbols version! Contact me for any questions introduction A flag can be used as an entry pattern for the continuation of an established trend. The formation usually occurs after a strong trending move. The pattern usually forms at the midpoint of a full swing and shows the start of moving. Bullish flags can form after an uptrend, bearish flags can form after a downtrend. Flag Pattern Scanner Indicator It is usually difficult for a trader to recognize classic p
FREE
Darvas Flow is a revolutionary trading indicator that combines the classic Darvas Box method with modern market flow analysis. Developed for serious traders, Darvas Flow offers a powerful and intuitive tool for identifying trading opportunities. Key Features: Darvas Box Method Implementation : Darvas Flow automatically identifies Darvas boxes, allowing you to see crucial support and resistance levels. This helps in pinpointing optimal entry and exit points in your trades. Dynamic Flow Analysis :
FREE

Insight Pro is a comprehensive tool for market analysis. It offers various features such as trend analysis, resistance and support levels, and distribution analysis, suitable for both novice and experienced traders. Features Trend Analysis Detects and visualizes market trends. Suggests potential entry and exit points based on trends. Customizable trend lines for clear market direction. Displays extreme levels based on standard deviation. Positive slope indicates buy orders; negative slope indic

Similar to logic used in: Golden MA MTF TT Overview
"Golden MA" indicator for OB/OS levels. It's based on High/Lows of higher timeframe (HTF) previous bar. Only useful in swing trading or scalping. Best for at least M15+. For lower timeframes you'll need to change StartPips to lower value to get consistent lines. Because lower timeframes will have smaller pip distances. Features - Define Higher Timeframes for Current Timeframe: Use a comma-separated list to define the higher timeframe for t
FREE

The principle of this indicator is very simple: detecting the candlestick pattern in D1 timeframe, then monitoring the return point of graph by using the pullback of High-Low of D1 Candlestick and finally predicting BUY and SELL signal with arrows, alerts and notifications. The parameters are fixed and automatically calculated on each time frame. Example:
If you install indicator on XAUUSD, timeframe D1: the indicator will detect the reversal, pullback, price action on this timeframe (for exa
FREE

The author's indicator is based on automatically adjusted horizontal and inclined lines from significant market points. In the settings you can specify the period, color and thickness of the lines, disable or enable slanted lines and several other graphic settings.
Recommended rules for entering the market:
Using SELL as an example:
I place a pending order for a breakout - sell stop below the horizontal line of the indicator, then I monitor the work-out, stop loss and take profit are dete
The x2 Smoothed RSI is an advanced modification of the classic Relative Strength Index (RSI) indicator. It aims to provide more reliable signals for identifying overbought and oversold market conditions. Here are the key features: Calculation : The x2 Smoothed RSI is derived from the standard RSI. It applies smoothing to the RSI oscillator, enhancing its accuracy. Smoothing Methods : The indicator uses a moving average of the RSI values. Traders can choose from various smoothing strengths C
FREE
The Reversal Candlestick Structure indicator detects multiple candlestick patterns occurring when trends are most likely to experience a reversal in real-time. The reversal detection method includes various settings allowing users to adjust the reversal detection algorithm more precisely.
A dashboard showing the percentage of patterns detected as reversals is also included. USAGE Figure 1 Candlestick patterns are ubiquitous to technical analysts, allowing them to detect trend continuati

To get access to MT5 version please click here . This is the exact conversion from TradingView: " WaveTrend" by LazyBear.
This is a light-load processing and non-repaint indicator. All input options are available. Buffers are available for processing in EAs. You can message in private chat for further changes you need. The filling area option is omitted to fit into MT4 graphics.

Pipwise Indicators Multiple MAs The Pipwise Indicators Moving Averages indicator is a powerful tool for technical analysis in MetaTrader 4 (MT4). It allows traders to visualize and analyze moving averages from multiple periods on a single chart. Here are the key features:
Customizable Moving Averages: Traders can choose the number of moving averages to plot (up to 9 MAs). Each Moving Average is customiseable.
Method Selection: The indicator supports various moving average methods, includin

Installation MetaTrader 4 Download: Download the provided file PrecisionStopDemo.ex4. Copy the File: Open MetaTrader 4. From the top menu, click on File > Open Data Folder. Navigate to MQL4 > Indicators. Copy the file PrecisionStopDemo.ex4 into this folder. Restart MetaTrader: Close and reopen MetaTrader 4. Add Indicator to Chart: In the Navigator (Ctrl+N), expand the Indicators folder. Find the indicator PrecisionStopDemo and drag it onto the desired chart.
Configuration After adding the i

Key Features: Pattern Recognition : Identifies Fair Value Gaps (FVGs) Spots Break of Structure (BOS) points Detects Change of Character (CHoCH) patterns Versatile Application : Optimized for candlestick charts Compatible with any chart type and financial instrument Real-Time and Historical Analysis : Works seamlessly with both real-time and historical data Allows for backtesting strategies and live market analysis Visual Representation : Draws rectangles to highlight significant areas on the cha

The AT Forex Indicator MT4 is a sophisticated trading tool designed to provide traders with a comprehensive analysis of multiple currency pairs. This powerful indicator simplifies the complex nature of the forex market, making it accessible for both novice and experienced traders. AT Forex Indicator uses advanced algorithms to detect trends, patterns and is an essential tool for traders aiming to enhance their forex trading performance. With its robust features, ease of use, and reliabl
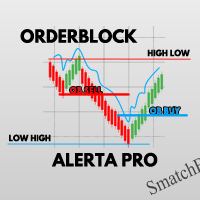
オーダーブロックプロアラート
OrderBlock ALERTA PRO は、金融市場への最適なエントリー ポイントを特定するための決定的なツールです。これを使用すると、強気または弱気の構造を打破するときに流動性が増加し始める時期を検出し、注文の理想的なバランスポイントを見つけることができます。メタトレーダーで直接プッシュ通知を受信し、常に最新情報を入手できます。
さらに、OrderBlock ALERTA PRO は、HIGH LOW (HL) および LOW HIGH (LH) ゾーンを識別し、市場がいつトレンド反転するかを知るための正確な価格を提供します。自信を持って市場に出入りするために必要な精度を手に入れましょう。
OrderBlock ALERTA PRO は、ゾーンが赤または青で塗りつぶされる飲み込みマーキングも実行し、下降トレンドまたは上昇トレンドが継続するための大きな流動性の機会を示します。
このインジケーターは、すべての外国為替金融市場ペアへのエントリーポイントを特定し、トレーディング戦略を新たなレベルに引き上げるのに不可欠です。
ご質問がござ
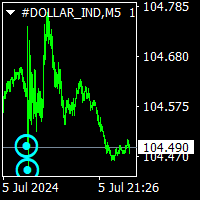
norepaint buy sell indicator is norepaint indicator.and works all pairs and all timeframes. Indicator hold too long way to signals. And show major and minor cycles.and gives signals Minor cycles are indicating with x signs. Major cycles are indicating big arrows. So 5m chart and 15m chart more suitable For major cycles, 1 h and 4h chart suitable for minor cycles. using is wery simple ,it puts arrow on price probably buy sell arrows. thise indicator is suitable for beginner and experienced trader

「MultiSymbol & TF Chart Integrated」インジケーターは、迅速に包括的な市場ビューを提供するために設計されており、好みの時間枠で最大60の通貨ペアを単一のチャートで監視すること(複数モード)や、すべての時間枠で取引しているペアを表示すること(シンプルモード)を可能にします。 主な利点: 完全監視: 単一のチャートで希望するすべてのペアを一目でリアルタイムで監視できます。
時間節約: チャート間の切り替えを避け、各ペアの動きをリアルタイムで確認できます。
トレンド分析: トレンドフォローのトレーダーに最適で、意思決定前にトレンドを確認するために上位の時間枠を見ることができます。
極端なカスタマイズ: インジケーターのすべての側面を特定のニーズに合わせて調整します。 極端なカスタマイズ: 高度に設定可能なインジケーターパラメーター:
シンボルと時間枠: 最大60の異なるシンボルを設定できます。 各シンボルには独自の時間枠を持つことができます(例:M1、M5、M15、M30、H1、H4、D1、W1、MN1)。 表示モード: シンプルモード: 特定の時間
異なる通貨ペアやタイムフレームを監視するために複数のチャートを切り替えるのに疲れましたか? Pairs and TF Changer インディケーターがあなたのトレード体験を革新します! すべての戦略インディケーターを読み込んだら、 Pairs and TF Changer をチャートに追加します。必要に応じて、その位置、色、または表示する列数を調整できます! 主な特徴: シームレスな統合: このインディケーターを簡単にトレーディング戦略に統合できます。 ワンクリックで、すべての通貨ペアとタイムフレームを単一のチャートで取引できます。 追加のチャートを切り替えたり開いたりする必要がなくなります。 高度にカスタマイズ可能: チャート上の任意の位置にその位置を調整します(上、下、左、右)。 ボタンの1行または10行を表示するように設定できます。 トレーディングテーマに合わせて色をカスタマイズできます。 チャートを清潔で整然と保つためにボタンを透明にします。 ユニバーサルな互換性: すべての種類のインディケーターと戦略に対応しています。 外為、金属、米国株、指数、石油、先物、暗号通貨など、す

Indicatorul excepțional ISKANDER
Bun venit!
Studiați și experimentați excepționalul indicator IKANDER! Merita.
Funcționează pe toate intervalele de timp și pe toate perechile. Observați rezultatele foarte bune prezentate în aceste imagini și în videoclip.
Succes!
Notă Este posibil ca acești indicatori și experți pe care i-am scos la vânzare să nu funcționeze pe anumite platforme. De câțiva ani, unele platforme cu noi versiuni MT4 nu afișează toți indicatorii personalizați.
O soluție
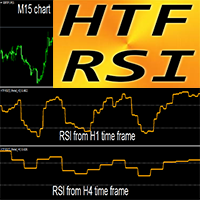
MT4 用 Forex インジケーター HTF RSI オシレーター
RSI 自体は、最も優れた、最も人気のあるオシレーターの 1 つです。HTF は、Higher Time Frame を意味します。
買われすぎゾーンは RSI が 70 を超える場合、売られすぎゾーンは RSI が 30 を下回る場合です。 RSI は、強気と弱気の価格モメンタムに関する情報を提供します。 このインジケーターは、プライス アクション エントリを使用するマルチタイム フレーム トレーディング システム、または他のインジケーターとの組み合わせに最適です。
HTF RSI インジケーターを使用すると、Higher Time Frame の RSI を現在のチャートに添付できます。 インジケーターには、モバイルおよび PC アラートが組み込まれています。
// より優れたエキスパート アドバイザーとインジケーターは、こちらで入手できます: https://www.mql5.com/en/users/def1380/seller // また、収益性が高く、安定していて信頼性の高いシグナルに参
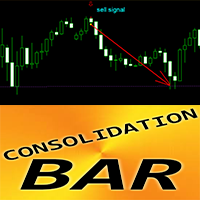
MT4 用 Forex インジケーター コンソリデーション バー パターン
インジケーター「コンソリデーション バー」は、価格アクション取引用の非常に強力なブレイクアウト重視のインジケーターです インジケーターは、1 つのバーの間に狭い領域で価格のコンソリデーションを検出し、ブレイクアウトの方向、保留中の注文、および SL の位置を表示します 強気のコンソリデーション バー - チャート上の青い矢印のシグナル (画像を参照) 弱気のコンソリデーション バー - チャート上の赤い矢印のシグナル (画像を参照) 再描画なし、遅延なし、高い R/R 比率 (報酬/リスク) PC、モバイル、メールアラートが含まれています インジケーター「コンソリデーションバーパターン」は、サポート/レジスタンスレベルと組み合わせるのに適しています: https://www.mql5.com/en/market/product/100903
// より優れたエキスパートアドバイザーとインジケーターは、こちらで入手できます: https://www.mql5.com/en/users/def1380/s
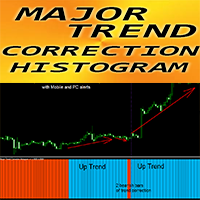
MT4 用 Forex インジケーター「主要トレンド修正ヒストグラム」
主要トレンド修正ヒストグラム インジケーターは、大きなトレンドを検出するために設計されました インジケーターは 2 色で表示されます: 弱気トレンドの場合は赤、強気トレンドの場合は青 (色は変更できます) 同じ色のヒストグラム列が 10 列以上連続している場合は、新しいトレンドの始まりを意味します インジケーターにはモバイルおよび PC アラートが組み込まれています インジケーターの感度を左右するパラメーター「期間」
インジケーターの使用方法: 1) 同じ色のヒストグラム列が 10 列以上連続しているかどうかを確認します。これは新しいトレンドの始まりを意味します (青 - 強気、赤 - 弱気) 2) 次に、反対色の列が 1 つまたは 2 つ発生し、メイン トレンドの色に戻った場合、これがトレンド修正です。 3) 修正後に検討すると良いでしょう。大きな上昇トレンドの場合は買いトレードを開き、大きな下降トレンドの場合は売りトレードを開きます。
// さらに優れたエキスパートアドバイザーとインジケーターは、
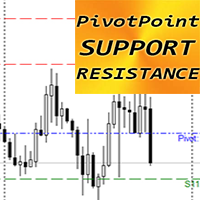
MT4 用 Forex インジケーター「ピボット ポイント サポート レジスタンス」
インジケーター「ピボット ポイント サポート レジスタンス」は、プライス アクション トレーディングの非常に強力な補助インジケーターです ピボット レベルは、前のトレーディング期間の市場パフォーマンスから重要な価格の平均として計算されます ピボット レベル自体は、全体的な市場状況に応じて、最高のレジスタンスまたはサポートのレベルを表します インジケーター「ピボット ポイント サポート レジスタンス」は、価格によって到達できる最も可能性の高い反転レベルを示します。 R1、R2、R3 - レジスタンス レベル (赤) S1、S2、S3 - サポート レベル (緑) 計算用の設定では、日次、週次、月次の前のトレーディング期間を使用できます インジケーター「ピボット ポイント レジスタンス サポート」は、プライス アクション パターンを介してテイク プロフィット ターゲットまたは価格反転を計画するのに最適です。 インジケーターの使用方法: 1) 対応するチャートにインジケーターを添付します 2) 必要な
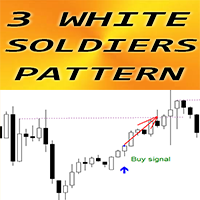
MT4 用 Forex インジケーター「3 White Soldiers パターン」
インジケーター「3 White Soldiers パターン」は、プライスアクション取引に非常に効果的です。再描画や遅延はありません。 インジケーターはチャート上で強気の 3 つの白い兵士のパターンを検出します: チャート上の青い矢印の信号 (画像を参照) PC、モバイル、および電子メールアラートが含まれています また、その兄弟である弱気の「3 つの黒いカラスのパターン」インジケーターも利用できます (以下のリンクに従ってください) インジケーター「3 つの白い兵士のパターン」は、サポート/レジスタンス レベルと組み合わせるのに最適です: https://www.mql5.com/en/market/product/100903
// より優れたエキスパート アドバイザーとインジケーターは、こちらで入手できます: https://www.mql5.com/en/users/def1380/seller // また、収益性が高く、安定的で信頼性の高いシグナルに参加することもできます https:
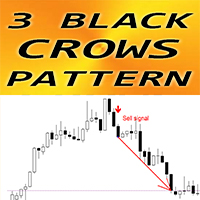
MT4 用 Forex インジケーター「3 Black Crows パターン」
インジケーター「3 Black Crows パターン」は、プライスアクション取引に非常に効果的です。再描画なし、遅延なし。 インジケーターはチャート上で弱気な 3 Black Crows パターンを検出します: チャート上の赤い矢印信号 (画像を参照) PC、モバイル、および電子メールアラートが含まれています また、その兄弟である強気の「3 White Soldiers パターン」インジケーターも利用できます (以下のリンクに従ってください) インジケーター「3 Black Crows パターン」は、サポート/レジスタンス レベルと組み合わせるのに最適です: https://www.mql5.com/en/market/product/100903
// より優れたエキスパート アドバイザーとインジケーターは、こちらで入手できます: https://www.mql5.com/en/users/def1380/seller // また、収益性が高く、安定的で信頼性の高いシグナルに参加することもできま

Determining the current trend is one of the most important tasks of a trader, regardless of the trading style. The Gravity Trend indicator will help you do this with a fairly high probability.
Gravity Trend is a trend recognition indicator that uses the author's calculation algorithm. The indicator readings do not change under any conditions. The indicator is suitable for any currency pair, any timeframe.
Indicator Parameters Main Settings: HistoryBars - the number of bars to display. First

Indicator fantastic
Bună ziua!
Indicatorul fantastic funcționează cel mai bine pe M5, M15, M1. Rezultatele sunt fantastice.
Pe perioade mai lungi de timp, semnalele sunt corecte, dar sunt rare.
Marcatorul nu revopsește.
Recomand un TPmin. = 5, 10 sâmburi pentru M5.
Acest indicator are potențialul de a declanșa tranzacții mult mai lungi.
Experimentează-l!
Noroc!
Note Dacă indicatorul nu este afișat, citiți comentariul meu în secțiunea de comentarii pentru a afla cum să faceți a

Gann Angles Indicator The Gann Angles Indicator is a powerful technical tool based on the theory of William Delbert Gann. It helps traders identify potential support and resistance levels, as well as trend direction across various time intervals. Key features: Automatic determination of extremum within a specified time range Construction of 9 Gann Fan lines with angles of 82.5, 75, 71.25, 63.75, 45, 26.25, 18.75, 15, and 7.5 Flexible line color customization Adaptation to both upward an
Meta indicator
Bun venit!
Studiu și experiență Metaindicator. Există trei indicatori integrați într-unul singur.
Funcționează pe toate intervalele de timp și pe toate perechile. I prefer the M15.
Am deja o tranzacție câștigată cu el.
Succes!
Notă Este posibil ca acești indicatori și experți pe care îi avem de vânzare să nu funcționeze pe anumite platforme. De câțiva ani, unele platforme cu noi versiuni MT4 nu afișează toți indicatorii personalizați.
O soluție la această problemă
Indicator de înaltă precizie
Bun venit!
Indicatorul de înaltă precizie a fost creat pentru intervalul de timp M5. Rezultatele sunt foarte bune. Vă recomandăm un TP = 10 sâmburi. Dar poate fi mai mare. Acest indicator are potențialul de a declanșa tranzacții mult mai lungi.
Experimentează-l!
Noroc!
IMPORTANT! Verificați mai întâi indicatorul sau expertul pe un cont DEMO, înainte de a-l cumpăra! Analizați-l bine!
Închiriați-l pentru o perioadă mai scurtă de timp. Pentru a vedea cum

Indicatorul Argo
Indicatorul Argo este special creat pentru intervalul de timp M5. Rezultatele sunt foarte bune.
Indicatorul funcționează și pe intervale de timp mai lungi, dar semnalele sunt rare.
Marcatorul nu revopsește.
Vă recomandăm un TP minim de 5, 10 sâmburi pentru M5.
Acest indicator arată similar cu indicatorul Fantastic, dar este construit pe un model diferit.
Succes!
Note Dacă indicatorul nu este afișat, citiți comentariul meu în secțiunea de comentarii pentru a afla cu
The presented indicator is a development of the ideas contained in the Bulls or Bears AM indicator. This indicator displays the difference between the maximum and minimum prices for the current period of time and the values of the channel built using the maximum and minimum prices for a longer period. An increase in indicator values above zero indicates that the maximum price for the current period is greater than the average value of the maximum prices for the period selected as an indicato
FREE

This indicator uses digital filters to analyze data. The indicator colors the chart candles in accordance with the current trend.
Digital filters are (simplistically) a way of smoothing data. Unlike traditional moving averages, a digital filter will be more effective in most cases. This indicator allows you to identify the difference between the current price and its expected value calculated by an adaptive digital filter. Moments of divergence are moments of price movement that can be used to
FREE

The principle of this indicator is very simple: detecting the candlestick pattern in M5 timeframe, then monitoring the return point of graph by using the pullback of High-Low of M5 Candlestick and finally predicting BUY and SELL signal with arrows, alerts and notifications. The parameters are fixed and automatically calculated on each time frame. Example:
If you install indicator on XAUUSD, timeframe M5: the indicator will detect the reversal, pullback, price action on this timeframe (for exa
FREE

Misio - can be used as an independent trading system. The indicator determines the market trend, ignoring sharp fluctuations and noise around the average price. It displays the trending movement with potential stop points.
Simple, clear and effective use. The indicator does not redraw and does not lag. Suitable for all currency pairs and all timeframes.
Interpretation:
The location of the rate above or below the shadows indicates the presence of a trend. A move into the shadows signals a

Get rid of trading confusion and embrace stable income! Are you still worried about finding a low-risk and stable profit method? Are you still anxious about judging the market direction and controlling the risk of placing orders? The new cross-platform arbitrage indicator helps you easily achieve stable returns! Accurately capture arbitrage opportunities without you having to worry! The cross-platform arbitrage indicator is a powerful tool that can monitor the price differences of the same finan
MetaTraderプラットフォームのためのアプリのストアであるMetaTraderアプリストアで自動売買ロボットを購入する方法をご覧ください。
MQL5.community支払いシステムでは、PayPalや銀行カードおよび人気の支払いシステムを通してトランザクションをすることができます。ご満足いただけるように購入前に自動売買ロボットをテストすることを強くお勧めします。
取引の機会を逃しています。
- 無料取引アプリ
- 8千を超えるシグナルをコピー
- 金融ニュースで金融マーケットを探索
新規登録
ログイン