
Using indicators for optimizing Expert Advisors in real time
Contents
- Introduction
- 1. Idea
- 2. Trading strategy
- 3. Preparing the tester indicator
- 3.1. Class of virtual deals
- 3.2. Programming the indicator
- 4. Creating the EA
- 5. Testing the approach
- Conclusion
Introduction
Every time we launch an Expert Advisor on a chart, we face an issue of selecting optimal parameters providing maximum profitability. To find such parameters, we optimize trading strategy on historical data. However, as you know, the market is in constant motion. Over time, the selected parameters lose their relevance.
Thus, an EA re-optimization is required. This cycle is constant. Every user chooses the moment of re-optimization on their own. But is it possible to automate that process? What are possible solutions? Perhaps, you have already considered a possibility of program control of the standard strategy tester via running the terminal with a custom configuration file. I would like to offer an unconventional approach and assign the tester functions to an indicator.
1. Idea
Of course, an indicator is by no means the strategy tester. So how can it help us in optimizing an EA? My idea is to implement the EA operation logic into an indicator and track the profitability of virtual deals in real time. When performing optimization in the strategy tester, we conduct a series of tests iterating over specified parameters. We will do the same by simultaneously launching several instances of a single indicator with different parameters similar to passes in the strategy tester. When making a decision, the EA surveys launched indicators and selects the best parameters for execution.
You may ask, why reinvent the wheel. Let's analyze pros and cons of this decision. Undoubtedly, the main advantage of this approach is the optimization of an EA in almost real time conditions. The second advantage is that a test is performed on real ticks of your broker. On the other hand, testing in real time has a huge drawback since you have to wait till statistical data is collected. Another advantage is that when moving in time, the tester indicator will not recalculate the entire history but only the current tick, while the strategy tester runs along the history from the very beginning. This approach provides faster optimization at the right moment. Therefore, we can carry out optimization on almost every bar.
The disadvantages of this approach include the absence of tick history for testing on history. Of course, we can use CopyTicks or CopyTicksRange. But downloading the tick history requires time, and recalculation of the great data volume also requires computing power and time. Let's not forget that we use indicators, and all indicators for a single symbol work in one thread in MetaTrader 5. Thus, here is another limitation — too many indicators may cause the terminal to slow down.
To minimize risks of the described drawbacks, let's make the following assumptions:
- When initializing the tester indicator, history is calculated by М1 OHLC prices. When calculating order profits/losses, a stop loss is checked first followed by a take profit by High/Low (depending on the order type).
- According to point 1, orders are opened only at the candle opening.
- To decrease the total number of running test indicators, apply a meaningful approach to selecting the parameters used in them. Here you can add a minimum step and filtering parameters in accordance with the indicator logic. For example, while using MACD, if the parameter range of fast and slow MAs overlap, the tester indicator is not launched for a set of parameters, in which a slow MA period is less or equal to a fast MA one, since this contradicts the EA operation logic. You can also add a minimum discrepancy between periods, initially discarding options with a large number of false signals.
2. Trading strategy
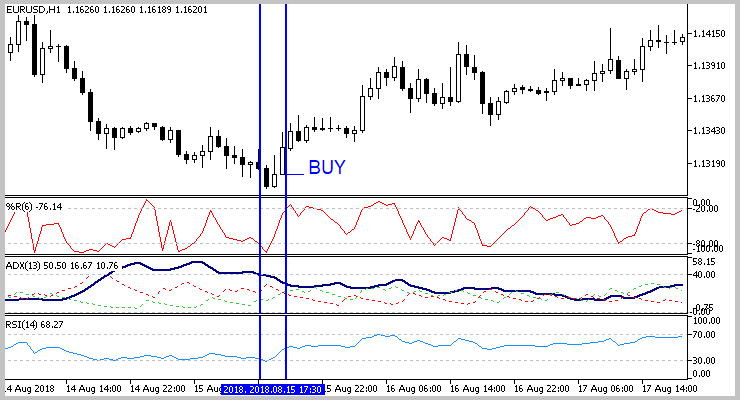
To test the method, let's use a simple strategy based on three standard indicators WPR, RSI and ADX. A buy signal is activated when WPR crosses the oversold level upwards (level -80). RSI should not be in the overbought area (above the level 70). Since both indicators are oscillators, their use is justified in flat movements. The presence of a flat is checked by ADX indicator that should not exceed the level 40.
The signal is mirrored for a sell. WPR indicator crosses the overbought level -20 downwards, RSI should exceed the oversold area of 30. ADX controls the presence of flat, just like when buying.
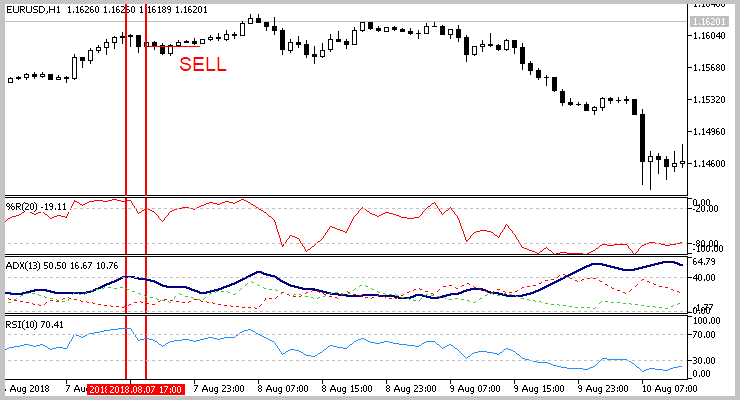
As mentioned earlier, a market entry is performed on a new candle following the signal. An exit is performed by a fixed stop loss or take profit.
No more than one position remains in the market at a time for loss management.
3. Preparing the tester indicator
3.1. Class of virtual deals
After defining a trading strategy, it is time to develop a test indicator. First, we need to prepare virtual orders to be tracked in the indicator. The article [1] has already described a virtual order class. We can take advantage of this work with a small addition. The previously described class has the Tick method that checks the moment an order is closed using the current Ask and Bid prices. This approach is applicable when working in real time only and is not applicable for checking on historical data. Let's slightly alter the mentioned function by adding a price and a spread to its parameters. After performing operations, the method returns the order status. As a result of this addition, the method will take the following form.
bool CDeal::Tick(double price, int spread)
  {
   if(d_ClosePrice>0)
      return true;
//---
   switch(e_Direct)
     {
      case POSITION_TYPE_BUY:
        if(d_SL_Price>0 && d_SL_Price>=price)
          {
           d_ClosePrice=price;
           i_Profit=(int)((d_ClosePrice-d_OpenPrice)/d_Point);
          }
        else
          {
           if(d_TP_Price>0 && d_TP_Price<=price)
             {
              d_ClosePrice=price;
              i_Profit=(int)((d_ClosePrice-d_OpenPrice)/d_Point);
             }
          }
        break;
      case POSITION_TYPE_SELL:
        price+=spread*d_Point;
        if(d_SL_Price>0 && d_SL_Price<=price)
          {
           d_ClosePrice=price;
           i_Profit=(int)((d_OpenPrice-d_ClosePrice)/d_Point);
          }
        else
          {
           if(d_TP_Price>0 && d_TP_Price>=price)
             {
              d_ClosePrice=price;
              i_Profit=(int)((d_OpenPrice-d_ClosePrice)/d_Point);
             }
          }
        break;
     }
   return IsClosed();
  }
Find the entire class code in the attachment.
3.2. Programming the indicator
Next, let's code the indicator itself. Since our tester indicator plays the role of an EA in some way, its inputs will resemble the EA parameters. First, set the test period, as well as stop loss and take profit levels in the indicator parameters. Next, specify parameters of applied indicators. Finally, indicate a trading direction and averaging period of statistical data. More details about the use of each parameter are to be provided while it is used in the indicator code.
input int                  HistoryDepth      =  500;           //Depth of history(bars)
input int                  StopLoss          =  200;           //Stop Loss(points)
input int                  TakeProfit        =  600;           //Take Profit(points)
//--- RSI indicator parameters
input int                  RSIPeriod         =  28;            //RSI Period
input double               RSITradeZone      =  30;            //Overbaying/Overselling zone size
//--- WPR indicator parameters
input int                  WPRPeriod         =  7;             //Period WPR
input double               WPRTradeZone      =  30;            //Overbaying/Overselling zone size
//--- ADX indicator parameters
input int                  ADXPeriod         =  11;            //ADX Period
input int                  ADXLevel          =  40;            //Flat Level ADX
//---
input int                  Direction         =  -1;            //Trade direction "-1"-All, "0"-Buy, "1"-Sell
//---
input int                  AveragePeriod     =  10;            //Averaging Period
For calculations and data exchange with an EA, create nine indicator buffers containing the following data:
1. Probability of a profitable deal.
double Buffer_Probability[];
2. Profit factor for a tested period.
double Buffer_ProfitFactor[];
3. Stop loss and take profit levels. These two buffers can be excluded by creating the array of matching the indicator handle and specified levels in the EA or requesting the indicator parameters by its handle when performing a deal. However, the current solution seems to be the easiest one to me.
double      Buffer_TakeProfit[];
double      Buffer_StopLoss[];
4. The buffers for calculating the total number of performed deals within a tested period and their profitable number.
double      Buffer_ProfitCount[];
double      Buffer_DealsCount[];
5. The following two buffers are auxiliary for calculating previous values and contain similar data for the current bar only.
double      Buffer_ProfitCountCurrent[];
double      Buffer_DealsCountCurrent[];
6. And last but not least, the buffer that sends a signal to the EA to perform a deal.
double Buffer_TradeSignal[];
In addition to the specified buffers, declare an array for storing open deals, a variable for recording the time of the last deal, variables for storing the indicator handles, as well as arrays for obtaining information from indicators in the global variables block.
CArrayObj   Deals;
datetime    last_deal;
int         wpr_handle,rsi_handle,adx_handle;
double      rsi[],adx[],wpr[];
Initialize indicators at the beginning of the OnInit function.
int OnInit()
  {
//--- Get RSI indicator handle
   rsi_handle=iRSI(Symbol(),PERIOD_CURRENT,RSIPeriod,PRICE_CLOSE);
   if(rsi_handle==INVALID_HANDLE)
     {
      Print("Test Indicator",": Failed to get RSI handle");
      Print("Handle = ",rsi_handle,"  error = ",GetLastError());
      return(INIT_FAILED);
     }
//--- Get WPR indicator handle
   wpr_handle=iWPR(Symbol(),PERIOD_CURRENT,WPRPeriod);

   if(wpr_handle==INVALID_HANDLE)
     {
      Print("Test Indicator",": Failed to get WPR handle");
      Print("Handle = ",wpr_handle,"  error = ",GetLastError());
      return(INIT_FAILED);
     }
//--- Get ADX indicator handle
   adx_handle=iADX(Symbol(),PERIOD_CURRENT,ADXPeriod);
   if(adx_handle==INVALID_HANDLE)
     {
      Print("Test Indicator",": Failed to get ADX handle");
      Print("Handle = ",adx_handle,"  error = ",GetLastError());
      return(INIT_FAILED);
     }
Next, associate the indicator buffers with dynamic arrays.
//--- indicator buffers mapping
   SetIndexBuffer(0,Buffer_Probability,INDICATOR_CALCULATIONS);
   SetIndexBuffer(1,Buffer_DealsCount,INDICATOR_CALCULATIONS);
   SetIndexBuffer(2,Buffer_TradeSignal,INDICATOR_CALCULATIONS);
   SetIndexBuffer(3,Buffer_ProfitFactor,INDICATOR_CALCULATIONS);
   SetIndexBuffer(4,Buffer_ProfitCount,INDICATOR_CALCULATIONS);
   SetIndexBuffer(5,Buffer_TakeProfit,INDICATOR_CALCULATIONS);
   SetIndexBuffer(6,Buffer_StopLoss,INDICATOR_CALCULATIONS);
   SetIndexBuffer(7,Buffer_DealsCountCurrent,INDICATOR_CALCULATIONS);
   SetIndexBuffer(8,Buffer_ProfitCountCurrent,INDICATOR_CALCULATIONS);
Assign time series properties to all arrays.
   ArraySetAsSeries(Buffer_Probability,true);
   ArraySetAsSeries(Buffer_ProfitFactor,true);
   ArraySetAsSeries(Buffer_TradeSignal,true);
   ArraySetAsSeries(Buffer_DealsCount,true);
   ArraySetAsSeries(Buffer_ProfitCount,true);
   ArraySetAsSeries(Buffer_TakeProfit,true);
   ArraySetAsSeries(Buffer_StopLoss,true);
   ArraySetAsSeries(Buffer_DealsCountCurrent,true);
   ArraySetAsSeries(Buffer_ProfitCountCurrent,true);
//---
   ArraySetAsSeries(rsi,true);
   ArraySetAsSeries(wpr,true);
   ArraySetAsSeries(adx,true);
At the end of the function, reset the array of deals and the date of the last deal, as well as assign the name to our indicator.
   Deals.Clear();
   last_deal=0;
//---
   IndicatorSetString(INDICATOR_SHORTNAME,"Test Indicator");
//---
   return(INIT_SUCCEEDED);
  }
The indicators' current data is downloaded in the GetIndValue function. At the input, the specified function will receive the required depth of the loaded data history, and at the output, the function will return the number of loaded elements. The indicators' data are stored in the globally declared arrays.
int GetIndValue(int depth)
  {
   if(CopyBuffer(wpr_handle,MAIN_LINE,0,depth,wpr)<=0 || CopyBuffer(adx_handle,MAIN_LINE,0,depth,adx)<=0 || CopyBuffer(rsi_handle,MAIN_LINE,0,depth,rsi)<=0)
      return -1;
   depth=MathMin(ArraySize(rsi),MathMin(ArraySize(wpr),ArraySize(adx)));
//---
   return depth;
  }
To check market entry signals, create the BuySignal and SellSignal functions. Find the code of the functions in the attachment.
Like in any indicator, the main functionality is concentrated in the OnCalculate function. The function operations can be logically divided into two flows:
- When recalculating more than one bar (the first launch after initialization or opening a new bar). In this flow, we will check market entry signals for opening deals on each not calculated bar and processing stop orders of open deals based on the historical data of the M1 timeframe.
- While a new bar is not yet formed, check for activation of stop orders of open positions on each new tick.
At the beginning of the function, check the number of new bars since the last launch of the function. If this is the first function launch after initializing the indicator, set the indicator recalculation width to no more than the required testing depth and bring the indicator buffers to the initial state.
int OnCalculate(const int rates_total,
                const int prev_calculated,
                const datetime &time[],
                const double &open[],
                const double &high[],
                const double &low[],
                const double &close[],
                const long &tick_volume[],
                const long &volume[],
                const int &spread[])
  {
//---
   int total=rates_total-prev_calculated;
   if(prev_calculated<=0)
     {
      total=fmin(total,HistoryDepth);
//---
      ArrayInitialize(Buffer_Probability,0);
      ArrayInitialize(Buffer_ProfitFactor,0);
      ArrayInitialize(Buffer_TradeSignal,0);
      ArrayInitialize(Buffer_DealsCount,0);
      ArrayInitialize(Buffer_ProfitCount,0);
      ArrayInitialize(Buffer_TakeProfit,TakeProfit*_Point);
      ArrayInitialize(Buffer_StopLoss,StopLoss*_Point);
      ArrayInitialize(Buffer_DealsCountCurrent,0);
      ArrayInitialize(Buffer_ProfitCountCurrent,0);
     }
Next come the operations of the first logic flow when a new candle opens. First, download the current data of applied indicators. In case of a data download error, exit the function till the next tick waiting for the indicators to recalculate.
   if(total>0)
     {
      total=MathMin(GetIndValue(total+2),rates_total);
      if(total<=0)
         return prev_calculated;
Then assign the time series property to incoming price arrays.
      if(!ArraySetAsSeries(open,true) || !ArraySetAsSeries(high,true) || !ArraySetAsSeries(low,true) || !ArraySetAsSeries(close,true)
         || !ArraySetAsSeries(time,true) || !ArraySetAsSeries(spread,true))
         return prev_calculated;
The main loop for recalculating each bar comes next. At the beginning of the loop, initialize the indicator buffers for recalculated bar.
      for(int i=total-3;i>=0;i--)
        {
         Buffer_TakeProfit[i]=TakeProfit*_Point;
         Buffer_StopLoss[i]=StopLoss*_Point;
         Buffer_DealsCount[i]=Buffer_DealsCountCurrent[i]=0;
         Buffer_ProfitCount[i]=Buffer_ProfitCountCurrent[i]=0;
After that, let's check whether we opened yet another deal on a calculated bar. If not, check the indicators' entry signals by calling previously created functions. If there is a market entry signal, create a virtual trade and write the corresponding signal to the signal buffer.
         if(last_deal<time[i])
           {
            if(BuySignal(i))
              {
               double open_price=open[i]+spread[i]*_Point;
               double sl=open_price-StopLoss*_Point;
               double tp=open_price+TakeProfit*_Point;
               CDeal *temp=new CDeal(_Symbol,rates_total-i,POSITION_TYPE_BUY,time[i],open_price,sl,tp);
               if(temp!=NULL)
                  Deals.Add(temp);
               Buffer_TradeSignal[i]=1;
              }
            else /*BuySignal*/
            if(SellSignal(i))
              {
               double open_price=open[i];
               double sl=open_price+StopLoss*_Point;
               double tp=open_price-TakeProfit*_Point;
               CDeal *temp=new CDeal(_Symbol,rates_total-i,POSITION_TYPE_SELL,time[i],open_price,sl,tp);
               if(temp!=NULL)
                  Deals.Add(temp);
               Buffer_TradeSignal[i]=-1;
              }
            else /*SellSignal*/
               Buffer_TradeSignal[i]=0;
           }
Now, it is time to work with open positions. First, check the current timeframe. If the indicator works on М1, stop order activations are checked by time series data obtained in the OnCalculate function parameters. Otherwise, we need to upload minute timeframe data.
         if(Deals.Total()>0)
           {
            if(PeriodSeconds()!=60)
              {
               MqlRates rates[];
               int rat=CopyRates(_Symbol,PERIOD_M1,time[i],(i>0 ? time[i-1] : TimeCurrent()),rates);
After downloading quotes, arrange the loop for checking activation of open deals' stop orders on each minute bar. Sum up closed and profitable deals into appropriate indicator buffers for a recalculated bar. The array is processed in the CheckDeals function. The data of a checked minute candle are passed in the function parameters. The function operation algorithm is to be considered below.
               int closed=0, profit=0;
               for(int r=0;(r<rat && Deals.Total()>0);r++)
                 {
                  CheckDeals(rates[r].open,rates[r].high,rates[r].low,rates[r].close,rates[r].spread,rates[r].time,closed,profit);
                  if(closed>0)
                    {
                     Buffer_DealsCountCurrent[i]+=closed;
                     Buffer_ProfitCountCurrent[i]+=profit;
                    }
                 }
Similar alternative blocks come next. They check deals by the current timeframe data in case the download of minute quotes or indicator operation on M1 timeframe fails.
               if(rat<0)
                 {
                  CheckDeals(open[i],high[i],low[i],close[i],spread[i],time[i],closed,profit);
                  Buffer_DealsCountCurrent[i]+=closed;
                  Buffer_ProfitCountCurrent[i]+=profit;
                 }
              }
            else /* PeriodSeconds()!=60 */
              {
               int closed=0, profit=0;
               CheckDeals(open[i],high[i],low[i],close[i],spread[i],time[i],closed,profit);
               Buffer_DealsCountCurrent[i]+=closed;
               Buffer_ProfitCountCurrent[i]+=profit;
              }
           } /* Deals.Total()>0 */
Finally, let's analyze our strategy operation statistics. Calculate the number of deals opened within a tested period and how many of them closed with a profit.
         Buffer_DealsCount[i+1]=NormalizeDouble(Buffer_DealsCount[i+2]+Buffer_DealsCountCurrent[i+1]-((i+HistoryDepth+1)<rates_total ? Buffer_DealsCountCurrent[i+HistoryDepth+1] : 0),0);
         Buffer_ProfitCount[i+1]=NormalizeDouble(Buffer_ProfitCount[i+2]+Buffer_ProfitCountCurrent[i+1]-((i+HistoryDepth+1)<rates_total ? Buffer_ProfitCountCurrent[i+HistoryDepth+1] : 0),0);
         Buffer_DealsCount[i]=NormalizeDouble(Buffer_DealsCount[i+1]+Buffer_DealsCountCurrent[i]-((i+HistoryDepth)<rates_total ? Buffer_DealsCountCurrent[i+HistoryDepth] : 0),0);
         Buffer_ProfitCount[i]=NormalizeDouble(Buffer_ProfitCount[i+1]+Buffer_ProfitCountCurrent[i]-((i+HistoryDepth)<rates_total ? Buffer_ProfitCountCurrent[i+HistoryDepth] : 0),0);
If there are activated deals, calculate the probability of obtaining profit in a deal and the strategy profit factor within the tested period. To avoid sudden changes in profit obtaining probability, this parameter will be smoothed according to the exponential average equation using the averaging period set in the indicator parameters.
         if(Buffer_DealsCount[i]>0)
           {
            double pr=2.0/(AveragePeriod-1.0);
            Buffer_Probability[i]=((i+1)<rates_total && Buffer_Probability[i+1]>0 && Buffer_DealsCount[i+1]>=AveragePeriod ? Buffer_ProfitCount[i]/Buffer_DealsCount[i]*100*pr+Buffer_Probability[i+1]*(1-pr) : Buffer_ProfitCount[i]/Buffer_DealsCount[i]*100);
            if(Buffer_DealsCount[i]>Buffer_ProfitCount[i])
              {
               double temp=(Buffer_ProfitCount[i]*TakeProfit)/(StopLoss*(Buffer_DealsCount[i]-Buffer_ProfitCount[i]));
               Buffer_ProfitFactor[i]=((i+1)<rates_total && Buffer_ProfitFactor[i+1]>0 ? temp*pr+Buffer_ProfitFactor[i+1]*(1-pr) : temp);
              }
            else
               Buffer_ProfitFactor[i]=TakeProfit*Buffer_ProfitCount[i];
           }
        }
     }
The flow of processing each tick contains a similar logic, so there is no point in providing its full description here. Find the entire code of all the indicator functions in the attachment.
Previously, I already mentioned that checking the activation of stop orders of existing deals is carried out in the CheckDeals function. Let's consider its operation algorithm. In the parameters, the function obtains quotes of the analyzed bar and two links to the variables for returning the number of closed and profitable deals.
At the start of the function, we reset returned variables and declare the resulting logical variable.
bool CheckDeals(double open,double high,double low,double close,int spread,datetime time,int &closed, int &profit)
  {
   closed=0;
   profit=0;
   bool result=true;
Further on, the loop for iterating over all deals in the array is arranged in the function. Pointers to deal objects are obtained one by one in the loop. In case of an erroneous pointer to the object, delete this deal from the array and proceed to the next one. If there is an error in performing operations, set the resulting variable to 'false'.
   for(int i=0;i<Deals.Total();i++)
     {
      CDeal *deal=Deals.At(i);
      if(CheckPointer(deal)==POINTER_INVALID)
        {
         if(Deals.Delete(i))
            i--;
         else
            result=false;
         continue;
        }
Next, check if a deal was opened at the time of opening a candle. If not, move on to the next deal.
      if(deal.GetTime()>time)
         continue;
Finally, check the activation of deal stop orders for Open, High, Low and Close prices consecutively by calling the Tick method of a checked trade for each price. The algorithm of the method was described at the beginning of the current section. Keep in mind that the check sequence is different for buy and sell deals. First, the activation of stop loss is checked, followed by take profit. This approach may to some extent underestimate the trading results, but it reduces losses in future trading. When any of the stop orders is triggered, the number of closed deals increases, and in case of a profit, the number of profitable deals increases as well. After a deal is closed, it is removed from the array to avoid recalculation.
      if(deal.Tick(open,spread))
        {
         closed++;
         if(deal.GetProfit()>0)
            profit++;
         if(Deals.Delete(i))
            i--;
         if(CheckPointer(deal)!=POINTER_INVALID)
            delete deal;
         continue;
        }
      switch(deal.Type())
        {
         case POSITION_TYPE_BUY:
            if(deal.Tick(low,spread))
              {
               closed++;
               if(deal.GetProfit()>0)
                  profit++;
               if(Deals.Delete(i))
                  i--;
               if(CheckPointer(deal)!=POINTER_INVALID)
                  delete deal;
               continue;
              }
            if(deal.Tick(high,spread))
              {
               closed++;
               if(deal.GetProfit()>0)
                  profit++;
               if(Deals.Delete(i))
                  i--;
               if(CheckPointer(deal)!=POINTER_INVALID)
                  delete deal;
               continue;
              }
           break;
         case POSITION_TYPE_SELL:
            if(deal.Tick(high,spread))
              {
               closed++;
               if(deal.GetProfit()>0)
                  profit++;
               if(Deals.Delete(i))
                  i--;
               if(CheckPointer(deal)!=POINTER_INVALID)
                  delete deal;
               continue;
              }
            if(deal.Tick(low,spread))
              {
               closed++;
               if(deal.GetProfit()>0)
                  profit++;
               if(Deals.Delete(i))
                  i--;
               if(CheckPointer(deal)!=POINTER_INVALID)
                  delete deal;
               continue;
              }
           break;
        }
     }
//---
   return result;
  }
The complete code of the indicator and all its functions is provided in the attachment.
4. Creating the EA
After creating the tester indicator, now it is time to develop our EA. In the EA parameters, we set the number of static variables (common to all passes) and, similar to the strategy tester, define initial and end values of the changed parameters, as well as the value change step. Besides, in the EA parameters, we also specify criteria for selecting market entry signals — this is the minimum probability of making a profit and the minimum profit factor for the test period. In addition, in order to maintain objectivity of the obtained statistical data, let's indicate the minimum required number of deals for the tested period.
input double               Lot                     =  0.01;
input int                  HistoryDepth            =  500;           //Depth of history(bars)
//--- RSI indicator parameters
input int                  RSIPeriod_Start         =  5;             //RSI Period
input int                  RSIPeriod_Stop          =  30;            //RSI Period
input int                  RSIPeriod_Step          =  5;             //RSI Period
//---
input double               RSITradeZone_Start      =  30;            //Overbaying/Overselling zone size Start
input double               RSITradeZone_Stop       =  30;            //Overbaying/Overselling zone size Stop
input double               RSITradeZone_Step       =  5;             //Overbaying/Overselling zone size Step
//--- WPR indicator parameters
input int                  WPRPeriod_Start         =  5;             //Period WPR Start
input int                  WPRPeriod_Stop          =  30;            //Period WPR Stop
input int                  WPRPeriod_Step          =  5;             //Period WPR Step
//---
input double               WPRTradeZone_Start      =  20;            //Overbaying/Overselling zone size Start
input double               WPRTradeZone_Stop       =  20;            //Overbaying/Overselling zone size Stop
input double               WPRTradeZone_Step       =  5;             //Overbaying/Overselling zone size Step
//--- ADX indicator parameters
input int                  ADXPeriod_Start         =  5;             //ADX Period Start
input int                  ADXPeriod_Stop          =  30;            //ADX Period Stop
input int                  ADXPeriod_Step          =  5;             //ADX Period Step
//---
input int                  ADXTradeZone_Start      =  40;            //Flat Level ADX Start
input int                  ADXTradeZone_Stop       =  40;            //Flat Level ADX Stop
input int                  ADXTradeZone_Step       =  10;            //Flat Level ADX Step
//--- Deals Settings
input int                  TakeProfit_Start        =  600;           //TakeProfit Start
input int                  TakeProfit_Stop         =  600;           //TakeProfit Stop
input int                  TakeProfit_Step         =  100;           //TakeProfit Step
//---
input int                  StopLoss_Start          =  200;           //StopLoss Start
input int                  StopLoss_Stop           =  200;           //StopLoss Stop
input int                  StopLoss_Step           =  100;           //StopLoss Step
//---
input double               MinProbability          =  60.0;          //Minimal Probability
input double               MinProfitFactor         =  1.6;           //Minimal Profitfactor
input int                  MinOrders               =  10;            //Minimal number of deals in history
In the global variables, declare an instance of the trading operations class and the array for storing handles of tester indicators.
CArrayInt   ar_Handles;
CTrade      Trade;
In the EA's OnInit function, arrange a series of nested loops for iterating over all the options of tested parameters and add a separate test of buy and sell deals. This approach allows considering the impact of global trends not tracked by a tested strategy. The tester indicators are initialized inside the loops. If the indicator download fails, exit the function with the INIT_FAILED result. If the indicator is successfully loaded, add its handle to the array.
int OnInit()
  {
//---
   for(int rsi=RSIPeriod_Start;rsi<=RSIPeriod_Stop;rsi+=RSIPeriod_Step)
      for(double rsi_tz=RSITradeZone_Start;rsi_tz<=RSITradeZone_Stop;rsi_tz+=RSITradeZone_Step)
         for(int wpr=WPRPeriod_Start;wpr<=WPRPeriod_Stop;wpr+=WPRPeriod_Step)
            for(double wpr_tz=WPRTradeZone_Start;wpr_tz<=WPRTradeZone_Stop;wpr_tz+=WPRTradeZone_Step)
               for(int adx=ADXPeriod_Start;adx<=ADXPeriod_Stop;adx+=ADXPeriod_Step)
                  for(double adx_tz=ADXTradeZone_Start;adx_tz<=ADXTradeZone_Stop;adx_tz+=ADXTradeZone_Step)
                     for(int tp=TakeProfit_Start;tp<=TakeProfit_Stop;tp+=TakeProfit_Step)
                        for(int sl=StopLoss_Start;sl<=StopLoss_Stop;sl+=StopLoss_Step)
                          for(int dir=0;dir<2;dir++)
                             {
                              int handle=iCustom(_Symbol,PERIOD_CURRENT,"::Indicators\\TestIndicator\\TestIndicator.ex5",HistoryDepth,
                                                                                                                        sl,
                                                                                                                        tp,
                                                                                                                        rsi,
                                                                                                                        rsi_tz,
                                                                                                                        wpr,
                                                                                                                        wpr_tz,
                                                                                                                        adx,
                                                                                                                        adx_tz,
                                                                                                                        dir);
                              if(handle==INVALID_HANDLE)
                                 return INIT_FAILED;
                              ar_Handles.Add(handle);
                             }
After a successful launch of all tester indicators, initialize the class of trading operations and complete the function execution.
   Trade.SetAsyncMode(false);
   if(!Trade.SetTypeFillingBySymbol(_Symbol))
      return INIT_FAILED;
   Trade.SetMarginMode();
//---
   return(INIT_SUCCEEDED);
  }
Trading signals are sorted and trading operations are executed in the OnTick function. Since we previously decided to open positions only at the opening of a bar, we will check the occurrence of this event at the beginning of the function.
void OnTick()
  {
//---
   static datetime last_bar=0;
   datetime cur_bar=(datetime)SeriesInfoInteger(_Symbol,PERIOD_CURRENT,SERIES_LASTBAR_DATE);
   if(cur_bar==last_bar)
      return;
Our second limitation is no more than one open deal at a time. Therefore, stop the function execution if there is an open position.
   if(PositionSelect(_Symbol))
     {
      last_bar=cur_bar;
      return;
     }
After checking the control points, proceed to the main loop of iterating over all indicators in search of signals. At the beginning of the loop, we try to load the indicator's signal buffer. If the indicator has not yet been recalculated or there is no trading signal, proceed to the next indicator.
   int signal=0;
   double probability=0;
   double profit_factor=0;
   double tp=0,sl=0;
   bool ind_caclulated=false;
   double temp[];
   for(int i=0;i<ar_Handles.Total();i++)
     {
      if(CopyBuffer(ar_Handles.At(i),2,1,1,temp)<=0)
         continue;
      ind_caclulated=true;
      if(temp[0]==0)
         continue;
The next step is to check whether the received signal does not contradict the previously received signals from other indicators. The presence of conflicting signals increases the probability of an error, so we exit the function before the formation of the next candle begins.
      if(signal!=0 && temp[0]!=signal)
        {
         last_bar=cur_bar;
         return;
        }
      signal=(int)temp[0];
Then, check the presence of the minimum required number of deals within the tested period. If the sample is insufficient, go to the next indicator.
      if(CopyBuffer(ar_Handles.At(i),1,1,1,temp)<=0 || temp[0]<MinOrders)
         continue;
Further on, the sufficiency of a profitable deal probability is verified in a similar way.
      if(CopyBuffer(ar_Handles.At(i),0,1,1,temp)<=0 || temp[0]<MathMax(probability,MinProbability))
         continue;
If the discrepancies in the probability of a profitable deal according to the analyzed indicator and those checked earlier are less than 1 percent, the best one is selected out of the two passes based on the profit factor and the profit/risk ratio. The best pass data are saved for further work.
      if(MathAbs(temp[0]-probability)<=1)
        {
         double ind_probability=temp[0];
//---
         if(CopyBuffer(ar_Handles.At(i),3,1,1,temp)<=0 || temp[0]<MathMax(profit_factor,MinProfitFactor))
            continue;
         double ind_profit_factor=temp[0];
         if(CopyBuffer(ar_Handles.At(i),5,1,1,temp)<=0)
            continue;
         double ind_tp=temp[0];
         if(CopyBuffer(ar_Handles.At(i),6,1,1,temp)<=0)
            continue;
         double ind_sl=temp[0];
         if(MathAbs(ind_profit_factor-profit_factor)<=0.01)
           {
            if(sl<=0 || tp/sl>=ind_tp/ind_sl)
               continue;
           }
//---
         probability=ind_probability;
         profit_factor=ind_profit_factor;
         tp=ind_tp;
         sl=ind_sl;
        }
If the probability of obtaining a profitable deal is clearly greater, then the profit factor requirement for the pass is checked. If all requirements are met, the pass data is saved for further work.
      else /* MathAbs(temp[0]-probability)<=1 */
        {
         double ind_probability=temp[0];
//---
         if(CopyBuffer(ar_Handles.At(i),3,1,1,temp)<=0 || temp[0]<MinProfitFactor)
            continue;
         double ind_profit_factor=temp[0];
         if(CopyBuffer(ar_Handles.At(i),5,1,1,temp)<=0)
            continue;
         double ind_tp=temp[0];
         if(CopyBuffer(ar_Handles.At(i),6,1,1,temp)<=0)
            continue;
         double ind_sl=temp[0];
         probability=ind_probability;
         profit_factor=ind_profit_factor;
         tp=ind_tp;
         sl=ind_sl;
        }
     }
If not a single tester indicator is recalculated after checking all of them, exit the function till the next tick waiting for the indicators to recalculate.
   if(!ind_caclulated)
      return;
After the indicators are checked successfully and there is no active trading signal, exit the function before a new bar is formed.
   last_bar=cur_bar;
//---
   if(signal==0 || probability==0 || profit_factor==0 || tp<=0 || sl<=0)
      return;
At the end of the function, send an order according to the best pass if there is an entry signal.
   if(signal==1)
     {
      double price=SymbolInfoDouble(_Symbol,SYMBOL_ASK);
      tp+=price;
      sl=price-sl;
      Trade.Buy(Lot,_Symbol,price,sl,tp,"Real Time Optimizator");
     }
   else
      if(signal==-1)
        {
         double price=SymbolInfoDouble(_Symbol,SYMBOL_BID);
         tp=price-tp;
         sl+=price;
         Trade.Sell(Lot,_Symbol,price,sl,tp,"Real Time Optimizator");
        }
  }
Find the full EA code in the attachment.
5. Testing the approach
To demonstrate the method, the obtained EA was tested along with a parallel optimization of a standard EA with forward testing using similar ranges of adjustable parameters and preserving the common testing time interval. In order to keep conditions equal, we created the EA that launches only one tester indicator and opens deals on all its signals without filtering by statistical data. The structure of its construction is similar to the EA created above with the exception of the signal consistency filtering block. The full EA code can be found in the attachment (ClassicExpert.mq5).
Tests have been carried out on H1 for 7 months of 2018. 1/3 of a tested period was left for a forward test of a standard EA.
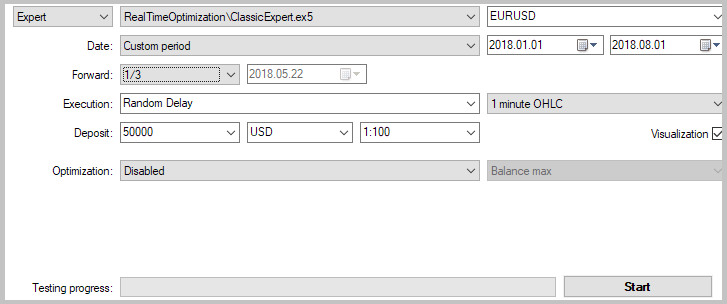
Indicator calculation periods were selected as optimization parameters. A single range of values from 5 to 30 with the step of 5 was used for all indicators.
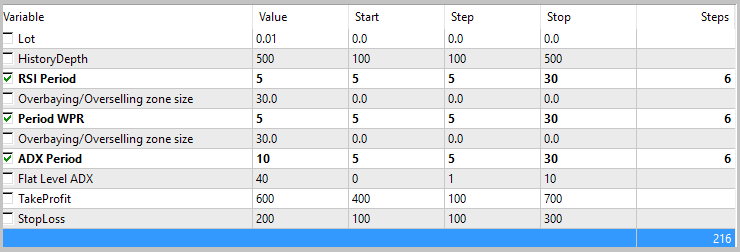
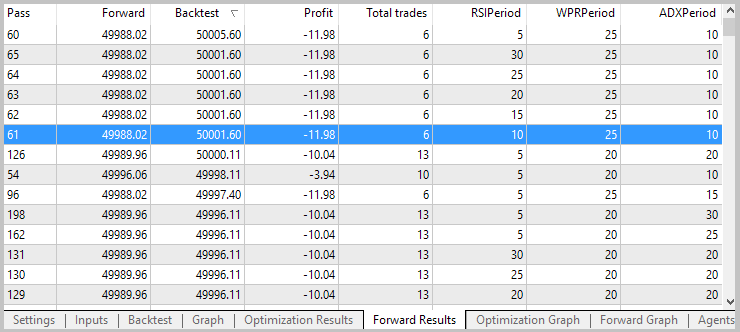
The optimization results showed the inconsistency of the proposed strategy. Parameter values that showed a small profit during the optimization turned out to be loss-making during a forward test. In total, none of the passes showed a profit within the analyzed period.
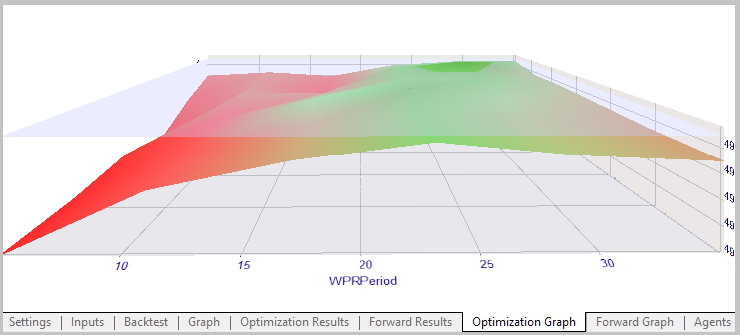
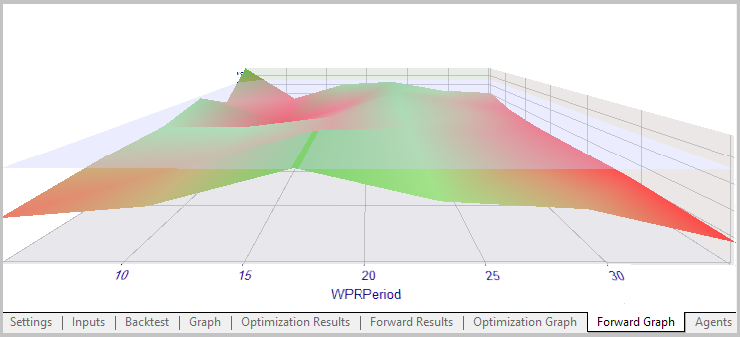
The results of the graphical analysis of the optimization and forward test showed a change in the structure of the price movement leading to the shift of the profitability zone by the WPR indicator period.
To test the EA developed according to a proposed method, we specified similar test parameters while keeping the analyzed period the same. To sort out market entry signals, we specified the minimum profitable deal probability equal to 60% and the minimum profit factor within the tested period equal to 2. The testing depth is 500 candles.
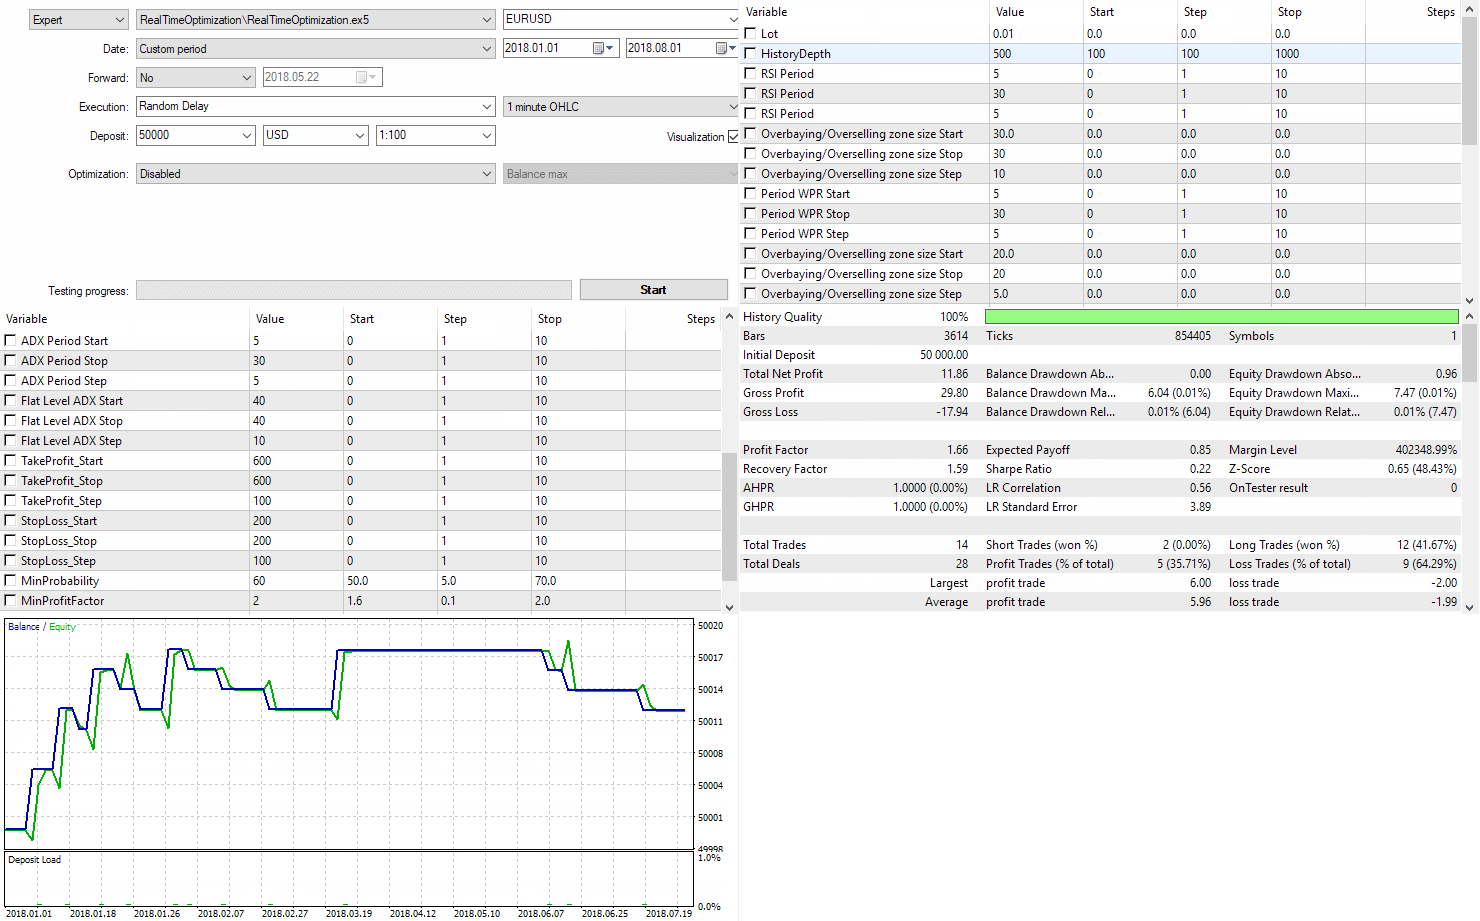
During the test, the EA showed profit with an actual profit factor of 1.66 within the analyzed period. During the test in visual mode, the test agent occupied 1250 MB of RAM.
Conclusion
The article proposed the method of developing EAs with optimization in real time. The tests have shown the viability of the approach for real trading. The EA based on the proposed method has proved the possibility of gaining profit during the strategy's profitability period and stopping activity when it is loss-making. At the same time, the method is demanding in terms of computational resources. The CPU speed should be able to recalculate all loaded indicators, while RAM should contain all the applied indicators.
References
Programs used in the article
| # |
Name |
Type |
Description |
|---|---|---|---|
| 1 | Deal.mqh | Class library | Class of virtual deals |
| 2 | TestIndicator.mq5 | Indicator | Tester indicator |
| 3 | RealTimeOptimization.mq5 | Expert Advisor | The EA based on the proposed method |
| 4 | ClassicExpert.mq5 | Expert Advisor | The EA based on the standard method for comparative optimization |
Translated from Russian by MetaQuotes Ltd.
Original article: https://www.mql5.com/ru/articles/5061
 MQL5 Cookbook: Getting properties of an open hedge position
 Modeling time series using custom symbols according to specified distribution laws
- Free trading apps
- Over 8,000 signals for copying
- Economic news for exploring financial markets
You agree to website policy and terms of use