
Creating a new trading strategy using a technology of resolving entries into indicators
Introduction
It is well-known that only 5% of traders get stable profit in financial markets, whereas all the 100% want to achieve that.
To have successful trading, you need a profitable trading strategy. Subject-related websites and literature on trading describe hundreds of various trading strategies. A detailed interpretation of signals is attached to all the indicators, but statistics remains unchanged: The 5% have turned neither into 100 nor into at least 10. Trading ideologists blame on market instability which entails that earlier profitable strategies lose effectiveness.
In my previous article I already told about resolving entries into indicators and showed an example of improving the existing strategy. Now I propose to create a custom strategy “with a blank sheet” using the specified technology. This will allow us to look at the indicators you know with “brand new eyes”, to collect custom indicator template, as well as to reconsider their signals. Application of the suggested technology implies creative approach to interpretation of indicator signals which enables each user to create own unique strategy.
1. Creating a model for testing and analysis
The first thing we see in a trading terminal is continuous price movement. Potentially, having opened a trade at any moment we may get profit. But how can you determine where and how intensively the price will head to at the next moment? Traders try to find an answer to this question in technical and fundamental analysis. For carrying out technical analysis various indicators are permanently invented and improved. The novelty here is in interpretation of these indicator signals; it may differ from the common one.
Thus, the technology for resolving entries into indicators implies comparison of open positions with indicator values. Once again, potentially, we may get profit at any moment. On the basis of these input data, in the beginning of each candle open two bi-directional positions with set parameters. Then, analyze how profit factor of each trade depends on indicator values.
To solve this problem carry out minor preparational work.
1.1. Creating a virtual order class
I use a netting account. Therefore, to open bi-directional orders I will create virtual orders which will be traced not by the terminal (according to account settings) but by the Expert Advisor. For this purpose create CDeal class. When initializing a class instance we will pass to it: symbol name, position type, opening time and price, as well as stoploss and takeprofit. Position volume is omitted intentionally because here it is of no interest to us. The important thing to us is price movement, therefore profit/loss will be calculated in points instead of monetary terms.
For servicing the class was added with functions of position status check:
- IsClosed — returns logic value, whether position is closed or not;
- Type - returns position type;
- GetProfit — returns profit of a closed position (for a loss position the value will be negative);
- GetTime — returns position open time.
class CDeal          :  public CObject
  {
private:
   string               s_Symbol;
   datetime             dt_OpenTime;         // Time of open position
   double               d_OpenPrice;         // Price of opened position
   double               d_SL_Price;          // Stop Loss of position
   double               d_TP_Price;          // Take Profit of position
   ENUM_POSITION_TYPE   e_Direct;            // Direct of opened position
   double               d_ClosePrice;        // Price of close position
   int                  i_Profit;            // Profit of position in pips
//---
   double               d_Point;

public:
                     CDeal(string symbol, ENUM_POSITION_TYPE type,datetime time,double open_price,double sl_price, double tp_price);
                    ~CDeal();
   //--- Check status
   bool              IsClosed(void);
   ENUM_POSITION_TYPE Type(void)    {  return e_Direct;    }
   double            GetProfit(void);
   datetime          GetTime(void)  {  return dt_OpenTime;  }
   //---
   void              Tick(void);
  };
Incoming ticks will be processed in Tick function which will check and where necessary close a position by stoploss or takeprofit and save accumulated profit.
void CDeal::Tick(void)
  {
   if(d_ClosePrice>0)
      return;
   double price=0;
   switch(e_Direct)
     {
      case POSITION_TYPE_BUY:
        price=SymbolInfoDouble(s_Symbol,SYMBOL_BID);
        if(d_SL_Price>0 && d_SL_Price>=price)
          {
           d_ClosePrice=price;
           i_Profit=(int)((d_ClosePrice-d_OpenPrice)/d_Point);
          }
        else
          {
           if(d_TP_Price>0 && d_TP_Price<=price)
             {
              d_ClosePrice=price;
              i_Profit=(int)((d_ClosePrice-d_OpenPrice)/d_Point);
             }
          }
        break;
      case POSITION_TYPE_SELL:
        price=SymbolInfoDouble(s_Symbol,SYMBOL_ASK);
        if(d_SL_Price>0 && d_SL_Price<=price)
          {
           d_ClosePrice=price;
           i_Profit=(int)((d_OpenPrice-d_ClosePrice)/d_Point);
          }
        else
          {
           if(d_TP_Price>0 && d_TP_Price>=price)
             {
              d_ClosePrice=price;
              i_Profit=(int)((d_OpenPrice-d_ClosePrice)/d_Point);
             }
          }
        break;
     }
  }
1.2. Creating a class to work with indicators
To save and analyze indicator data I used the classes detailed in the previous article. Also, here I created CDealsToIndicators class, generalizing all the indicator classes. It will store indicator class arrays and arrange their functioning.
class CDealsToIndicators
  {
private:
   CADX              *ADX[];
   CAlligator        *Alligator[];
   COneBufferArray   *OneBuffer[];
   CMACD             *MACD[];
   CStaticOneBuffer  *OneBufferStatic[];
   CStaticMACD       *MACD_Static[];
   CStaticADX        *ADX_Static[];
   CStaticAlligator  *Alligator_Static[];

   template<typename T>
   void              CleareArray(T *&array[]);

public:
                     CDealsToIndicators();
                    ~CDealsToIndicators();
   //---
   bool              AddADX(string symbol, ENUM_TIMEFRAMES timeframe, int period, string name);
   bool              AddADX(string symbol, ENUM_TIMEFRAMES timeframe, int period, string name, int &handle);
   bool              AddAlligator(string symbol,ENUM_TIMEFRAMES timeframe,uint jaw_period, uint jaw_shift, uint teeth_period, uint teeth_shift, uint lips_period, uint lips_shift, ENUM_MA_METHOD method, ENUM_APPLIED_PRICE price, string name);
   bool              AddAlligator(string symbol,ENUM_TIMEFRAMES timeframe,uint jaw_period, uint jaw_shift, uint teeth_period, uint teeth_shift, uint lips_period, uint lips_shift, ENUM_MA_METHOD method, ENUM_APPLIED_PRICE price, string name, int &handle);
   bool              AddMACD(string symbol, ENUM_TIMEFRAMES timeframe, uint fast_ema, uint slow_ema, uint signal, ENUM_APPLIED_PRICE applied_price, string name);
   bool              AddMACD(string symbol, ENUM_TIMEFRAMES timeframe, uint fast_ema, uint slow_ema, uint signal, ENUM_APPLIED_PRICE applied_price, string name, int &handle);
   bool              AddOneBuffer(int handle, string name);
   //---
   bool              SaveNewValues(long ticket);
   //---
   bool              Static(CArrayObj *deals);
  };
1.3. Creating Expert Advisor for testing
Everything is prepared. Now, proceed to creation of EA to work in the strategy tester. First, define the list of indicators applied and their parameters. To demonstrate the technology, I took the following indicators:
- ADX;
- Alligator;
- CCI;
- Chaikin;
- Force Index;
- MACD.
For each of them, three sets of parameters are created, data are traced on three timeframes.
Stop loss and take profit trades are bound to ATR indicator values and are set through profit to risk ratio.
//--- input parameters
input double            Reward_Risk    =  1.0;
input int               ATR_Period     =  288;
input ENUM_TIMEFRAMES   TimeFrame1     =  PERIOD_M5;
input ENUM_TIMEFRAMES   TimeFrame2     =  PERIOD_H1;
input ENUM_TIMEFRAMES   TimeFrame3     =  PERIOD_D1;
input string            s1                =  "ADX"                ;  //---
input uint              ADX_Period1       =  14                   ;
input uint              ADX_Period2       =  28                   ;
input uint              ADX_Period3       =  56                   ;
input string            s2                =  "Alligator"          ;  //---
input uint              JAW_Period1       =  13                   ;
input uint              JAW_Shift1        =  8                    ;
input uint              TEETH_Period1     =  8                    ;
input uint              TEETH_Shift1      =  5                    ;
input uint              LIPS_Period1      =  5                    ;
input uint              LIPS_Shift1       =  3                    ;
input uint              JAW_Period2       =  26                   ;
input uint              JAW_Shift2        =  16                   ;
input uint              TEETH_Period2     =  16                   ;
input uint              TEETH_Shift2      =  10                   ;
input uint              LIPS_Period2      =  10                   ;
input uint              LIPS_Shift2       =  6                    ;
input uint              JAW_Period3       =  42                   ;
input uint              JAW_Shift3        =  32                   ;
input uint              TEETH_Period3     =  32                   ;
input uint              TEETH_Shift3      =  20                   ;
input uint              LIPS_Period3      =  20                   ;
input uint              LIPS_Shift3       =  12                   ;
input ENUM_MA_METHOD    Alligator_Method  =  MODE_SMMA            ;
input ENUM_APPLIED_PRICE Alligator_Price  =  PRICE_MEDIAN         ;
input string            s5                =  "CCI"                ;  //---
input uint              CCI_Period1       =  14                   ;
input uint              CCI_Period2       =  28                   ;
input uint              CCI_Period3       =  56                   ;
input ENUM_APPLIED_PRICE CCI_Price        =  PRICE_TYPICAL        ;
input string            s6                =  "Chaikin"            ;  //---
input uint              Ch_Fast_Period1   =  3                    ;
input uint              Ch_Slow_Period1   =  14                   ;
input uint              Ch_Fast_Period2   =  6                    ;
input uint              Ch_Slow_Period2   =  28                   ;
input uint              Ch_Fast_Period3   =  12                   ;
input uint              Ch_Slow_Period3   =  56                   ;
input ENUM_MA_METHOD    Ch_Method         =  MODE_EMA             ;
input ENUM_APPLIED_VOLUME Ch_Volume       =  VOLUME_TICK          ;
input string            s7                =  "Force Index"        ;  //---
input uint              Force_Period1     =  14                   ;
input uint              Force_Period2     =  28                   ;
input uint              Force_Period3     =  56                   ;
input ENUM_MA_METHOD    Force_Method      =  MODE_SMA             ;
input ENUM_APPLIED_VOLUME Force_Volume    =  VOLUME_TICK          ;
input string            s8                =  "MACD"               ;  //---
input uint              MACD_Fast1        =  12                   ;
input uint              MACD_Slow1        =  26                   ;
input uint              MACD_Signal1      =  9                    ;
input uint              MACD_Fast2        =  24                   ;
input uint              MACD_Slow2        =  52                   ;
input uint              MACD_Signal2      =  18                   ;
input uint              MACD_Fast3        =  48                   ;
input uint              MACD_Slow3        =  104                  ;
input uint              MACD_Signal3      =  36                   ;
input ENUM_APPLIED_PRICE MACD_Price       =  PRICE_CLOSE          ;
In the global variable block declare:
- array for storing trade classes Deals,
- class instance to work with indicators IndicatorsStatic,
- variable for storing ATR indicator handle,
- two service variables for storing the time of the last processed bar (last_bar) and the last closed order (last_closed_deal). We will need the latter not to go through already closed positions at each tick.
In OnInit function, carry out initialization of global variables and required indicator classes.
int OnInit()
  {
//---
   last_bar=0;
   last_closed_deal=0;
//---
   Deals =  new CArrayObj();
   if(CheckPointer(Deals)==POINTER_INVALID)
      return INIT_FAILED;
//---
   IndicatorsStatic  =  new CDealsToIndicators();
   if(CheckPointer(IndicatorsStatic)==POINTER_INVALID)
      return INIT_FAILED;
//---
   atr=iATR(_Symbol,TimeFrame1,ATR_Period);
   if(atr==INVALID_HANDLE)
      return INIT_FAILED;
//---
   AddIndicators(TimeFrame1);
   AddIndicators(TimeFrame2);
   AddIndicators(TimeFrame3);
//---
   return(INIT_SUCCEEDED);
  }
We will use the same set of indicators at three different timeframes. That is why it is resonable to put initialization of indicator classes into a separate function AddIndicators. In its parameters the required timeframe will be specified.
bool AddIndicators(ENUM_TIMEFRAMES timeframe)
  {
   if(CheckPointer(IndicatorsStatic)==POINTER_INVALID)
     {
      IndicatorsStatic  =  new CDealsToIndicators();
      if(CheckPointer(IndicatorsStatic)==POINTER_INVALID)
         return false;
     }
   string tf_name=StringSubstr(EnumToString(timeframe),7);
   string name="ADX("+IntegerToString(ADX_Period1)+") "+tf_name;
   if(!IndicatorsStatic.AddADX(_Symbol, timeframe, ADX_Period1, name))
      return false;
   name="ADX("+IntegerToString(ADX_Period2)+") "+tf_name;
   if(!IndicatorsStatic.AddADX(_Symbol, timeframe, ADX_Period2, name))
      return false;
   name="ADX("+IntegerToString(ADX_Period3)+") "+tf_name;
   if(!IndicatorsStatic.AddADX(_Symbol, timeframe, ADX_Period3, name))
      return false;
   name="Alligator("+IntegerToString(JAW_Period1)+","+IntegerToString(TEETH_Period1)+","+IntegerToString(LIPS_Period1)+") "+tf_name;
   if(!IndicatorsStatic.AddAlligator(_Symbol, timeframe, JAW_Period1, JAW_Shift1, TEETH_Period1, TEETH_Shift1, LIPS_Period1, LIPS_Shift1, Alligator_Method, Alligator_Price, name))
      return false;
   name="Alligator("+IntegerToString(JAW_Period2)+","+IntegerToString(TEETH_Period2)+","+IntegerToString(LIPS_Period2)+") "+tf_name;
   if(!IndicatorsStatic.AddAlligator(_Symbol, timeframe, JAW_Period2, JAW_Shift2, TEETH_Period2, TEETH_Shift2, LIPS_Period2, LIPS_Shift2, Alligator_Method, Alligator_Price, name))
      return false;
   name="Alligator("+IntegerToString(JAW_Period3)+","+IntegerToString(TEETH_Period3)+","+IntegerToString(LIPS_Period3)+") "+tf_name;
   if(!IndicatorsStatic.AddAlligator(_Symbol, timeframe, JAW_Period3, JAW_Shift3, TEETH_Period3, TEETH_Shift3, LIPS_Period3, LIPS_Shift3, Alligator_Method, Alligator_Price, name))
      return false;
   name="MACD("+IntegerToString(MACD_Fast1)+","+IntegerToString(MACD_Slow1)+","+IntegerToString(MACD_Signal1)+") "+tf_name;
   if(!IndicatorsStatic.AddMACD(_Symbol, timeframe, MACD_Fast1, MACD_Slow1, MACD_Signal1, MACD_Price, name))
      return false;
   name="MACD("+IntegerToString(MACD_Fast2)+","+IntegerToString(MACD_Slow2)+","+IntegerToString(MACD_Signal2)+") "+tf_name;
   if(!IndicatorsStatic.AddMACD(_Symbol, timeframe, MACD_Fast2, MACD_Slow2, MACD_Signal2, MACD_Price, name))
      return false;
   name="MACD("+IntegerToString(MACD_Fast3)+","+IntegerToString(MACD_Slow3)+","+IntegerToString(MACD_Signal3)+") "+tf_name;
   if(!IndicatorsStatic.AddMACD(_Symbol, timeframe, MACD_Fast3, MACD_Slow3, MACD_Signal3, MACD_Price, name))
      return false;
   name="CCI("+IntegerToString(CCI_Period1)+") "+tf_name;
   int handle = iCCI(_Symbol, timeframe, CCI_Period1, CCI_Price);
   if(handle<0 || !IndicatorsStatic.AddOneBuffer(handle, name) )
      return false;
   name="CCI("+IntegerToString(CCI_Period2)+") "+tf_name;
   handle = iCCI(_Symbol, timeframe, CCI_Period2, CCI_Price);
   if(handle<0 || !IndicatorsStatic.AddOneBuffer(handle, name) )
      return false;
   handle = iCCI(_Symbol, timeframe, CCI_Period3, CCI_Price);
   name="CCI("+IntegerToString(CCI_Period3)+") "+tf_name;
   if(handle<0 || !IndicatorsStatic.AddOneBuffer(handle, name) )
      return false;
   handle = iForce(_Symbol, timeframe, Force_Period1, Force_Method, Force_Volume);
   name="Force("+IntegerToString(Force_Period1)+") "+tf_name;
   if(handle<0 || !IndicatorsStatic.AddOneBuffer(handle, name) )
      return false;
   handle = iForce(_Symbol, timeframe, Force_Period2, Force_Method, Force_Volume);
   name="Force("+IntegerToString(Force_Period2)+") "+tf_name;
   if(handle<0 || !IndicatorsStatic.AddOneBuffer(handle, name) )
      return false;
   handle = iForce(_Symbol, timeframe, Force_Period3, Force_Method, Force_Volume);
   name="Force("+IntegerToString(Force_Period3)+") "+tf_name;
   if(handle<0 || !IndicatorsStatic.AddOneBuffer(handle, name) )
      return false;
   name="CHO("+IntegerToString(Ch_Slow_Period1)+","+IntegerToString(Ch_Fast_Period1)+") "+tf_name;
   handle = iChaikin(_Symbol, timeframe, Ch_Fast_Period1, Ch_Slow_Period1, Ch_Method, Ch_Volume);
   if(handle<0 || !IndicatorsStatic.AddOneBuffer(handle, name) )
      return false;
   handle = iChaikin(_Symbol, timeframe, Ch_Fast_Period2, Ch_Slow_Period2, Ch_Method, Ch_Volume);
   name="CHO("+IntegerToString(Ch_Slow_Period2)+","+IntegerToString(Ch_Fast_Period2)+") "+tf_name;
   if(handle<0 || !IndicatorsStatic.AddOneBuffer(handle, name) )
      return false;
   handle = iChaikin(_Symbol, timeframe, Ch_Fast_Period3, Ch_Slow_Period3, Ch_Method, Ch_Volume);
   name="CHO("+IntegerToString(Ch_Slow_Period3)+","+IntegerToString(Ch_Fast_Period3)+") "+tf_name;
   if(handle<0 || !IndicatorsStatic.AddOneBuffer(handle, name) )
      return false;
   return true;
  }
The operations performed in OnTick may be divided into two blocks: checkup of open positions and opening new positions.
The first block of operations is performed at each tick. In it, all the previously opened trades are consequently retrieved from array and for each of them Tick function is called. It checks trigger of position stop loss and take profit and, where necessary, an order is closed at the current price with saving of generated profit. In order not to re-check earlier closed trades, in variable last_closed_deal the number of the trade preceding the first unclosed one is saved.
void OnTick()
  {
//---
   int total=Deals.Total();
   CDeal *deal;
   bool found=false;
   for(int i=last_closed_deal;i<total;i++)
     {
      deal  =  Deals.At(i);
      if(CheckPointer(deal)==POINTER_INVALID)
         continue;
      if(!found)
        {
         if(deal.IsClosed())
           {
            last_closed_deal=i;
            continue;
           }
         else
            found=true;
        }
      deal.Tick();
     }
The second block of operations starts with the check of new bar occurrence. In the beginning of each bar download ATR indicator value at the last closed candle, calculate stop loss and take profit levels according to the set parameters and open virtual positions. For each position save indicator data having called SaveNewValues function of our class for working with indicators.
//---
   datetime cur_bar=(datetime)SeriesInfoInteger(_Symbol,PERIOD_CURRENT,SERIES_LASTBAR_DATE);
   datetime cur_time=TimeCurrent();
   if(cur_bar==last_bar || (cur_time-cur_bar)>10)
      return;
   double atrs[];
   if(CopyBuffer(atr,0,1,1,atrs)<=0)
      return;

   last_bar=cur_bar;
   double ask=SymbolInfoDouble(_Symbol,SYMBOL_ASK);
   double bid=SymbolInfoDouble(_Symbol,SYMBOL_BID);
   double stops=MathMax(2*atrs[0],SymbolInfoInteger(_Symbol,SYMBOL_TRADE_STOPS_LEVEL)*_Point);
   double sl=NormalizeDouble(stops,_Digits);
   double tp=NormalizeDouble(Reward_Risk*(stops+ask-bid),_Digits);
   deal  =  new CDeal(_Symbol,POSITION_TYPE_BUY,TimeCurrent(),ask,bid-sl,ask+tp);
   if(CheckPointer(deal)!=POINTER_INVALID)
      if(Deals.Add(deal))
         IndicatorsStatic.SaveNewValues(Deals.Total()-1);
   deal  =  new CDeal(_Symbol,POSITION_TYPE_SELL,TimeCurrent(),bid,ask+sl,bid-tp);
   if(CheckPointer(deal)!=POINTER_INVALID)
      if(Deals.Add(deal))
         IndicatorsStatic.SaveNewValues(Deals.Total()-1);
   return;
  }
In OnTester, collect results of the test run and construct charts for analysis. For this purpose, call Static function of class for working with indicators.
Make sure to clean memory in OnDeinit function!
Full code of EA and classes used is provided in attachment.
2. Analysis of testing results
So, we have created testing EA. Now, let’s think over the period analyzed. When choosing a period, take into account that it should be sufficiently long to provide for analysis objectivity. Another requirement to a period: it should include not only unidirectional movements but also periods of bi-directional trend movements, as well as sideway (flat) ones. Such approach allows creating a trading strategy able to generate profit within periods of any movements. My example analyzes currency pair EURUSD for the period from 1/01/2016 to 1/10/2017.

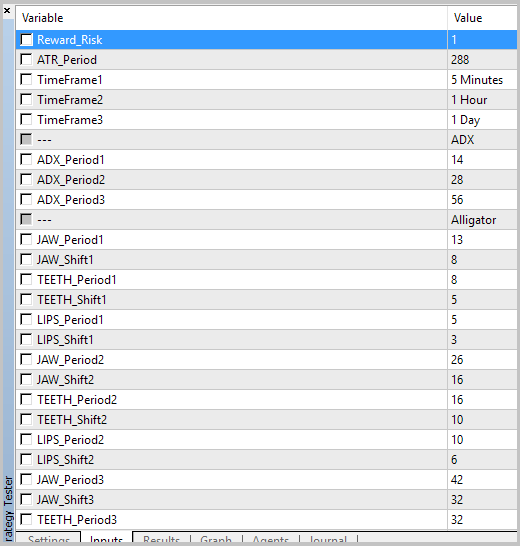
So far, our process will have iterative character I recommend after setting all the necessary parameters of testing EA to save the parameter set-file for further work.
Each testing stage will be carried out in 2 runs with profit/risk ratio equal to 1/1 and 15/1. By the first run, we will evaluate probability of directed movement, while by the second one - movement force.
The EA shows a great number of charts for analysis, therefore they are not provided in the article in full - all the reports are provided in attachment. Here, we will show only the charts, by which decisions on the use of indicators in the new strategy were made.
2.1. Stage one
As we expected, the first testing stage did not show definite profitable areas. But, at the same time, one should pay attention to force index indicator. At M5 timeframe, the chart of trade profit dependency on indicator values slumps in the zero area. Importance of this observation is evidenced by the fact that this phenomenon appears at analytical indicator charts with all the parameters used for testing. For our template select parameters with the most apparent phenomenon character (maximal drawdown).
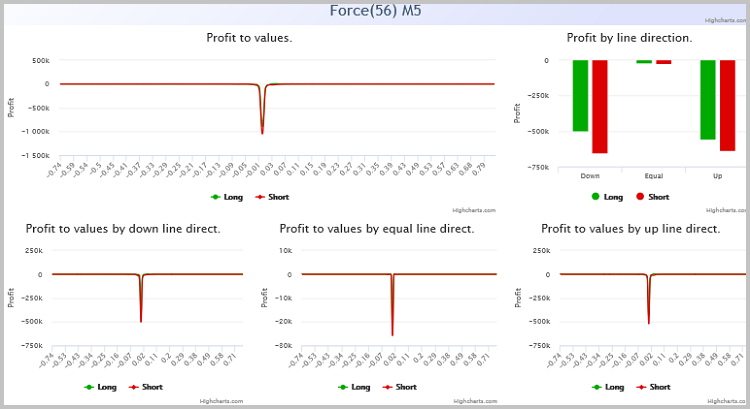
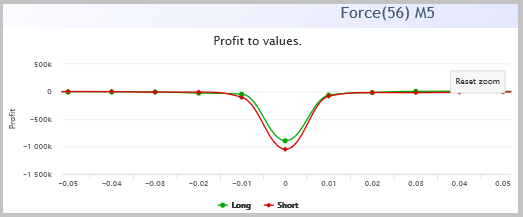
Let us zoom the chart analyzed. As you can see, the effect of this factor is available within the range from -0.01 to 0.01. The phenomenon observed is equally true both for buy trades and sell trades.
This observation may be explained by absence of volatility within the value range observed. For our strategy, make sure to mark prohibition to open any orders within this range.
Add our EA to this filter. For doing this, first add global variable for storing indicator handle.
int force;
So far as the indicator needed as the filter is already applied in the EA, we will not attach it to the chart once again. Just copy its handle to our global variable in AddIndicators. But make sure to remember that this function is called for three times for indicator initialization at different timeframes. Hence, prior to copying indicator handle we should check timeframe compliance.
   handle = iForce(_Symbol, timeframe, Force_Period3, Force_Method, Force_Volume);
   if(timeframe==TimeFrame1)
      force=handle;
Now, add the filter immediately to OnTick. When building the chart remember that in the function of analytical chart building data were rounded off. Therefore, when filtering trades indicator values should also be preliminary rounded off.
   double atrs[];
   double force_data[];
   if(CopyBuffer(atr,0,1,1,atrs)<=0 || CopyBuffer(force,0,1,1,force_data)<=0)
      return;      // Some error of load indicator's data

   last_bar=cur_bar;
   double d_Step=_Point*1000;
   if(MathAbs(NormalizeDouble(force_data[0]/d_Step,0)*d_Step)<=0.01)
      return;    // Filtered by Force Index
The full EA code is provided in attachment to this article.
After adding the filter into the EA, implement the second testing stage. Before testing, make sure to download the earlier saved parameters.
2.2. Stage two
After repeated EA testing, I paid attention to MACD indicator. Profitable areas appeared on the chart.
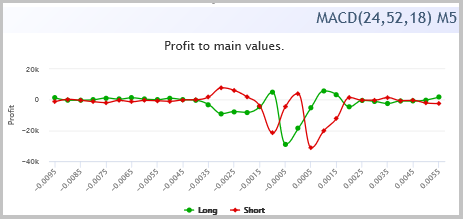
On the chart with the ratio of profit/risk 15/1, these areas are more expressed; this may evidence potential of signals within these ranges.
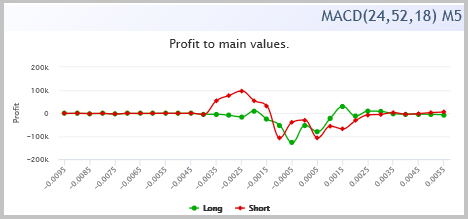
This filter should also be added to our EA code. Logic of filter adding is analogous to that provided in the description of stage one.
Into global variables:
int macd;
Into the AddIndicators function:
   name="MACD("+IntegerToString(MACD_Fast2)+","+IntegerToString(MACD_Slow2)+","+IntegerToString(MACD_Signal2)+") "+tf_name;
   if(timeframe==TimeFrame1)
     {
      if(!IndicatorsStatic.AddMACD(_Symbol, timeframe, MACD_Fast2, MACD_Slow2, MACD_Signal2, MACD_Price, name, macd))
         return false;
     }
   else
     {
      if(!IndicatorsStatic.AddMACD(_Symbol, timeframe, MACD_Fast2, MACD_Slow2, MACD_Signal2, MACD_Price, name))
         return false;
     }
Into OnTick:
   double macd_data[];
   if(CopyBuffer(atr,0,1,1,atrs)<=0 || CopyBuffer(force,0,1,1,force_data)<=0 || CopyBuffer(macd,0,1,1,macd_data)<=0)
      return;
and
   double macd_Step=_Point*50;
   macd_data[0]=NormalizeDouble(macd_data[0]/macd_Step,0)*macd_Step;
   if(macd_data[0]>=0.0015 && macd_data[0]<=0.0035)
     {
      deal  =  new CDeal(_Symbol,POSITION_TYPE_BUY,TimeCurrent(),ask,bid-sl,ask+tp);
      if(CheckPointer(deal)!=POINTER_INVALID)
         if(Deals.Add(deal))
            IndicatorsStatic.SaveNewValues(Deals.Total()-1);
     }
   if(macd_data[0]<=(-0.0015) && macd_data[0]>=(-0.0035))
     {
      deal  =  new CDeal(_Symbol,POSITION_TYPE_SELL,TimeCurrent(),bid,ask+sl,bid-tp);
      if(CheckPointer(deal)!=POINTER_INVALID)
         if(Deals.Add(deal))
            IndicatorsStatic.SaveNewValues(Deals.Total()-1);
     }
After adding the filter shift to the third testing stage.
2.3. Stage three
At stage three, I paid attention to Chaikin oscillator. On oscillator analytical charts on timeframe D1 we see profit growth on long positions at reduction of values, while at growth of indicator values profit grows on short positions.

My observation is confirmed also when analyzing charts with ratio profit/risk equal to 15/1.

Add our observation to EA code.
Into global variables:
int cho;
Into the AddIndicators function:
   handle = iChaikin(_Symbol, timeframe, Ch_Fast_Period2, Ch_Slow_Period2, Ch_Method, Ch_Volume);
   name="CHO("+IntegerToString(Ch_Slow_Period2)+","+IntegerToString(Ch_Fast_Period2)+") "+tf_name;
   if(handle<0 || !IndicatorsStatic.AddOneBuffer(handle, name) )
      return false;
   if(timeframe==TimeFrame3)
      cho=handle;
Into OnTick:
   double cho_data[];
   if(CopyBuffer(atr,0,1,1,atrs)<=0 || CopyBuffer(force,0,1,1,force_data)<=0 || CopyBuffer(macd,0,1,1,macd_data)<=0
      || CopyBuffer(cho,0,1,2,cho_data)<2)
      return;
and
   if(macd_data[0]>=0.0015 && macd_data[0]<=0.0035 && (cho_data[1]-cho_data[0])<0)
     {
      deal  =  new CDeal(_Symbol,POSITION_TYPE_BUY,TimeCurrent(),ask,bid-sl,ask+tp);
      if(CheckPointer(deal)!=POINTER_INVALID)
         if(Deals.Add(deal))
            IndicatorsStatic.SaveNewValues(Deals.Total()-1);
     }
   if(macd_data[0]<=(-0.0015) && macd_data[0]>=(-0.0035) && (cho_data[1]-cho_data[0])>0)
     {
      deal  =  new CDeal(_Symbol,POSITION_TYPE_SELL,TimeCurrent(),bid,ask+sl,bid-tp);
      if(CheckPointer(deal)!=POINTER_INVALID)
         if(Deals.Add(deal))
            IndicatorsStatic.SaveNewValues(Deals.Total()-1);
     }
Proceed to the following stage.
2.4. Stage four
After yet another testing of the EA, my attention was once again drawn by timeframe D1. This time, I considered CCI indicator. Its analytical charts demonstrated profit growth on short positions at reduction of indicator values and profit growth of long positions - with the growth of indicator values. This trend was observed at all the three periods studied, but the maximal profit was reached when using period 14, standard for this oscillator.

Analytical charts received at testing with ratio profit/risk equal to 15/1 confirm our observation.

Add this observation also to testing EA code.
Into global variables:
int cci;
To AddIndicators:
   name="CCI("+IntegerToString(CCI_Period1)+") "+tf_name;
   int handle = iCCI(_Symbol, timeframe, CCI_Period1, CCI_Price);
   if(handle<0 || !IndicatorsStatic.AddOneBuffer(handle, name) )
      return false;
   if(timeframe==TimeFrame3)
      cci=handle;
To OnTick:
   double cci_data[];
   if(CopyBuffer(atr,0,1,1,atrs)<=0 || CopyBuffer(force,0,1,1,force_data)<=0 || CopyBuffer(macd,0,1,1,macd_data)<=0
      || CopyBuffer(cho,0,1,2,cho_data)<2 || CopyBuffer(cci,0,1,2,cci_data)<2)
      return;
and
   if(macd_data[0]>=0.0015 && macd_data[0]<=0.0035 && (cho_data[1]-cho_data[0])<0 && (cci_data[1]-cci_data[0])>0)
     {
      deal  =  new CDeal(_Symbol,POSITION_TYPE_BUY,TimeCurrent(),ask,bid-sl,ask+tp);
      if(CheckPointer(deal)!=POINTER_INVALID)
         if(Deals.Add(deal))
            IndicatorsStatic.SaveNewValues(Deals.Total()-1);
     }
   if(macd_data[0]<=(-0.0015) && macd_data[0]>=(-0.0035) && (cho_data[1]-cho_data[0])>0 && (cci_data[1]-cci_data[0])<0)
     {
      deal  =  new CDeal(_Symbol,POSITION_TYPE_SELL,TimeCurrent(),bid,ask+sl,bid-tp);
      if(CheckPointer(deal)!=POINTER_INVALID)
         if(Deals.Add(deal))
            IndicatorsStatic.SaveNewValues(Deals.Total()-1);
     }
Full code of EA at all the stages is provided in attachment to the article.
3. Creation and testing of the EA on selected signals
There is no limit to perfection, you may keep on analyzing and adding filters for increasing strategy profit factor. But I believe that the four provided stages are sufficient enough for technology demonstration. By the next step create a simple EA for checking our strategy in the tester. This will allow us to assess profit factor and drawdowns of our strategy, as well as balance variation in progress.
In the strategy we used four indicators for making a decision about the trade and ATR indicator for setting stop loss and take profit. Consequently, in EA input parameters we should set all the input information required for indicators. At this stage, we will not create money management, all the orders will use fixed amount of volume.
//--- input parameters
input double            Lot               =  0.1                  ;
input double            Reward_Risk       =  15.0                 ;
input ENUM_TIMEFRAMES   ATR_TimeFrame     =  PERIOD_M5            ;
input int               ATR_Period        =  288                  ;
input string            s1                =  "CCI"                ;  //---
input ENUM_TIMEFRAMES   CCI_TimeFrame     =  PERIOD_D1            ;
input uint              CCI_Period        =  14                   ;
input ENUM_APPLIED_PRICE CCI_Price        =  PRICE_TYPICAL        ;
input string            s2                =  "Chaikin"            ;  //---
input ENUM_TIMEFRAMES   Ch_TimeFrame      =  PERIOD_D1            ;
input uint              Ch_Fast_Period    =  6                    ;
input uint              Ch_Slow_Period    =  28                   ;
input ENUM_MA_METHOD    Ch_Method         =  MODE_EMA             ;
input ENUM_APPLIED_VOLUME Ch_Volume       =  VOLUME_TICK          ;
input string            s3                =  "Force Index"        ;  //---
input ENUM_TIMEFRAMES   Force_TimeFrame   =  PERIOD_M5            ;
input uint              Force_Period      =  56                   ;
input ENUM_MA_METHOD    Force_Method      =  MODE_SMA             ;
input ENUM_APPLIED_VOLUME Force_Volume    =  VOLUME_TICK          ;
input string            s4                =  "MACD"               ;  //---
input ENUM_TIMEFRAMES   MACD_TimeFrame    =  PERIOD_M5            ;
input uint              MACD_Fast         =  12                   ;
input uint              MACD_Slow         =  26                   ;
input uint              MACD_Signal       =  9                    ;
input ENUM_APPLIED_PRICE MACD_Price       =  PRICE_CLOSE          ;
In global variables declare:
- class instance for performing trading operations,
- variables for handle storage of indicators used,
- auxiliary variables for recording dates of the last processed bar and last trade,
- variables for storing the maximal and the minimal timeframe.
In OnInit function, initialize indicators and set initial values of variables.
int OnInit()
  {
//---
   last_bar=0;
   last_deal=0;
//---
   atr=iATR(_Symbol,ATR_TimeFrame,ATR_Period);
   if(atr==INVALID_HANDLE)
      return INIT_FAILED;
//---
   force=iForce(_Symbol,Force_TimeFrame,Force_Period,Force_Method,Force_Volume);
   if(force==INVALID_HANDLE)
      return INIT_FAILED;
//---
   macd=iMACD(_Symbol,MACD_TimeFrame,MACD_Fast,MACD_Slow,MACD_Signal,MACD_Price);
   if(macd==INVALID_HANDLE)
      return INIT_FAILED;
//---
   cho=iChaikin(_Symbol,Ch_TimeFrame,Ch_Fast_Period,Ch_Slow_Period,Ch_Method,Ch_Volume);
   if(cho==INVALID_HANDLE)
      return INIT_FAILED;
//---
   cci=iCCI(_Symbol,CCI_TimeFrame,CCI_Period,CCI_Price);
   if(cci==INVALID_HANDLE)
      return INIT_FAILED;
//---
   MaxPeriod=fmax(Force_TimeFrame,MACD_TimeFrame);
   MaxPeriod=fmax(MaxPeriod,Ch_TimeFrame);
   MaxPeriod=fmax(MaxPeriod,CCI_TimeFrame);
   MinPeriod=fmin(Force_TimeFrame,MACD_TimeFrame);
   MinPeriod=fmin(MinPeriod,Ch_TimeFrame);
   MinPeriod=fmin(MinPeriod,CCI_TimeFrame);
//---
   return(INIT_SUCCEEDED);
  }
In OnDeinit function, close the indicators used.
void OnDeinit(const int reason)
  {
//---
   if(atr!=INVALID_HANDLE)
      IndicatorRelease(atr);
//---
   if(force==INVALID_HANDLE)
      IndicatorRelease(force);
//---
   if(macd==INVALID_HANDLE)
      IndicatorRelease(macd);
//---
   if(cho==INVALID_HANDLE)
      IndicatorRelease(cho);
//---
   if(cci==INVALID_HANDLE)
      IndicatorRelease(cci);
  }
Main actions will be performed in OnTick. In the beginning of the function, check occurrence of a new bar. A new position will open only at opening of a new bar by minimal timeframe (I limited 10 seconds from bar opening) and only unless a position within the current bar by maximal timeframe was opened. In such a manner, I limited opening of only one order for one signal.
void OnTick()
  {
//---
   datetime cur_bar=(datetime)SeriesInfoInteger(_Symbol,MinPeriod,SERIES_LASTBAR_DATE);
   datetime cur_max=(datetime)SeriesInfoInteger(_Symbol,MaxPeriod,SERIES_LASTBAR_DATE);
   datetime cur_time=TimeCurrent();
   if(cur_bar<=last_bar || (cur_time-cur_bar)>10 || cur_max<=last_deal)
      return;
Further, obtain data of indicators used. In case of data receipt error of at least one of the indicators exit from the function.
   last_bar=cur_bar;
   double atrs[];
   double force_data[];
   double macd_data[];
   double cho_data[];
   double cci_data[];
   if(CopyBuffer(atr,0,1,1,atrs)<=0 || CopyBuffer(force,0,1,1,force_data)<=0 || CopyBuffer(macd,0,1,1,macd_data)<=0
      || CopyBuffer(cho,0,1,2,cho_data)<2 || CopyBuffer(cci,0,1,2,cci_data)<2)
     {
      return;
     }
Then, in compliance with our strategy check force index value. If it fails to satisfy our filter, exit from the function until opening the next bar.
   double force_Step=_Point*1000;
   if(MathAbs(NormalizeDouble(force_data[0]/force_Step,0)*force_Step)<=0.01)
      return;
By the next stage, check signal for long position opening. If there is a positive signal, check whether an open position is already available. If available and it is short, close it. If a long position being at loss is already opened, ignore the signal and exit from the function.
After that, calculate parameters for the new position and send an order.
Perform the same operations for the short position.
   double macd_Step=_Point*50;
   macd_data[0]=NormalizeDouble(macd_data[0]/macd_Step,0)*macd_Step;
   if(macd_data[0]>=0.0015 && macd_data[0]<=0.0035 && (cho_data[1]-cho_data[0])<0 && (cci_data[1]-cci_data[0])>0)
     {
      if(PositionSelect(_Symbol))
        {
         switch((int)PositionGetInteger(POSITION_TYPE))
           {
            case POSITION_TYPE_BUY:
              if(PositionGetDouble(POSITION_PROFIT)<=0)
                 return;
              break;
            case POSITION_TYPE_SELL:
              Trade.PositionClose(_Symbol);
              break;
           }
        }
      last_deal=cur_max;
      double stops=MathMax(2*atrs[0],SymbolInfoInteger(_Symbol,SYMBOL_TRADE_STOPS_LEVEL)*_Point);
      double ask=SymbolInfoDouble(_Symbol,SYMBOL_ASK);
      double bid=SymbolInfoDouble(_Symbol,SYMBOL_BID);
      double sl=NormalizeDouble(stops,_Digits);
      double tp=NormalizeDouble(Reward_Risk*(stops+ask-bid),_Digits);
      double SL=NormalizeDouble(bid-sl,_Digits);
      double TP=NormalizeDouble(ask+tp,_Digits);
      if(!Trade.Buy(Lot,_Symbol,ask,SL,TP,"New Strategy"))
         Print("Error of open BUY ORDER "+Trade.ResultComment());
     }
   if(macd_data[0]<=(-0.0015) && macd_data[0]>=(-0.0035) && (cho_data[1]-cho_data[0])>0 && (cci_data[1]-cci_data[0])<0)
     {
      if(PositionSelect(_Symbol))
        {
         switch((int)PositionGetInteger(POSITION_TYPE))
           {
            case POSITION_TYPE_SELL:
              if(PositionGetDouble(POSITION_PROFIT)<=0)
                 return;
              break;
            case POSITION_TYPE_BUY:
              Trade.PositionClose(_Symbol);
              break;
           }
        }
      last_deal=cur_max;
      double stops=MathMax(2*atrs[0],SymbolInfoInteger(_Symbol,SYMBOL_TRADE_STOPS_LEVEL)*_Point);
      double ask=SymbolInfoDouble(_Symbol,SYMBOL_ASK);
      double bid=SymbolInfoDouble(_Symbol,SYMBOL_BID);
      double sl=NormalizeDouble(stops,_Digits);
      double tp=NormalizeDouble(Reward_Risk*(stops+ask-bid),_Digits);
      double SL=NormalizeDouble(ask+sl,_Digits);
      double TP=NormalizeDouble(bid-tp,_Digits);
      if(!Trade.Sell(Lot,_Symbol,bid,SL,TP,"New Strategy"))
         Print("Error of open SELL ORDER "+Trade.ResultComment());
     }
   return;
  }
Full code of EA is provided in attachment.
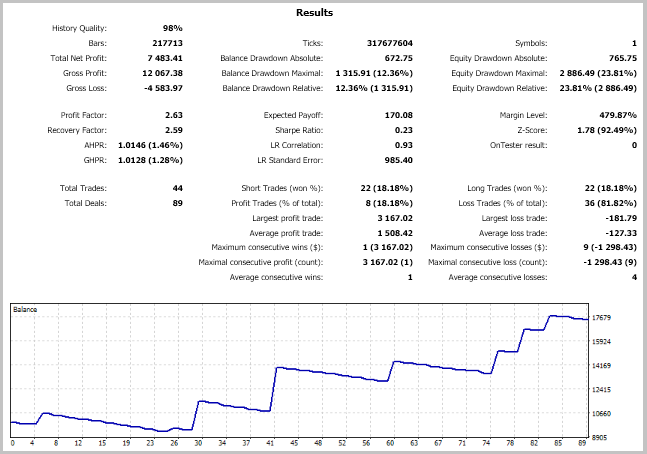
After performing the EA, we can test our strategy. In order to abstract from “matching the strategy to the period”, extend the period tested: test the strategy from 1/01/2015 to 1/12/2017. The initial capital of testing is USD 10,000, trade size - 1 lot.

According to testing results, the EA demonstrated profit of 74.8% at maximal balance drawdowns of 12.4% and by equity - of 23.8%. Totally, there were made 44 trades (22 short positions and 22 long ones). The share of profitable positions constitutes 18.2% and is equal both for short and long positions. Such low percentage of profitable positions is stipulated by the use of high ratio of expected profit to risk (15:1) and leaves room for further strategy improvement.
Conclusion
The article demonstrates the technology for trading strategy creation “with a blank sheet” using a method of resolving entries into indicators. The resulted strategy is able to generate profit for a prolonged period which is proved by testing during three years. Notwithstanding the fact that when creating the strategy indicators from standard MetaTrader package were used, signals for making trades are far from those described in literature for taken indicators. The suggested technology enables creative approach to use indicators in trading strategies and is not limited by the taken indicators. You may use any user indicators and variants for assessing quality of their signals.
References
Programs used in the article:
| # |
Name |
Type |
Description |
|---|---|---|---|
| New_Strategy_Gizlyk.zip | |||
| 1 | NewStrategy1.mq5 | EA | EA for implementing the first stage of strategy creation |
| 2 | NewStrategy2.mq5 | EA | EA for implementing the second stage of strategy creation |
| 3 | NewStrategy3.mq5 | EA | EA for implementing the third stage of strategy creation |
| 4 | NewStrategy4.mq5 | EA |
EA for implementing the fourth stage of strategy creation |
| 5 | NewStrategy_Final.mq5 | EA |
Strategy testing EA |
| 6 | DealsToIndicators.mqh | Class library | Class for working with indicator classes |
| 7 | Deal.mqh | Class library | Class for saving information about a trade |
| 8 | Value.mqh | Class library | Class for saving data on indicator buffer state |
| 9 | OneBufferArray.mqh | Class library | Class for saving data history of one-buffer indicator |
| 10 | StaticOneBuffer.mqh | Class library | Class for collecting and analysis of one-buffer indicator statistics |
| 11 | ADXValue.mqh | Class library | Class for saving data on ADX indicator state |
| 12 | ADX.mqh | Class library | Class for saving data history of ADX indicator |
| 13 | StaticADX.mqh | Class library | Class for collecting and analysis of ADX indicator statistics |
| 14 | AlligatorValue.mqh | Class library | Class for saving data on Alligator indicator state |
| 15 | Alligator.mqh | Class library | Class for saving data history of Alligator indicator |
| 16 | StaticAlligator.mqh | Class library | Class for collecting and analysis of Alligator indicator statistics |
| 17 | MACDValue.mqh | Class library | Class for saving data on MACD indicator state |
| 18 | MACD.mqh | Class library | Class for saving data history of MACD indicator |
| 19 | StaticMACD.mqh | Class library | Class for collecting and analysis of MACD indicator statistics |
| Common.zip | |||
| 20 | NewStrategy1_Report_1to1_2016-17.html | Internet file | Analytical charts of the first stage of strategy creation, profit/risk = 1/1 |
| 21 | NewStrategy1_Report_15to1_2016-17.html | Internet file | Analytical charts of the first stage of strategy creation, profit/risk = 15/1 |
| 22 | NewStrategy2_Report_1to1_2016-17.html | Internet file | Analytical charts of the second stage of strategy creation, profit/risk = 1/1 |
| 23 | NewStrategy2_Report_15to1_2016-17.html | Internet file | Analytical charts of the second stage of strategy creation, profit/risk = 15/1 |
| 24 | NewStrategy3_Report_1to1_2016-17.html | Internet file | Analytical charts of the third stage of strategy creation, profit/risk = 1/1 |
| 25 | NewStrategy3_Report_15to1_2016-17.html | Internet file | Analytical charts of the third stage of strategy creation, profit/risk = 15/1 |
| 26 | NewStrategy4_Report_1to1_2016-17.html | Internet file | Analytical charts of the fourth stage of strategy creation, profit/risk = 1/1 |
| 27 | NewStrategy4_Report_15to1_2016-17.html | Internet file | Analytical charts of the fourth stage of strategy creation, profit/risk = 15/1 |
| 28 | NewStrategy_Final_Report.html | Internet file | Strategy testing report |
Translated from Russian by MetaQuotes Ltd.
Original article: https://www.mql5.com/ru/articles/4192
Warning: All rights to these materials are reserved by MetaQuotes Ltd. Copying or reprinting of these materials in whole or in part is prohibited.
This article was written by a user of the site and reflects their personal views. MetaQuotes Ltd is not responsible for the accuracy of the information presented, nor for any consequences resulting from the use of the solutions, strategies or recommendations described.
 Resolving entries into indicators
 Testing patterns that arise when trading currency pair baskets. Part II
 Using the Kalman Filter for price direction prediction
- Free trading apps
- Over 8,000 signals for copying
- Economic news for exploring financial markets
You agree to website policy and terms of use
Interesting article.
Thanks.
Interesting article, thanks.
Important for the analysis are good historical price data. Where do you get the historical price data, from a broker?
Hi,
I really like this article. I do believe that backtesting is very important. But few factors keep spinning in my head.
I can't see how long positions were opened. What was initial capital (in those abstract units)? What position size was set?
It would add to the strategy some maturity as things that I have asked directly impact potential of any strategy- commissions.
Each time you rolling over the day, you pay commission based on possition size.
And profit of 1000 or 10000 may be huge or misserable depending on starting capital.
I would appreaciate your reflection to this. Maybe I missed it somewhere in article.