Смотри обучающее видео по маркету на YouTube
Как купить торгового робота или индикатор
Запусти робота на
виртуальном хостинге
виртуальном хостинге
Протестируй индикатор/робота перед покупкой
Хочешь зарабатывать в Маркете?
Как подать продукт, чтобы его покупали
Платные технические индикаторы для MetaTrader 5 - 37
MT4 Version
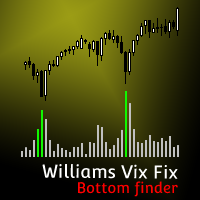
Williams Vix Fix MT5 Need help trying to time the bottoms in the market? Williams Vix Fix MT5 is based on the volatility of the market and grants a huge support for finding out when a correction is comming to its end. TRY IT FOR FREE NOW! Williams Vix Fix MT5 derivates from Larry Williams's VixFix indicator addapted for fitting every asset class . VIX reprensents the fear and greed in the market based on its volatility. A high VIX value shows fear in the market, this is usually a g

Your Pointer - это не обычный форекс канал. Этот коридор выстраивается на основании анализа нескольких свечей, начиная от последней, в результате чего определяются экстремумы исследуемого промежутка. Именно они и создают линии канала. Он как и все каналы имеет среднюю линию а также линию максимума и минимума. Этот канал стоит внимания из-за своего необычного поведения. Применение индикатора Your Pointer позволяет трейдеру вовремя отреагировать на выход цены за границы установленного для нее кан

Я хочу еще раз, что свет клином на всех индикаторов не сошелся. Как бы вы упорно не искали, вы все равно не найдете индикатор, который всегда и во всех условиях будет вам давать исключительно прибыльные сигналы. Как вы видите, все достаточно просто, и вам даже по сути, ничего и анализировать не надо. В целом, я бы сказал, что индикатор Signal No Problem может стать прекрасной помощью для создания своей торговой системы. Само собой, что только лишь по стрелочкам торговать не надо, добавить какие

Фундаментальный технический индикатор,который позволяет дать оценку текущей рыночной ситуации,чтобы в войти в рынок выбранной валютной пары в тренд и с минимальным риском.
Данный индикатор был создан на основе оригинальных индикаторов поиска экстремумов, индикатор хорошо подходит для определения разворота или большого резкого рывка в одну из сторон благодаря ему вы будете знать когда такое произойдет он вас уведомит появлением точки синего цвета на покупку красного на продажу.
Использует в
KF CROSS 3MA
This indicator show the collision points of moving averages in a separate window. so we will have a solitude chart. Features indicator: Show alert in Meta Trade Send notification to mobile Adjustable 3 MA (Fast-Middle-Slow) Can be used on all symbols Can be used in all time frames
Attention, the application does not work in the strategy tester
You can download the Demo version on the comments page : https://www.mql5.com/en/market/product/81152?source=Site
or cotact us : ht
Calculated Trend - трендовый индикатор создает вдоль графика двухцветные точки соединенные между собой линиями. Это трендовый индикатор, представляет из себя алгоритмический индикатор. Прост в работе и понимании при появлении синего кружка необходимо покупать, при появлении красного - продавать. Индикатор хорошо указывает точки начала тренда и его завершения или разворота. Работа на валютном рынке Форекс без трендовых индикаторов практически не возможна. Приминяя в работе индикатор Calculated T

Indicator basic idea is buy strong currency and sell weak currency. If A/B currency pair is in an uptrend, it shows if it is due to A strength or B weakness.On these signals one can choose the most optimal pair to trade. You can use Currency Power System for pattern trading as well, among basic patterns which can be used are: cross trend break divergencies So much for theory. I searched for a ready-made indicator (Currency Strength) to support my trade but did not find one. Well. I have to wr

Перед вами индикатор, который совершит революцию в торговле синтетическими индексами BOOM на торговой платформе Deriv mt5.
Бог Спайк Бум .
Основные характеристики:
Работает только в индексах BOOM. Есть трендовый фильтр. Отправляйте оповещения только тогда, когда рынок растет. Звуковые оповещения. Вы можете отправлять оповещения на мобильный.
Как пользоваться:
Применять во временных диапазонах m1 и m5. Дождитесь звукового оповещения. Проанализируйте, есть ли сильный тренд или
Основная цель данного индикатора это определение моментов входов и выходов из сделок, поэтому индикатор Calc Revers отображат только линию тренда и точки входа, тоесть отображает показывают места входа в рынок.
Несмотря на всю видимую простоту индикатора, внутри у него сложные аналитические алгоритмы, при помощи которых система определяет моменты входов. Индикатор дает точные и своевременные сигналы на вход и на выход из сделки, которые появляются на текущей свече.
Пользоваться индикат

An customize Indicator by which you can have Triple moving averages at close prices and send push notification on each crossing. This indicator is especially useful when you are doing manual trading. Notes: Cation: forex trading is a very risky business,... don't invest the money you cannot bear to lose. the probability of losing is high ... more high aaaand exponentially high.... something like EMA enjoy losing with us...

Indicador que calcula o volume real e a porcentagem da agressão vencedora num determinado período de tempo. Podendo o usuário escolher entre as opções : 3 vezes por segundo ; 2 vezes por segundo ; 1 vez por segundo ; 1 vez a cada 2 segundos ; Exemplo 1: Se o usuário optar pela opção 2 vezes por segundo, o indicador vai mostrar na tela 2 vezes em um segundo a quantidade de contratos negociados (volume real) e quantos por cento a agressão vencedora foi superior a perdedora nesse período. Ou seja,

This is a multi-symbol and multi-timeframe table-based indicator designed for a candlestick patterns detection with 46 patterns for META TRADER 5. Each formation has own image for easier recognition. Here you find most popular formations such as "Engulfing", "Hammer", "Three Line Strike", "Piercing" or Doji - like candles. Check my full list of patterns on my screenshots below. Also you can not only switch all bearish or bullish patterns from input, but also select formation for a specified symb

Интеллектуальный алгоритм индикатора Godfather с точностью определяет тренд, отфильтровывает рыночный шум и генерирует входные сигналы и уровни выхода. Индикатор поможет в поиске точек входа при анализе графика цены. Программа сначала получает «снимок» графика, затем анализирует его. Результаты сообщаются трейдеру в виде сигналов. Основная цель данного индикатора это определение моментов входов и выходов из сделок, поэтому индикатор отображает только линию тренда и точки входа, тоесть отображае

Основное применение индикатора Rwanda заключается в генерации сигналов на покупку и продажу. Отображает сигналы индикатор Rwanda на графике функции цены используя математический подход. Индикатор определяет долгосрочный и краткосрочный тренд. Наилучший результат дает сочетание индикатора с фундаментальными новостями, он может выступать в качестве фильтра новостей, то есть показывать насколько реагирует рынок на ту или иную новость.
При помощи этого индикатора можно прогнозировать будущие зна
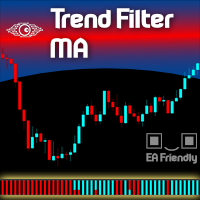
One of the best tools category for an Expert Advisor is the Filtering System . Using a filter on your entries will take your metrics to the good side. And even when you trade manually a filtering system is more than welcome. Let us present a commonly used filtering system based on Exponential Moving Averages - in fact, you can choose the type of the MAs as you wish and also mix them all up - we called this indicator Filter Trend MA . We present this indicator as a colored strip you can use at th

Основной целью индикатора Deathly является оценка рынка. Красные точки указывают на то, что в приоритете должно быть открытие позиций на SELL. Синий цвет говорит том, что настало время для сделок на BUY. Пользоваться индикатором очень удобно и легко. Индикатор является универсальным. Его применяются на любых временных интервалах. Использовать индикатор можно для торговли разными активами. Инструмент прекрасно подходит для торговли на Forex. Его активно применяют для трейдинга на сырьевых, товар

С помощью алгоритма форекс индикатора Elephant, вы можете достаточно быстро понять, какая именно тенденция в данный момент развивается на рынке. Индикатор указывает на графике основную тенденцию в текущий момент на рынке. Смена направления, с точки зрения рыночного фундамента, означает смещение торгового интереса в сторону продавцов или покупателей.
Если не учитывать спекулятивные броски, которые в результате не сказываются на общем тренде, то моменту реального «перелома» всегда предшествует

Преимущество работы по сигнальному индикатору Special Agent заключается в том, что трейдеру не нужно самостоятельно проводить технический анализ графика. Определение рыночного тренда является важной задачей трейдеров, а инструмент выдает уже готовые сигналы в виде направленных стрелок. Данный инструмент является стрелочным (сигнальным).
Special Agent это индикатор тренда, инструмент для технического анализа, который помогает определить точное направление тренда: или восходящее, или нисходящ

Прекрасно дополнит актуальной информацией ваш работающий советник или торговлю вручную.
Предусмотрено звуковое оповещение превышения установленных лимитов прибыли и убытка открытых ордеров SELL и BUY. Причем для каждой валютной пары EURUSD, GBPUSD, XAUUSD, и остальных выводятся различные звуковые оповещения на английском языке.
Показатели выводятся на специальной панели на графике с момента активации индикатора: Прошедшее время Накопленная прибыль
Текущая прибыль Максимальная просадка Текуща

Индикатор Bridge отображает на графике сигналами потенциальные точки на вход (точки абсолютного разворота по тренду).
Алгоритм форекс индикатор Bridge был создан на основе оригинальных индикаторов поиска экстремумов, индикатор хорошо подходит для определения разворота или большого резкого рывка в одну из сторон благодаря ему вы будете знать когда такое произойдет он вас уведомит появлением точки синего цвета на покупку красного на продажу. Индикатор по определенному алгоритму квалифицирует на
New to Binary Options Trading? You are not able to win while trading binary options? Need help with your trading? You have come to the right place! This indicator provides Put (SELL) and Call (BUY) signals for binary options on the M1-M15 timeframes.
Advantages Ability to easily recognize impulsive moves. Effective and flexible combination to different trading strategies. Advanced statistics calculation following the entry point. Signals strictly on the close of a bar. Works in all symbols and
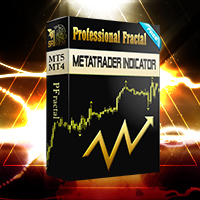
This indicator is based on the same famous fractal indicator with a slight difference:
MetaTrader version 4 click here
Advantages:
Works on all instruments and time series,
Does not redraw its results,
Comparison depth is adjustable,
Works well with any popular strategy,
Adjust the power of fractals
Input settings:
Number of comparisons - The number of candles that each side selects for comparison.
Marker distance from the candlestick
You

This is an advanced Trend Indicator, specifically designed to detect market trends, This MT5 indicator can be used on any symbol . It draws two types of Clouds Buyers & Sellers. A New Trend is then plotted in a break from an older trend. This Powerful indicator is an excellent tool for scalpers or swing Traders. it does not redraw nor Repaint, it's Most reliable when applied on higher timeframes... Tried and Tested on Volatility 75 Index https://t.me/ToyBoyLane
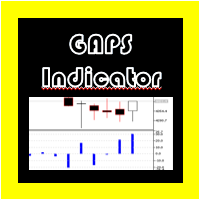
Индикатор GAPS для Метатрейдера 5
Для некоторых стратегий, используемых в индексах, акциях и других активах, обычно измеряется GAP каждой свечи, но если мы хотим сделать это вручную, это может привести к ошибкам в расчетах.
По этой причине был создан «Индикатор GAP», который автоматически показывает значение PIPS каждого из GAPS, представленных между каждой из свечей, и генерирует сигнал тревоги при их появлении, если опция активирована.

(Автоперевод) Большинству трейдеров известен знаменитый японский индикатор Хейкин-Аши , созданный в 1700-х годах Мунехисой Хоммой . Иногда его пишут Heiken-Ashi , но его значение остается прежним, а именно «средний бар» по-японски. Это реализация очень известного индикатора Heikin Ashi , но с несколькими дополнительными функциями. Во-первых, он позволяет взвешивать его значения по объему , будь то объем тиков , реальный объем или псевдообъем на основе истинного диапазона. Основное преимущество з

This indicator simplifies your entry zones by displaying the areas where you can plan your entry that potentially could give you high risk/reward ratios. Other than picking the most optimal entry points, the Hot Zone indicator can act as your typical support/resistance indicator for pullbacks for all timeframes. You can use this indicator as the only trading indicator or use it with another indicator for reentry purposes. Besides, when using Hot Zones, the risk/reward ratio should be well abov

Indicator that shows you at any time the current number of closed deals as well as profit and loss totals of the closed deals of the account that you're logged into for a configurable period.
To do this, it is best to load Deals and "Complete history" in the account history in the terminal and then enter the desired period in the indicator (e.g. 2022.01.01-2023.01.01 would be for calendar year 2022).
Input options:
- Period (Attention: corresponding data must be loaded into the account h
This indicator is based on ParabolicSAR. This indicator does not change the trend easily and does not change the trend until it receives a clause and approval. This indicator can be used for trail stop or trend detection.
MT4 Version
benefits:
Works on all instruments and time series,
Does not redraw its results,
Comparison depth is adjustable,
Works well with any popular strategy,
The power of the areas is adjustable,
We assure you that we we

Индикатор - HotKeys позволяет сделать работу в терминале МТ5 более комфортной Возможности индикатора:
- Вызов создания объекта на графике быстрыми клавишами
- Включение/отключение автопрокрутки
- Быстрое переключение между основными пользовательскими шаблонами Предустановленные быстрые клавиши:
- Прямоугольник - Q
- Фибо - E
- Горизонтальный уровень - R
- Отрезок - T
- Автопрокрутка - A
Вы можете назначить другие быстрые клавиши (только заглавные буквы английского алфавита) Важно
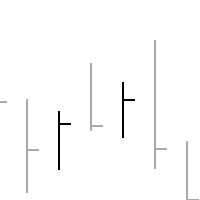
Данный индикатор выполняет единственную задачу - отображает график в виде HLC-баров (бары без цен открытия). Также данные бары имеют две особенности: цвет бара определяется путем сравнения цены закрытия текущего бара с ценой закрытия предыдущего бара, таким образом не происходит путаницы из-за ценовых разрывов (гэпов). Пример подобной ситуации показан на скриншотах (стандартные свечи сравниваются с представленными барами); цвета баров и их толщину можно редактировать.

Hello Traders
I have created this indicator to Catch SPIKES on Crash1000, Crash500 and Crash300. Follow the below mention instruction for better Result
1. When Red arrow pop up on the Chart, Take a Sell entry
2. Stay in trade until price break below from entry
3. Do not hold trades after all trades went in Blue
4. Keep adding position until spike cross below from intial entry
See Example for more assistance

Индикатор помогает зайти в сделку по тренду, при этом, после некоторой коррекции. Он находит сильные трендовые движения валютной пары на заданном количестве баров, а также находит уровни коррекции к этому тренду. Если тренд достаточно сильный, а коррекция становится равной заданной в параметрах, то индикатор сигнализирует об этом. Можно устанавливать разные значения коррекции, лучше подходят значения 38, 50 и 62 (уровни Фибоначчи). Кроме этого, можно настраивать минимальную длину тренда, колич

Система для визуализации популярных шаблонов ценовых формаций. После подключения индикатор автоматически отобразит на графике следующие формации: Пиноккио бар (“пинбар”) - свеча с небольшим телом и длинным “носом”, очень известный разворотный шаблон; Внутренний бар - свеча, диапазон которой лежит внутри диапазона предыдущей свечи. Такая формация представляет неопределённость рынка; Внешний бар - свеча, диапазон которой превышает диапазон предыдущей свечи. Такая формация представляет неопре

This simple, yet powerful indicator is very good way to determine actual S/R levels. It's main purpose is making your overview on markets much better.It has built-in arrow signal system, which should be used along with MT indicators for best results.Just try it.
Recommended MT indicators to use along:
Bollinger Bands (default) RSI (period 3, levels 10/90)

Добавьте этот индикатор на график и установите ExtDepth Setting ZigZag.
Он дает мгновенное оповещение, когда цена касается линии тренда Верхнего, Нижнего или Среднего канала.
Функции :
-Включить / отключить оповещения в верхней, нижней или средней строке - Добавить паузу после оповещения в секундах - Приостановить или возобновить канал тренда с помощью кнопки на графике - Добавьте ранние оповещения, добавив пункты в поле ввода, например, цена ETH составляет 2900,25, здесь цифры 25 - это «т
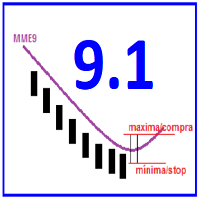
Translate from "Brazil"("PT-BR") Baseado no Setup 9.1 de Larry Williams, Wdi 91 se Adequa a Qualquer Média com o Mesmo Gatilho de Entrada. Experimente.
Como funciona?
Nesse indicador o sinal de compra ou venda acontece quando o fechamento da vela vira a média móvel(Por padrão é MME de 9 períodos) e fica do outro lado da média.
Como usar?
A proposta por Larry Williams é entrar no trade com uma ordem stop um tick acima da máxima do candle com sinal de compra, colocando a ordem de stop loss

BeST Swing Strategy MT5 is a Metatrader indicator based on the corresponding Jim Berg's work about volatility as described in his article "The Truth About Volatitlity" (TASC 2/2005).The indicator consists of 2 channel lines deriving as (MA+/- times the ATR) and can be used as a standalone trading system.The outlier prices of the Market as of the indicator's values can be used for producing Entry and Exit Signals.
Advantages of the indicator
== Uses 2 Swing Strategies
== Never repaints it
Bollinger Band is one if the most useful indicators if used properly. Trend Guard used the parameters based on Bollinger to create a tool that can help traders enter trades at most optimal level. The indicator is useful to all traders since it checks for retracements and changing trend direction. With this indicator, you get the opportunity to open trades early and also lock your profits based on the dotted trend lines that form after a certain level of Bollinger band. We have simplified the ind
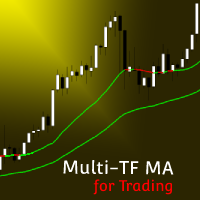
MT4 Version Multi Timeframe MA MT5 Multi Timeframe MA MT5 is an indicator that offers the representation of up to 3 MAs with different Periods and Timeframes. This allows the user to reprensent in one chart and timeframe information coming from other timeframes and get notified as any of the MAs crosses another one. Multi Timeframe MA is the first indicator in the market that offers Multi Timeframe interactions and a high customization level from up to 7 different MA types (SMA, EMA, WMA, Smooth
KT Bollinger Shots works using a striking blend of the slingshot pattern and the mean-reversion phenomenon applied to financial markets.
In addition, a mathematical algorithm is used with variable deviation to fine-tune the indicator's signals on a different level.
Winning Trade: After a signal, if price touches the middle band in profit, it is considered a winner. Losing Trade: After a signal, if price touches the opposite band or touches the middle band in loss, it is considered a loser.

Introduction to Support Resistance Risk Management Support Resistance is the most trusted technical analysis. However, the risk management for the support and resistance is not practiced often. Hence we provide one effective risk managment method for the support and resistance trader. In the book: Scientific Guide To Price Action and Pattern Trading (Wisdom of Trend, Cycle, and Fractal Wave), how to use Support Resistance is described as well as Fibonacci Analysis, Harmonic Pattern, Elliott Wave
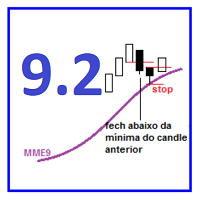
Translate from "Brazil"("PT-BR") Baseado no Setup 9.2 de Larry Williams, Wdi 92 se Adequa a Qualquer Média com o Mesmo Gatilho de Entrada. Experimente.
Como funciona? Nesse indicador o sinal de compra ou venda acontece quando com a continuidade da média móvel(Por padrão é MME de 9 períodos).
Para compra tanto o fechamento quando a abertura da vela precisam estar acima da média, o fechamento precisa ser menor que a mínima anterior e a média precisa estar subindo.
Para venda tanto o fechament
PAX BDB Trade Chaos system of Bill Williams (Bearish/Bullish divergent bar). One of the signals of the "Trade Chaos" system of Bill Williams. (First wiseman)
When bar moving away from the "Alligator" indicator and there is divergence on the Awesome Oscillator indicator, it shows a potential point of movement change.
It is based on the opening/closing of the bar, the position relative to the previous ones, the Alligator and AO.
When trading, the entrance is at the breakthrough of the bar(sh

The FX Stewards EA Signals Alert Indicator works with every trading instrument(including synthetic indices). The signals indicator assists with choosing which instrument to trade and the direction to take(follow the trend - the trend is your friend), making it easer for you to enter, re-enter or exit a trade with confidence(you're, however, still required to confirm entry before entering as it might be a false breakout - you'll get multiple contradicting alerts in this instance(mainly in a rangi

Definition : A Market Profile is an intra-day charting technique (price vertical, time/activity horizontal). Market Profile is best understood as a way to see order in the markets. Market Profile was a way for traders to get a better understanding of what was going on, without having to be on the trading floor. The current indicator is developed based on Easy-to-Use architecture including a wide range of visual settings.
Major Features of Indicator : Various Views of Market Profile The indica

Индикатор Boom and Crash Spike Detector закодирован на основе продвинутой стратегии, в первую очередь для обнаружения бумов и падений в ценах. Сложные алгоритмы были имплантированы для обнаружения с высокой вероятностью подъемов и обвалов цен. Он предупреждает о возможных фазах стрелы или аварии: Фаза бума: когда цена растет слишком быстро. Фаза краха: когда цена падает слишком быстро.
ПРЕДЛОЖЕНИЕ ОГРАНИЧЕННОЕ ПО ВРЕМЕНИ: Индикатор доступен всего за 30 $ и пожизненно.
Ключевая особенность
This indicator is mainly used for my SuperDonchain EA but can also be used as a simple indicator. It draws a donchain channel in the chart window. It has various setting options which affect the graph. Furthermore, the colors of the graph can be adjusted. Simply copy it into the indicators folder and drag it from there into the chart window https://www.mql5.com/de/market/product/78025?source=Unknown%3Ahttps%3A%2F%2Fwww.mql5.com%2Fde%2Fmarket%2Fmy
This indicator is mainly used for my SuperDonchain EA but can also be used as a simple indicator. It draws a simple supertrend on the chart window. It has various setting options which affect the graph. Furthermore, the colors of the graph can be adjusted. Simply copy it into the indicators folder and drag it from there into the chart window. https://www.mql5.com/de/market/product/78025?source=Unknown%3Ahttps%3A%2F%2Fwww.mql5.com%2Fde%2Fmarket%2Fmy

The indicator draws lines (with line objects) to the close prices of the last closed bars, on selected timeframes. Parameters
Close line 1 close price timeframe - timeframe of the 1st close price Close line 1 color - color of the 1st close price Close line 1 width - width of the 1st close price Close line 1 style - style of the 1st close price Close line 1 max count - the maximum number of lines plotted for the 1st close price, considering the selected timeframe in Close line 1 timeframe parame
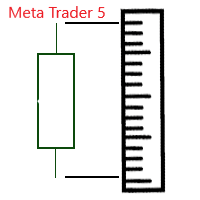
Индикатор отображает размер бара и его направление. ---------------------------------------- Цвета гистограммы: * Красный - Медвежий бар.
* Зелёный - Бычий бар.
* Серый - Цена открытия и цена закрытия равны. * Синяя линия - скользящая средняя.
---------------------------------------- Параметры: - Type of Calculation - Тип расчёта ( High - Low, Open - Close ) - Moving Avarage - Период скользящей средней - Method for MA - Метод усреднения скользящей средней
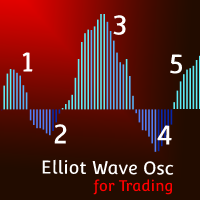
MT4 Version Elliot Wave Oscillator MT5 Elliot Wave Oscillator MT5 is an indicator designed to support Elliot Wave counts. The default settings help filtering out the noise in the market allowing a clear perception for the waves counts in differnt timeframes. Elliot Wave Oscillator high customization level allows the you to optimize this indicator to your personal preferences. Shorter Periods and faster reactive MAs will provide more infomation but will require a higher level of experience for a

Индикатор тренда волатильности индекса.
Основные характеристики:
Он используется только для синтетических индексов в брокерах Binary или Deriv, которые одинаковы. Есть трендовый фильтр. Он имеет звуковое оповещение, чтобы предупредить о возможном падении цены. Он может отправлять вам мобильные оповещения, если вы поместите его на VPS. Он настроен на алгоритм L566b12, который разработан для повышения эффективности.
Как пользоваться индикатором
Он работает в темпоральности М1. Тр

TrendHunt is an indicator focus on higher timeframe (H1 and Above) It using breakout strategy, plus MA for filter. Check for Support, Resistance and News before every entry to increase the success rate.
Parameters Moving Average Period - 200 Moving Average Price - Closed Price Entry Period - 20 (Breakthrough 20 High for Long, 20 Low for short) Stop Period - 10 (cross over 10 low for exit long)

Indicator Constant TF Moving Average basically is the same Moving Average indicator, but differently it always shows the price values of chosen time frame. Also, number of periods to show can be selected. Indicators purpose is to use it as support and resistance level in smaller time frames than selected in Input menu. How it looks like you can see in screenshots and video. ---------Main settings-------- Timeframe - choose time frame from dropdown menu Number of periods to show - enter the integ

Этот индикатор зон спроса и предложения рисует зоны на графике и отправляет оповещения, когда цена достигает или пробивает зону. Его также можно использовать для получения предупреждений о регулярных двойных вершинах/основаниях вместо зон. Можно использовать фильтры RSI, объема и дивергенции, чтобы отфильтровать только самые сильные сетапы. В сочетании с вашими собственными правилами и методами этот индикатор позволит вам создать (или усовершенствовать) собственную мощную систему. Этот индикатор

The indicator, Big Candle Detect , is based on ATR and Volume to detect candlesticks of buying and selling strength, which is represented through an oscillator indicator. With this indicator you will be able to identify the lateral market, providing better entries according to your strategy.
Big Candle Detect highlights candles with brighter colors when the condition is found, making it easier to identify, in addition to being fully compatible for automation in your EA.
SETTINGS
ATR P
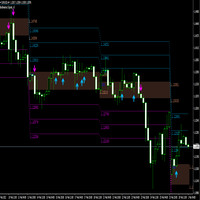
A breakout refers to when the price of an asset moves above a resistance area, or moves below a support area . Breakouts indicate the potential for the price to start trending in the breakout direction. For example, a breakout to the upside from a chart pattern could indicate the price will start trending higher. The indicator works with arrows in case of breakthrough, you also have a level of 1 tp, a level of 2 tp, a level of 3 tp. For more information, welcome to our Telegram Group. https:
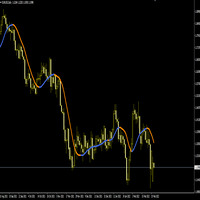
The Hull Moving Average (HMA) attempts to minimize the lag of a traditional moving average while retaining the smoothness of the moving average line. Developed by Alan Hull in 2005, this indicator makes use of weighted moving averages to prioritize more recent values and greatly reduce lag. The resulting average is more responsive and well-suited for identifying entry points. For more information, welcome to our Telegram Group. https://t.me/InfinXx
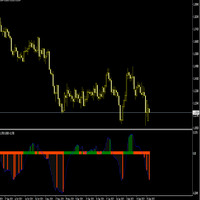
The Slope indicator measures the slope of a linear regression , which is the line of best fit for a data series. A 20-period Slope, therefore, measures the slope of a 20-day linear regression. ... In general, a positive slope indicates an uptrend, while a negative slope indicates a downtrend. How do you use slope Indicator?
By applying the slope indicator to both the price chart and the price relative , chartists can quantify the price trend and relative performance with one indicator. A po

About AIntel
Is there are reason you select RSI 14 or 21? Is there a reason you select EMA 25? Is there a reason you pick these periods for these and any other indicators? Those numbers might have worked 10 or 20 years ago. They might be working for traiding certain currency pair in a certain timeframe.. But they DO NOT give you the best profit and outcome at all times all pairs all trades! AInter is "automated inteligence" series indicators that optimize automatically for best profit so you do

Secreto - фундаментальный технический индикатор,который позволяет дать оценку текущей рыночной ситуации, чтобы в войти в рынок выбранной валютной пары в тренд и с минимальным риском. Использует в своей основе процесс выявления скорости изменения роста цены и позволяет найти точки входа и выхода с рынка. Индикатор можно использовать с оптимальным коэффициентом риска к прибыли, показывает удачные сигналы. Использует два параметра для настроек. Показывает благоприятные моменты для входа в рынок ст

Reservoir - индикатор разворота, является частью специалньой категории инструментов. Индикатор не только анализирует ценовое движение, но и указывают точки возможных разворотов. Это способствует быстрому и оптимальному открытию ордеров на покупку или продажу (в зависимости от текущей ситуации). При этом обязательно учитываются исторические данные анализируемого актива. Именно корректное выполнение таких действий во многом помогает трейдерам вовремя принять правильное решение и получить профит.

Обозреватель паттернов для паттерна треугольника, такого как симметричный треугольник, асимметричный треугольник или прямоугольный треугольник, паттерна клина, такого как восходящий клин или падающий клин, паттерна расширения и канала тренда.
Этот индикатор исследует исторические паттерны, а также текущие паттерны. Это лучший индикатор для тех, кто пытается сэкономить время, вручную рисуя линию тренда или треугольник, и хочет использовать это для автоматического анализа построения лучших патт

Salinui - Стрелочный трендовый индикатор, без запаздывания и перерисовки, применяется трейдерами в трендовых стратегиях в торговле на финансовых рынках (Форекс, CFD, бинарные опционы). Индикатор предсказывает наиболее вероятное краткосрочное движение цен на основе сложных математических расчетов. Одна из самых больших проблем, с которыми сталкиваются трейдеры, - это поиск подходящей для себя торговой системы. Этот индикатор создан для обнаружения тенденций движения цены и позволяет быстро опред

Стрелочный технический индикатор без перерисовки Vendetta на рынке Форекс способен давать подсказки с наименьшими погрешностями. Индикатор при изменении цены не перерисовывает свои сигналы. Он сочетает в себе несколько фильтров, отображая на графике стрелки входа в рынок.
Каждый рост и каждое падение отражается и на вашем эмоциональном состоянии: надежда сменяется страхом, а когда он проходит, снова появляется надежда. Рынок использует ваш страх для того, чтобы не дать вам воспользоваться си
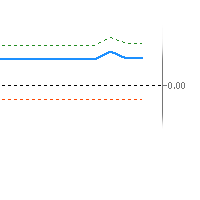
An imbalance indicator that marks imbalance on the chart with zones and gives the amount of imbalance as an oscillator value. There's one line for the amount of short imbalance, one line for the long imbalance and the combined imbalance as a thicker line. The combined imbalance goes above 0 if there's more imbalance above than below the current price and vice versa. The blue thicker line, shows (imblance above - imbalance below). The greeen dotted line shows imbalance above The red dotted line s
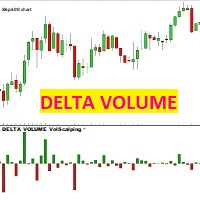
ДЕЛЬТА ОБЪЕМА Volscalping Этот индикатор для каждой ценовой свечи рисует дельта-свечу, которая представляет собой разницу между купленными и проданными контрактами. Свеча будет красной и отрицательной, если контракты, торгуемые по цене бид (проданы), превышают контракты по аску, и наоборот, свеча будет зеленой и положительной, если контракты, торгуемые по аск (покупаются), превышают контракты по ставке.
ВНИМАНИЕ: Индикатор работает только с брокерами, которые обеспечивают реальный поток рыно
The indicator, Support and Resistance Detect Signal automatically detects support and resistance levels and trend lines, emitting a signal whenever the condition is met, as configured.
It reads support and resistance drawn manually or automatically built into the chart by other external indicators.
Note: Support and Resistance Detect Signal is compatible with almost all external indicators that draw on the chart, support and resistance levels, in addition to trend lines.
Discover our Elit
The indicator, Support and Resistance Detect Signal automatically detects support and resistance levels and trend lines, emitting a signal whenever the condition is met, as configured.
It reads support and resistance drawn manually or automatically built into the chart by other external indicators.
Note: Support and Resistance Detect Signal is compatible with almost all external indicators that draw on the chart, support and resistance levels, in addition to trend lines.
Discover

The indicator "JAC Trend Color Candle" for Meta Trader 5, was created to visually facilitate the trend for the trader. It is based on three parameters, which identifies the uptrend, downtrend and non-trending market. The colors are trader-configurable, and the average trader-configurable as well. trend parameters cannot be configured as they are the indicator's differential.
MetaTrader Маркет предлагает каждому разработчику торговых программ простую и удобную площадку для их продажи.
Мы поможем вам с оформлением и подскажем, как подготовить описание продукта для Маркета. Все продаваемые через Маркет программы защищаются дополнительным шифрованием и могут запускаться только на компьютере покупателя. Незаконное копирование исключено.
Вы упускаете торговые возможности:
- Бесплатные приложения для трейдинга
- 8 000+ сигналов для копирования
- Экономические новости для анализа финансовых рынков
Регистрация
Вход
Если у вас нет учетной записи, зарегистрируйтесь
Для авторизации и пользования сайтом MQL5.com необходимо разрешить использование файлов Сookie.
Пожалуйста, включите в вашем браузере данную настройку, иначе вы не сможете авторизоваться.