Смотри обучающее видео по маркету на YouTube
Как купить торгового робота или индикатор
Запусти робота на
виртуальном хостинге
виртуальном хостинге
Протестируй индикатор/робота перед покупкой
Хочешь зарабатывать в Маркете?
Как подать продукт, чтобы его покупали
Платные технические индикаторы для MetaTrader 5 - 4

Этот индикатор сочетает в себе классические индикаторы MACD и Zigzag для обнаружения расхождения между ценой и индикаторами. Он также использует передовые технологии искусственного интеллекта (ИИ) для обнаружения достоверности расхождения. MACD известен как "король индикаторов", а Zigzag также является очень полезным индикатором. Объединяя эти два индикатора, этот индикатор использует преимущества обоих. Обнаружение расхождения является вероятностной проблемой. Часто расхождения возникают только

Limited Offer:
Take advantage of our limited-time offer on the FxBears Powers Indicator! When you purchase this powerful tool, you'll also receive the renowned FxBears EA, an expert advisor that automatically executes the indicator's signals. Don't miss out on this unbeatable combination to enhance your trading strategy! No more losses with this indicator, test it for years ago and see if there is losses in one day results. but before testing it please see the explaining video down here.

The ICT Propulsion Block indicator is meant to detect and highlight propulsion blocks, which are specific price structures introduced by the Inner Circle Trader (ICT).
Propulsion Blocks are essentially blocks located where prices interact with preceding order blocks. Traders often utilize them when analyzing price movements to identify potential turning points and market behavior or areas of interest in the market.
USAGE (fingure 1) An order block is a significant area on a pric

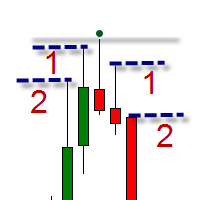
Индикатор автоматически распознает на графике Паттерн 1-2-3. Индикатор умеет отслеживать формирование паттерна в реальном времени, информирует трейдера об окончании формирования (когда цена пробьет линию в точке 2) и показывает завершенные паттерны на истории. Паттерны никогда не перерисовываются Индикатор может распознавать паттерны на любых инструментах (валютные пары, фондовый рынок, золото и т.д.), не требуя настроек под каждый инструмент Удобная и понятная визуализация паттернов. Отображени

Индикатор Blahtech Daily Range отображает средний дневной диапазон вместе с диапазонами отдельных сессий. Используя дневные цены открытия в качестве опорных, индикатор показывает цели фиксированного диапазона и динамического диапазона в виде линий на графике. Эти линии четко показывают, когда происходит истощение среднего диапазона. Дневные и сессионные диапазоны могут быть полезны для подтверждения входов или для установки целей, а также являются отличным способом улучшить шансы любой торговой

Индикатор определяет расхождение между ценой и осциллятором / индикатором. Он выявляет как регулярные, так и скрытые расхождения. У него есть опция фильтра RSI, которая позволяет отфильтровать только самые сильные настройки. Индикатор также предлагает варианты ожидания прорыва канала Дончиана или пересечения ценой скользящей средней (см. Снимок экрана 3). чтобы подтвердить дивергенцию перед тем, как подать сигнал о торговой возможности. В сочетании с вашими собственными правилами и мето

Volume Gives Depth To Price Action! Volume Critical can accurately locate the cheapest areas to place trades. Enter reversals as early as possible to get the best Risk Reward setups!
Features Aggressive algorithm that anticipates reversals Volume Classifications Gray Histograms - Normal Volume, average market activity Orange Histogram - Trending Volume, increased market activity Pink Histograms - Overbought Volume, we can wait for further confirmation to sell Blue Histograms - Oversold Condit

Dark Absolute Trend is an Indicator for intraday trading. This Indicator is based on Trend Following strategy but use also candlestick patterns and Volatility. We can enter in good price with this Indicator, in order to follow the main trend on the current instrument. It is advised to use low spread ECN brokers. This Indicator does Not repaint and N ot lag . Recommended timeframes are M5, M15 and H1. Recommended working pairs: All. I nstallation and Update Guide - Troubleshooting

Stargogs Spike Catcher V3.12 This Indicator is Developed To milk the BOOM and CRASH indices . Send me Message if you need any help with the indicator. CHECK OUT THE STARGOGS SPIKE CATCHER EA/ROBOT V3: CLICK HERE ALSO CHECK OUT SECOND TO NONEFX SPIKE CATCHER: CLICK HERE STARGOGS SPIKE CATCHER V3.12 WHATS NEW! Brand New Strategy. This is the Indicator you need for 2023. The Indicator Gives you an Entry at a time when conditions are met enter on every arrow and exit when it gives an X. New Tren

Gold Targets – это лучший трендовый индикатор. Уникальный алгоритм индикатора анализирует движение цены актива, учитывая факторы технического и математического анализа, определяет самые прибыльные точки входа, выдает сигнал в виде стрелки и ценовой уровень ( BUY Entry / SELL Entry ) для открытия ордера . Также сразу же индикатор выдает ценовой уровень для Stop Loss и пять ценовых уровней для Take Profit. ВНИМАНИЕ: Индикатор очень прост в применении. Установите индикатор на график одним к

Quarterly Cycles
Quarterly Cycles is based on the Quarterly Theory developed by Daye ( traderdaye on X ). This is an aid to the user to find Cycles and it is NOT automatic detected, user can select AMDX or XAMD in each Cycle and it will be visually drawn on the chart. Quarterly Cycles: Yearly, Monthly, Weekly, Daily, 6 Hour (90 minutes)
– Yearly Cycle : The year is divided in four sections of three months each Q1 - January, February, March Q2 - April, May, June Q3 - July, August, Sept

Trend Trading - это индикатор, предназначенный для получения максимальной прибыли от трендов, происходящих на рынке, путем определения времени отката и прорыва. Он находит торговые возможности, анализируя, что делает цена во время установленных тенденций. [ Руководство по установке | Руководство по обновлению | Устранение неполадок | FAQ | Все продукты ]
Торгуйте на финансовых рынках с уверенностью и эффективностью Прибыль от устоявшихся тенденций без проволочек Признать прибыльные откаты,
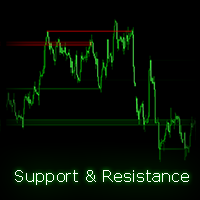
Автоматически находит и отображает каналы поддержки и сопротивления (S/R) на вашем графике, что облегчает идентификацию ключевых уровней. Индикатор поддерживает несколько таймфреймов, позволяя отображать каналы из разных таймфреймов на вашем текущем графике. Кроме того, он предлагает прозрачные цвета для улучшенной визуальной ясности и позволяет настроить цвета каналов по вашему усмотрению. Как работает этот индикатор? Индикатор находит точки разворота (highs и lows) в пределах диапазона, опреде

Наш индикатор Basic Support and Resistance - это решение, необходимое для повышения технического анализа.Этот индикатор позволяет вам проектировать уровни поддержки и сопротивления на диаграмме/ версия MT4
Особенности
Интеграция уровней Fibonacci: с возможностью отображения уровней Fibonacci наряду с уровнями поддержки и сопротивления, наш показатель дает вам еще более глубокое представление о поведении рынка и возможных областях обращения.
Оптимизация производительности: При возможност

# 33% off - limited time only # ChartSync Pro MT5 is an indicator, designed for the MetaTrader 5 trading terminals. It enables the trader to perform better multi-timeframe technical analysis, by synchronizing symbols and objects into virtually unlimited charts. Built by traders for traders! Telegram Premium Support - Dd you purchase the Chart Sync indicator and need a bit of help? Send us a screenshot with your purchase and your Telegram ID so we can add you to our premium support Telegram g
King Binary Profit System
1 minute candle
3-4 minute expire
Alright. This indicator works on MT5 and is very easy to use. When you receive a signal from it, you wait for that candle with the signal to close and you enter your trade at the beginning of the next new candle. A red arrow means sell and a green arrow means buy. All arrows comes with a long dotted like for easy identification of trade signal. Are you okay with that?

The best Vwap Midas coding for Metatrader 5 you can find in White Trader indicators.
The indicator has been optimized not to recalculate (improving performance) and has several visual settings for you to adapt in your own way. TRY IT FOR FREE by clicking the free demo button Where and why to use Vwap Midas (and Auto Zig Vwap Midas) can be used on a variety of indices, currencies, forex, cryptocurrencies, stocks, indices and commodities.
Many successful traders use price and volume to ge

Elevate Your Trading Experience with the famous UT Bot Alert Indicator!
Summary: The UT Bot Alert Indicator by Quant Nomad has a proven track record and is your gateway to a more profitable trading journey. It's a meticulously crafted tool designed to provide precision, real-time insights, and a user-friendly experience.
Key Features: 1. Precision Analysis: Powered by advanced algorithms for accurate trend identification, pinpointing critical support and resistance levels. 2. Real-time Ale

As it name implies, this is an exaustion oscillator. However, you may wonder: what differs you from others oscillators like RSI, Stochastic, CCI etc? The difference is that ours is more powerful and accurate ! Your oscillator filters the nois e made by other oscillators, and shows you only the exact moment to enter the trade. Of course, using it alone, like any other indicator, has its risks. Ideally, reconcile it with technical analysis and/or others indicators. If you have any doubt or suggest

I do not have the exact indicator for MT4 but the nearest possible look alike can be downloaded from here . Also you may check this link . This is the exact conversion from TradingView: "Donchian Trend Ribbon" By "LonesomeTheBlue". One of the coolest indicators out there to detect trend direction and strength. As a trader you always need such indicator to avoid getting chopped in range markets. There are ten buffers as colors to use in EAs also. The indicator is loaded light and non-repaint. Not
Телеграммы мне https://t.me/ArielfxWyckoff Как это работает? Wyckoff Wizard использует мультитаймфреймовый анализ. Проще говоря, индикатор отслеживает 2 таймфрейма. Старший таймфрейм и младший таймфрейм. Индикатор определяет тренд, анализируя поток и структуру ордеров на старшем таймфрейме (например, 4 часа). После определения тренда и потока ордеров индикатор использует предыдущую структуру рынка и ценовое действие для точного определения зон разворота с высокой вероятностью. После того, как зо

MACD (short for Moving Average Convergence/Divergence) is one of the most famous and oldest indicators ever created and is widely used among beginners . However, there is a newer version of the MACD that is named Impulse MACD which have less false signals than the standard MACD. Classic MACD helps us to identify potential trends by displaying crossovers between two lines. If MACD line crosses above the Signal line it shows us that the market is potentially up trending and that

Этот индикатор на панели инструментов мульти-таймфрейма и мультисимвольного расхождения отправляет предупреждение, когда одно или два разных расхождения были обнаружены на нескольких таймфреймах, а не на отдельных расхождениях. Его можно использовать на всех таймфреймах от M1 до MN. Одновременно на панели управления может отображаться максимум 9 таймфреймов. Можно включить фильтр тренда скользящего среднего, RSI или полос Боллинджера, чтобы отфильтровать только самые сильные настройки. В сочетан
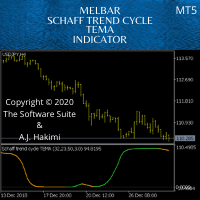
Schaff Trend: A Faster And More Accurate Indicator In Combination With The TEMA MACD - Scalping Systems Advantage
The Schaff Trend Cycle (STC) is a charting indicator that is commonly used to identify market trends and provide buy and sell signals to traders. Developed in 1999 by noted currency trader Doug Schaff, STC is a type of oscillator and is based on the assumption that, regardless of time frame, currency trends accelerate and decelerate in cyclical patterns. https://www.investopedia.

This indicator builds upon the previously posted Nadaraya-Watson Estimator. Here we have created an envelope indicator based on kernel smoothing with integrated alerts from crosses between the price and envelope extremities. Unlike the Nadaraya-Watson Estimator, this indicator follows a contrarian methodology. Please note that the indicator is subject to repainting. The triangle labels are designed so that the indicator remains useful in real-time applications.
Settings
Window Size: Dete

Этот индикатор предназначен для более быстрого и легкого просмотра множества графиков в разных временных масштабах. Отслеживание времени и цены на нескольких графиках Измените символ на одном графике, и все остальные графики того же символа также будут изменены. Простота в использовании, быстрое освоение Индикатор позволяет определить цену и время, когда указатель мыши находится на текущем графике, на всех других графиках, открытых на том же символе. Это позволяет быстро просматривать информацию
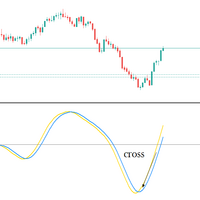
Big promotion on the Robos, Get yours now Robos Indicator The ROBOS indicator is a multi timeframe oscillator that targets the overbought and oversold regions of a price chart, a signal is indicated by the two lines crossing, compatible with all tradable instruments
Latest Release
The latest release is the version 4.0
#What's new in version 4.0 ?
Features
Extreme oversold and overbought levels
ROBOS version 4.0 comes with cool new feature , the ability to target on

Индикатор предназначен для того, чтобы вовремя закрывать позиции по рынку.
Например: досрочно фиксировать прибыль, если цена не достигла TakeProfit, а рынок разворачивается.
Индикатор анализирует импульс, а не тренд. О тренде никакой информации он не дает.
Индикатор хорошо подходит для поиска дивергенции.
Индикатор Ershov 38 Parrots динамически подстраивается под рынок и выявляет импульсы движения цены средней и высокой амплитуды. На мелкие скачки цены почти не реагирует.
Принципиальное о

Продвинутая мультисимвольная/мультитаймфреймная версия индикатора "Candle Pattern Finder for MT5 " (Поиск свечных паттернов на основе книги Грегори Л. Морриса «Японские свечи. Метод анализа акций и фьючерсов»). Индикатор ищет свечные паттерны по всем символам окна "Market Watch" и по всем стандартным таймфреймам от M1 до MN1. При возникновении паттерна на любом символе/таймфрейме индикатор дает сигнал (текстовый, звуковой, отправка сообщения на мобильник и эл.почту).
Таким образом, размещая инд

The Nadaraya Watson Envelop indicator for MT5 is a popular tool used by traders to identify trends and potential buy/sell signals. The indicator is based on a non-parametric regression model that uses kernel smoothing to estimate the underlying trend of the market. The resulting envelopes are then plotted around the trend line, providing traders with an indication of where prices are likely to fluctuate. One of the key features of this indicator is its ability to send alerts, emails, and notific
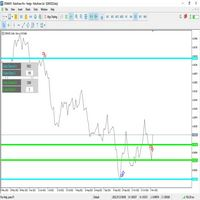
Индикатор - Price Channel состоит из двух независимых ценовых каналов и уровней ценовых зон - (А / B). Индикатор постоянно следя за поведением и движением цены, а также за пробоями уровней каналов - (А / B), переставляя уровни и фиксируя новые зоны экстремумов максимумы и минимумы. Для анализа предыдущих и текущих зон максимума и минимума, не зависимо указывается количество баров в каждом канале - (А / B). На графике индикатор выводит полезную информацию для каждого канала - (А / B): 1. Количес
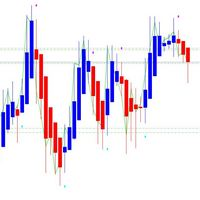
Индикатор Heiken Ashi Signal предназначен для торгового терминала Мт5. За основу был взят стандартный индикатор Heiken Ashi который есть в терминале Мт5. Индикатор можно применять как в ручной, а также автоматической торговли авторскими советниками. Для применения индикатора Heiken Ashi Signal в торговых экспертах есть сигнальные буферы для входа в рынок и открытия позиций на покупки и продажи.
Об этом читайте ниже подробнее. Возможности и характеристики индикатора Heiken Ashi Signal: Индикато
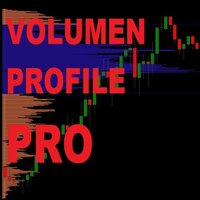
Khotite maksimizirovat' svoyu pribyl' i bystreye dostich' svoikh tseley? Potomu chto prismotrites' k nashemu ob"yemnomu profilyu. Potomu chto graficheskoye predstavleniye raspredeleniya ob"yema pozvolyayet legko uvidet' raspredeleniye i sdvig obshchego ob"yema. Eto, nesomnenno, privodit k uluchsheniyu sdelok i znachitel'no uvelichiva doch vashu proizvoditel'nost'. Blagodarya nashemu moshchnomu profilyu ob"yema, kotoryy nikoim obrazom ne ogranichivayet skorost' i effektivnost' Metatrader 5, vy m
Индикатор предназначен для свинг торговли. Индикатор способен определить тренд и важные вершины тренда (свинги), которые будут важнымы уровнями поддержки/сопротивления. Преимущества Простое визуальное отображение 3 типов свингов : Минорных свингов - которые не влияют на тренд, а только на движение внутри тренда Обычных свингов - которые могут влиять на направление тренда Сильных свингов - которые имеют двойное подтверждения важности уровня Визуальное отображение разворота тренда Минимум наст

Эта панель обнаруживает и отображает на графике зоны спроса и предложения , как в скальпинге, так и в долгосрочном режиме, в зависимости от вашей торговой стратегии для выбранных символов. Кроме того, сканерный режим панели помогает сразу проверить все нужные символы и не пропустить ни одной подходящей позиции / MT4 версия
Бесплатный индикатор: Basic Supply Demand
Особенности Позволяет просматривать торговые возможности по нескольким валютным парам , давая вам четкое и ясное п

Golden Spikes Detector This indicator is based on an advanced strategy primarily for trading spikes on Boom and Crash Indices. Complex algorithms were implemented to detect high probability entries only. It alerts on potential Buy and Sell entries. To trade spikes on the Deriv or Binary broker, only take Buy Boom and Sell Cash alerts. It was optimised to be loaded on 5-minute timeframe although multiple timeframe analysis is done in the background. Features · Desktop pop up and sound

Это четкий индикатор для оценки максимумов и минимумов, и он хорошо работает для колеблющегося рынка.
Акционная цена 49$ → 59$
функции хорошо оценивает верх и низ Без перерисовки, без дрейфа Быстрый расчет, без задержек Богатый режим напоминания Можно настроить несколько параметров и цветов
параметр "======== Главная ========" HighLowPeriod1 = 9 HighLowPeriod2 = 60 HighLowPeriod3 = 34 HighLowEMAPeriod = 4 MASignalPeriod = 5 "======== Уведомить ========" UseAlertNotify = истина; UseMetaQuo

Информационная панель ADR Alert показывает вам, где в настоящее время торгуется цена по отношению к ее нормальному среднему дневному диапазону. Вы будете получать мгновенные оповещения через всплывающие окна, электронную почту или push-уведомления, когда цена превышает свой средний диапазон и уровни выше него по вашему выбору, чтобы вы могли быстро переходить к откатам и разворотам. Черта предназначена для размещения на пустом графике и просто находится в фоновом режиме и предупреждает вас о до

Прецизионный индикатор осциллятора (Pi-Osc) от Роджера Медкалфа из Precision Trading Systems Версия 2 была тщательно перекодирована для быстрой загрузки на вашем графике, а также внесены некоторые другие технические улучшения для улучшения опыта. Pi-Osc был создан для предоставления точных сигналов времени для совершения сделок, предназначенных для поиска экстремальных точек истощения - точек, к которым рынок вынужден идти, чтобы сработать стоп-заказы всех остальных. Этот продукт решает вековую

Лучшее решение для новичка или трейдера-эксперта!
Этот индикатор является уникальным, высококачественным и доступным торговым инструментом, поскольку мы включили в него ряд собственных функций и новую формулу. С помощью всего лишь ОДНОГО графика вы можете определить силу валюты для 28 пар Форекс! Представьте, как улучшится ваша торговля, потому что вы сможете точно определить точку запуска нового тренда или возможность скальпирования?
Руководство пользователя: нажмите здесь
Это первый,

Индикатор показывает на графике Зоны прибыли (Profit Zone) отображая начало и конец локального тренда
Profit Zone PRO идеально подходит для всех символов Meta Trader: валют, металлов, криптовалют, акций и индексов Преимущества индикатора Profit Zone PRO: Сигналы на вход без перерисовки Алгоритмы индикатора позволяют находить идеальные моменты для входа в сделку (покупки или продажи актива), повышающие успешность сделок у 100% трейдеров. Индикатор имеет два уровня профита, что позволяет частич
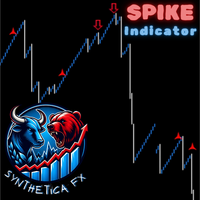
Индикатор SyntheticaFX Spike для MetaTrader 5 - это продвинутый инструмент для торговли, предназначенный для улучшения вашей торговой стратегии за счет обнаружения возможных пиков и анализа рыночных трендов на различных временных интервалах. Этот индикатор специально разработан для индексов Crash и Boom, предоставляя своевременные оповещения и важную информацию о трендах, чтобы помочь вам принимать обоснованные торговые решения. Основные характеристики: Обнаружение пиков : Определяет возможные п

Комплекс индикаторов распознающих разворотные моменты. Обнаруживает вершины и впадины по комбинациям свечей после их вычета из двух MA. Применим для торговых систем при использовании ранних входов. Можно использовать по тренду для скальпинга и внутри дневной торговли, так и для обнаружения разворотов тренда на ранних стадиях.
Возможности
Параметры предоставляют гибкую настройку для любых тайм-фреймов и торговых инструментов. Имеется несколько типов оповещений для сигналов. Желтая стрелка

Dark Support Resistance is an Indicator for intraday trading. This Indicator is programmed to identify Support and Resistance Lines , providing a high level of accuracy and reliability.
Key benefits
Easily visible lines Only the most important levels will be displayed Automated adjustment for each timeframe and instrument Easy to use even for beginners Never repaints, never backpaints, Not Lag 100% compatible with Expert Advisor development All types of alerts available: Pop-up, Email, Pus

Вы устали упускать выгодные рыночные тренды? Вы хотели бы иметь надежный инструмент, который мог бы точно и точно определять продолжение тренда?
Не смотрите дальше! Наш индикатор продолжения тренда призван усилить вашу торговую стратегию и помочь вам опережать конкурентов.
Индикатор продолжения тренда — это мощный инструмент, специально созданный для помощи трейдерам в выявлении и подтверждении паттернов продолжения тренда на различных финансовых рынках.
Независимо от того, торгуете ли в
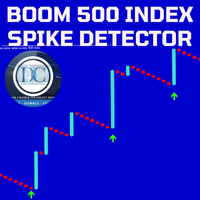
Our Spike Detector is specifically engineered to cater to the unique needs of traders in the Boom and Crash indices markets. This tool is optimized for M1 (1-minute) and M5 (5-minute) timeframes, ensuring you receive timely and actionable insights.
Key Features:
1. Non-Repainting**: Our detector guarantees accuracy with non-repainting signals, ensuring your data remains consistent and reliable. 2. Push Notifications**: Stay updated with real-time push notifications, so you never miss a cr

Этот индикатор отображает до 6 уровней, которые можно включать и выключать, чтобы сделать график чище в соответствии с требованиями трейдера.
Эти 6 уровней разделены на 2 набора: высокий и низкий.
Для каждого набора можно выбрать другой таймфрейм
Он основан на стратегии разворота предыдущего максимума-минимума, поскольку считается, что цена обычно показывает отклонение на меньшем временном интервале, таком как 5 минут, когда цена достигает дневного, недельного или месячного максимума-мини

SMARTMASS INDICATOR
This indicator is different from all known volume indicators. It has a significant distinction; it is an algorithm that relates price movement to volume, attempting to find proportionality and efficient movement while filtering out noise and other movements that are more random and do not follow a trend or reversal. Ultimately, it reveals the true strength of the movement, indicating whether it has genuine support from bulls or bears or if it's merely a high-volume movemen

Dark Sprint is an Indicator for intraday trading. This Indicator is based on Trend Following strategy, also adopting the use of the atr to determine the right volatility. We can enter in good price with this Indicator, in order to follow the strong impulse on the current instrument.
Key benefits
Easily visible sprint lines Intuitive directional arrows Automated adjustment for each timeframe and instrument Easy to use even for beginners Never repaints, never backpaints, Not Lag 100% compati

To download MT4 version please click here . - This is the exact conversion from TradingView: "Linear Regression Candles" By "ugurvu". - The overall look of the indicator is like Heiken Ashi. - It can be used as a trend confirmation indicator to detect the right trend direction. - This indicator lets you read the buffers for Candles' OHLC. - This is a non-repaint and light processing load indicator - You can message in private chat for further changes you need. Thanks

<p><b>Power of 3 ICT</b> - лучший инструмент, помогающий вам следить за HTF, торгуя на меньших таймфреймах. Этот индикатор позволит вам видеть до 2 различных свечей HTF на вашем графике LTF, так что вы всегда будете знать, как текущее ценовое движение выглядит на более высоких таймфреймах и следуете ли вы тренду на более высоких таймфреймах.</p>
<div class="atten"> <p><a href=" https://www.mql5.com/en/blogs/post/758051 " title=" https://www.mql5.com/en/blogs/post/758051 " target="_blank">К

KT Custom High Low shows the most recent highs/lows by fetching the data points from multi-timeframes and then projecting them on a single chart. If two or more highs/lows are found at the same price, they are merged into a single level to declutter the charts.
Features
It is built with a sorting algorithm that declutters the charts by merging the duplicate values into a single value. Get Highs/Lows from multiple timeframes on a single chart without any fuss. Provide alerts when the current

SpinSpike Detector is an amazing New Deriv MT5 indicator on the Market which detects Spikes and Crashes on Boom and Crash pair with more than 90% Accuracy . This indicator will give alerts before a spike or a crash so that you get ready to strike. The Indicator will only work for Boom and Crash pairs and will not work on any pair and it will give errors. This is a Non-Lag Indicator as witnessed by its stagnant arrows on chart which do not move. You can scalp all the day with this wonderful ind

The trend indicator " Super Trend Flexible Alert " has a minimum of settings. This indicator is designed to be as easy to use as possible. The indicator shows the trend with a main colored line ("SuperTrend" line, which you can see in the "Data Windows" window). Also, in places where the trend changes, the indicator shows colored arrows ( "STBuy" and " STSell" icons, which you can see in the "Data Windows" window ). In places where the trend changes, the indicator doesn't give a s

The RFOC draw smart money concepts assistant was created to assist traders who use the SMC as the basis for their buy and sell operations. With the RFOC Assistent you will have the options to draw: - Buy and Sell Order blocks, only indicating the reference candle; - Fair Value Gaps, only indicating the 2 reference Candles; - Indicate the best buying and selling regions after indicating the reference movement (60 to 80% of the fibonacci); - Draw the illustration of the market structure;

The Ultimate Dashboard Indicators are useful for traders, but when you put them into a dashboard that can scan 28 symbols at once they become even better, and when you can also combine different indicators and timeframes to give you synchronized alerts, then they become awesome. This easy to use dashboard provides you with 31 leading indicators, use them individually or together, to create powerful combination alerts. So when you want to know that RSI is above 25 and the price is above the movin

Multi-Oscillator - это превосходный швейцарский армейский нож для мультивалютной и мульти-таймфреймовой торговли. Он отображает желаемый осциллятор для множества валютных пар и / или таймфреймов на одном графике. Он может использоваться для торговли статистическим арбитражем, в качестве инструмента скрининга рынка или в качестве уточненного индикатора с несколькими таймфреймами. [ Руководство по установке | Руководство по обновлению | Устранение неполадок | FAQ | Все продукты ] Простая интерпре

Добро пожаловать в индикатор Twin Peak MT5 --(Двойная вершина/ Двойная дно)-- Индикатор «Двойная вершина и дно» — это инструмент технического анализа, предназначенный для выявления потенциальных моделей разворота на рынке.
Он определяет области, где цена сделала два последовательных пика или впадины почти одинаковой высоты, за которыми последовало движение цены в противоположном направлении.
Этот паттерн указывает на то, что рынок теряет импульс и может быть готов к развороту тренда. *Свяж

Big summer sale. Save up to 40% on my products. ADR Dashboard - save 9$! The intention of the dashboard is to provide a quick overview of the daily, weekly and monthly range of configured assets. In "single asset mode" the dashboard shows you possible reversal points directly in the chart, thus making statistics directly tradable. If a configured threshold is exceeded, the dashboard can send a screen alert, a notification (to the mobile MT5) or an email. There are various ways of using this in

Индикатор предсказывает наиболее вероятное краткосрочное движение цен на основе сложных математических расчетов.
Особенности Оценка текущего движения цены; Расчет текущего тренда; Расчет наиболее важных линий поддержки и сопротивления; Алгоритмы оптимизированы для проведения сложных математических расчетов при минимальном расходе системных ресурсов; Самоадаптация для получения лучшего результата и, как следствие, возможность работы на любом символе (даже самом экзотическом) и таймфрейме; Совме

Тиковые графики показывают количество сделок на каждом баре. Например, если на вашем графике 233 тика, каждому бару соответствуют 233 сделки. После 233 сделок отрисовывается новый бар. Вы можете выбрать любое количество тиков за бар, но большинство трейдеров выбирают числа Фибоначчи (1, 2, 3, 5, 8, 13, 21, 34, 55, 89, 144, 233...). Индикатор использует тиковые данные для настройки, а реальные тики - для построения текущего графика. Данный метод расчета позволяет создавать очень точные графики бе

Прежде всего стоит подчеркнуть, что эта торговая система является индикатором без перерисовки, без перекрашивания и без задержек, что делает ее идеальной для профессиональной торговли.
Онлайн-курс, руководство пользователя и демонстрация. Торговая система "Умная система торговли на уровнях поддержки и сопротивления" является продвинутым индикатором, созданным для новичков и опытных трейдеров. Он дает трейдерам точность и уверенность на рынке Форекс. Эта всесторонняя система объединяет 7+ стр
Zig Zag Multi Time Frame Indicator counts in how many consecutive candlesticks the current Zig Zag "lit" on the different Time Frames. It can be used for both trend signal strategies and range breakout strategies. Shows simultaneously on all Frames in how many candles we have had Zig Zag value in the current swing. The Zig Zag period can be adjusted in the Indicator settings.

Upgraded version 3.4 Supply and Demand Indicator , it determines levels of supply and demand by using algorithm such as order blocks , engulfing candle patterns , etc. Signals are visually indicated when the levels are drawn on the chart
Trendline touch and Candle Strick Patterns can also play a role to add as confluence when making trading decisions including `reversal patterns` etc Compatibility : All tradable Instruments ; Currency Pairs, Synthetic indices ,Metals, Crypto, NASDAQ et

The indicator shows when there are overprice and divergences on the RSI. In addition, it has configurable alerts, dynamic overprice levels and a special “RSI cleaner” function. The indicator that automatically calculates the premium rates! RSImaxmin is an indicator based on the Relative Strength Index (RSI) oscillator that effectively identifies changes in price trends as it reflects the relative strength of bullish movements compared to bearish movements. It is widely used by traders to measur

The indicator shows when there are overpricing and divergences over a normalized MACD Plus, it displays signals with configurable alerts, self-regulating dynamic overprice levels, and a simple setup and interface. The indicator that automatically calculates overprices ranges! MACDmaxmin is an indicator based on the MACD oscillator that effectively identifies trend changes in price, as it is a momentum indicator that captures the trend and shows the relationship between two moving averages of th

Nadaraya-Watson Envelope Indicator convert to MT5 Nadaraya Watson Envelope Indicator is one of the monst popular indicator in TradingView. TradingView(Chrome, Edge) eats a huge of CPU, so I convert this to MT5 version.
As you can see the screenshot, it's good with Schaff trend RSI Indicator (or others) If you want to get Schaff trend RSI Indicator , Link: https://www.mql5.com/en/market/product/98011
Window Size - determines the window size for calculating smoothed values. A larger window
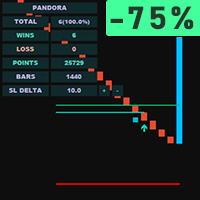
Инструмент для скальпинга на Deriv
Описание: Данный торговый индикатор разработан для трейдеров, специализирующихся на скальпинге. Он предоставляет сигналы для торговли в направлении краткосрочных ценовых движений. Индикатор оптимизирован для работы на таймфрейме М1 и поддерживает индексы Boom и Crash (300, 500, 1000). Индикатор будет продан в ограниченном кол-ве. Особенности: Направление торговли: в сторону краткосрочных ценовых движений. Фильтры и индикаторы: Индикатор объемов реакций: отобр

Golden Star MT5 - это профессиональный трендовый индикатор для платформы MT5, разработанный группой профессиональных трейдеров. В основе алгоритма его работы - оригинальный авторский метод, позволяющий с высокой вероятностью находить потенциальные точки разворота тенденции и получать сигналы на вход в рынок в начале формирования тренда. Этот индикатор подойдет для работы на золоте, криптовалюте и валютными парами на Forex. Система оповещений (алерт, уведомления на почту и мобильный телефон) пом

M & W Pattern Pro is an advanced scanner for M and W patters , it uses extra filters to ensure scanned patterns are profitable.
The indicator can be used with all symbols and time frames.
The indicator is a non repaint indicator with accurate statistics calculations.
To use , simply scan the most profitable pair using the statistics dashboard accuracy , then enter trades on signal arrow and exit at the TP and SL levels.
STATISTICS : Accuracy 1 : This is the percentage of the times price hit
MetaTrader Маркет - торговые роботы и технические индикаторы для трейдеров, доступные прямо в терминале.
Платежная система MQL5.community разработана для сервисов платформы MetaTrader и автоматически доступна всем зарегистрированным пользователям сайта MQL5.com. Ввод и вывод денежных средств возможен с помощью WebMoney, PayPal и банковских карт.
Вы упускаете торговые возможности:
- Бесплатные приложения для трейдинга
- 8 000+ сигналов для копирования
- Экономические новости для анализа финансовых рынков
Регистрация
Вход
Если у вас нет учетной записи, зарегистрируйтесь
Для авторизации и пользования сайтом MQL5.com необходимо разрешить использование файлов Сookie.
Пожалуйста, включите в вашем браузере данную настройку, иначе вы не сможете авторизоваться.