Смотри обучающее видео по маркету на YouTube
Как купить торгового робота или индикатор
Запусти робота на
виртуальном хостинге
виртуальном хостинге
Протестируй индикатор/робота перед покупкой
Хочешь зарабатывать в Маркете?
Как подать продукт, чтобы его покупали
Платные технические индикаторы для MetaTrader 5 - 11

IQ FX Correlation Matrix is a powerful multi-timeframe dashboard that helps traders analyze real-time currency correlations across multiple forex pairs. With customizable settings, sleek design, and one-click symbol switching, it enhances trade accuracy, reduces risk, and identifies profitable correlation-based opportunities. Download the Metatrader 4 Version Message us here after purchase to get the Indicator Manual. Download Now! Offer valid only for next 10 Buyers. Price will increase gradua

I've combined two trading strategies, the Order Block Strategy and the FVG Trading Strategy, by utilizing a combination of the FVG indicators and Order Blocks. The results have been surprisingly effective.
This is a two-in-one solution that makes it easy for traders to identify critical trading zones. I've optimized the settings so that all you need to do is install and trade; it's not overly complex to explain further. No need for any usage instructions regarding the trading method. You shoul
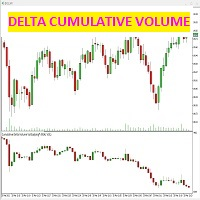
этот индикатор определяет разницу между контрактами, заключенными при покупке и продаже (агрессия) для каждой отдельной свечи.
индикатор показывает в специальном окне под ценовым графиком свечи, точно определяемые разницей между проданными и купленными контрактами, которые генерируют объемную силу рынка.
можно (см. на скриншотах) как выбрать только кумулятивный график дельты свечи, или даже с линией тренда самих свечей: при выборе второго поля u "НЕТ" линия тренда не будет нарисована, а при в

Этот индикатор эффективно отслеживает любые свечи других таймфреймов, которые вы хотите отслеживать на том же графике.
1. Выберите любой более высокий таймфрейм для загрузки баров на тот же график.
2. Настройте цвета и стиль свечей.
3. Выберите количество баров для рисования свечей.
4. Отслеживайте завершенные свечи более высоких таймфреймов вместе с фитилем и телом.
5. Легко и удобно для тех, кто не хочет переключать график.

Версия MT4 https://www.mql5.com/en/market/product/129411 Версия MT5 https://www.mql5.com/en/market/product/129412
Dashboard Scanner Kalman — это усовершенствованный многосимвольный и многотаймфреймовый инструмент сканирования, разработанный для упрощения вашего торгового процесса за счет использования мощных расчетов уровня тренда и поддержки-сопротивления Калмана. Этот индикатор сочетает в себе алгоритмы следования за трендом и точный анализ поддержки-сопротивления, чтобы помочь вам быстро оп
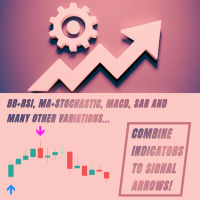
Это уникальный инструмент, конструктор который объединяет сигналы стандартных индикаторов встроенных в MT5 в одну общую стрелку. Стрелки не перерисовываются, и имеют буфера 0 и 1 для передачи на разный софт. Этот стрелочный индикатор позволит вам легко комбинировать сигналы от разных индикаторов, создавая десятки и сотни различный вариаций для ваших идей из которых можно получить мощные торговые стратегии. Используя встроенную функцию анализа прибыли, м ожно мгновенно оценить потенциал любой стр

Введение индикатора Индикатор разработан по формулам скользящей средней, которая более стабильна и имеет меньшее запаздывание, чем RSI или CCI. Индикатор имеет три значения индикатора, период скользящей средней и цвета линии можно менять вручную. Что может дать вам этот индикатор? Точные сигналы входа: индикатор рисует сигналы со стрелками вверх и вниз. Многопериодный анализ тренда: загрузив этот индикатор на график большого таймфрейма и график маленького таймфрейма, эффект от его использов

Этот многосимвольный индикатор приборной панели может отправлять оповещения при обнаружении сильного тренда. Это можно сделать, создав информационную панель с использованием следующих индикаторов/осцилляторов (далее упоминаемых только как индикаторы): RSI, Stochastics, ADX, CCI, MACD, WPR (процентный диапазон Вильямса, также называемый Williams %R), ROC (ценовой диапазон). скорость изменения) и осциллятор Ultimate. Его можно использовать со всеми таймфреймами от M1 до MN (он может показывать тол

Alert Stochastic plus delay and level Filter
A stochastic oscillator is a momentum indicator comparing a particular closing price of a security to a range of its prices over a certain period of time. We added many types of alerts plus the Level Cross Filter to aid in your search for better opportunities in the market. Product Features Sound alert Push Notification (Alerts can be sent to your mobile phone) Signs on chart Alert box Level Filter Delay Level Filter
Indicator Parameters K,D

Индикатор для ручной торговли и технического анализа для Forex.
Состоит из трендового индикатора с уровнем открытия торгового дня и стрелочного индикатора для определения точек входа.
Индикатор не перекрашивается, работает по закрытию свечи.
Содержит несколько типов оповещений для сигнальных стрелок.
Можно настроить для работы на любом графике, торговом инструменте или тайм-фрейме.
Стратегия работы базируется на поиске движений цены по тренду.
Для совершения сделок " Buy ": Трендовая линия д
The Индикатор зоны FVG MT5 мощный инструмент, предназначенный для определения разрывов справедливой стоимости (FVG) на рынке, подчеркивающий ценовой дисбаланс между справедливой стоимостью и рыночной ценой. Это точное определение разрывов позволяет трейдерам определять потенциальные точки входа и выхода с рынка, значительно повышая их способность принимать обоснованные торговые решения. Благодаря интуитивно понятному и удобному интерфейсу индикатор FVG Zone автоматически сканирует гр

Дивергенция — это один из важных сигналов, указывающих на возможный разворот цены на рынке. KT Stoch Divergence показывает обычные и скрытые дивергенции между ценой и стохастическим осциллятором.
Ограничения KT Stoch Divergence
Использование дивергенции стохастика в качестве единственного сигнала входа может быть рискованным. Не каждую дивергенцию можно трактовать как сильный сигнал разворота. Для лучших результатов рекомендуется комбинировать с анализом цены и направлением тренда.
Особенности

The Engulf Seeker indicator is a powerful tool designed to detect engulfing candlestick patterns with precision and reliability. Built on advanced logic and customizable parameters, it offers traders valuable insights into market trends and potential reversal points.
Key Features and Benefits: Utilizes revised logic to analyze previous candles and identify strong bullish and bearish engulfing patterns. Convenient arrow-based alert system notifies traders of pattern occurrences on specific symbo
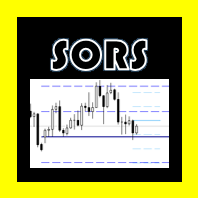
КОМПЛЕКСЫ СОРС (для Metatrader 5)
Этот индикатор предназначен для рисования линий SORS на графике, это современный способ расчета рыночных точек, который он обычно уважает, они состоят из поддержек и сопротивлений, но в отличие от классических, они рассчитываются на основе эндогенной волатильности и стандартного отклонения,
В конфигурации вы можете изменить цвет каждого уровня линейно и скрыть те, которые не нужны.
A = Годовой.
M = Ежемесячно.
W = еженедельно
D = Ежедневно.
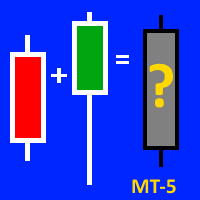
Этот индикатор будет ОЧЕНЬ ПОЛЕЗЕН всем, кто работает со свечными паттернами. Данный индикатор предназначен для выведения средней фигуры из двух соседних свечей (текущая и предыдущая). Соответственно - показывает В КОНТЕКСТЕ силу или слабость быков/медведей (!). Но пожалуйста - не забывайте и об классических основах технического анализа (!). Все индикаторы - лишь вспомогательный инструмент для чтения графика (!). С демо-версией на примере мт-4 можно ознакомиться тут: https://www.mql5.com/ru

Индикатор разработан бывшим сотрудником хедж-фонда, и он автоматически определяет высоковероятностные паттерны "двойная вершина" и "двойное дно". Он также может быть использован для определения моделей "тройная вершина" и "тройное дно". Он также включает в себя трендовый фильтр на основе RSI для нахождения формаций, возникающих на вершинах (или впадинах) тренда. Это отличный инструмент для поиска самых сильных уровней на рынке. Любой уровень, который держится 2 или 3 раза, очевидно, является уро

Imbalance DOM Pro: Повышайте свою торговлю с помощью дисбаланса в книге ордеров У ВАС ЕСТЬ ДОСТУП К КНИГЕ ОРДЕРОВ НА MT5? ХОТИТЕ ПОДНЯТЬ СВОЮ ТОРГОВЛЮ НА НОВЫЙ УРОВЕНЬ? Если вы трейдер, который использует поток ордеров для принятия решений, Imbalance DOM Pro может преобразовать ваш анализ. Этот инструмент специально разработан для скальперов и краткосрочных трейдеров, он выявляет дисбалансы в книге ордеров, открывая ценные возможности для быстрых и точных сделок. Используйте возможности

WaveTrend 3D is the mql version of this oscillator (By jdehorty and LazyBear). WaveTrend 3D (WT3D) is a novel implementation of the famous WaveTrend (WT) indicator and has been completely redesigned from the ground up to address some of the inherent shortcomings associated with the traditional WT algorithm.
WaveTrend 3D is an alternative implementation of WaveTrend that directly addresses some of the known shortcomings of the indicator, including its unbounded extremes, susceptibility to whips
Spike Phantom – Best Spike Detector for PainX and GainX Volatility Spikes (Non-Repainting)
Tired of missing explosive market spikes? Want a powerful tool designed for trading PainX & GainX spikes on WellTrade? Spike Phantom is the ultimate non-repainting spike detector built to capture high-impact market movements with precision and speed . Designed specifically for PainX and GainX and Synthetic Pairs , this indicator provides real-time alerts for perfect entry and exit points. VPS recommend

Использует встроенный календарь новостей терминала МТ5 или сайт Investing.com (в последнем случае требуется утилита Get news5 ) Имеет параметр Scale={100%, 110%, 125%, ...} для настройки комфортного размера текста и управляющих элементов
Подсказывает в каком направлении безопаснее открывать позиции 3 в 1 : Новости + Тренды + Прогноз
Новости за выбранный период: текущие и в табличной форме
Фактические тренды для 5 настраиваемых таймфреймов и уровни изменения направления трендов
Прогноз движени

Индикатор отображает гармонические модели на графике, основанном на Динамическом ЗигЗаге ( https://www.mql5.com/ru/market/product/5357 ), и представляет собой практически полный аналог одной из версий известного многим korHarmonics. Индикатор распознает следующие фигуры и их разновидности: ABCD, Gartley (Butterfly, Crab, Bat), 3Drives, 5-0, Batman, SHS, One2One, Camel, Triangles, WXY, Fibo, Vibrations. По умолчанию в настройках включено отображение только фигур ABCD и Gartley. Линия реверса помо
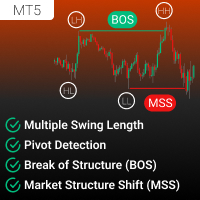
1TF BOS/MSS Indicator – это мощный инструмент, разработанный для анализа и визуализации рыночной структуры непосредственно на одном таймфрейме вашего графика. Этот индикатор обеспечивает точное определение пробоев рыночной структуры (BOS) и сдвигов рыночной структуры (MSS), что позволяет трейдерам с легкостью определять ключевые точки разворота и продолжения тренда. Настраиваемые параметры и детализированные аннотации делают этот инструмент незаменимым для трейдеров, стремящихся к ясности и увер

To download MT4 version please click here . - This is the exact conversion from TradingView: "Linear Regression Candles" By "ugurvu". - The screenshot shows similar results from tradingview and Metatrader when tested on ICMarkets on both platforms. - The overall look of the indicator is like Heiken Ashi. - It can be used as a trend confirmation indicator to detect the right trend direction. - This indicator lets you read the buffers for Candles' OHLC. - This is a non-repaint and light processing

To download MT4 version please click here . This is the exact conversion from TradingView: "B-Xtrender" By "QuantTherapy". - It is an oscillator based on RSI and multiple layers of moving averages. - It is a two in one indicator to calculate overbought and oversold zones for different RSI settings. - This indicator lets you read the buffers for all data on the window. - This is a non-repaint and light processing load indicator. - You can message in private chat for further changes you need.
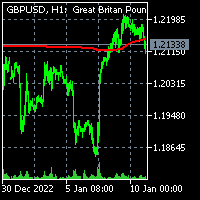
To get access to MT4 version please click here . - This is the exact conversion from TradingView: "Trend Regularity Adaptive Moving Average","TRAMA" By " LuxAlgo ". - This is a light-load processing and non-repaint indicator. - Buffer is available for the main line on chart. - You can message in private chat for further changes you need. Thanks for downloading

Half Trend TPSL Buy Sell Indicator calculates the open and close of the price bars over the selected period of time and applies its own calculation method to find an average line of the price movement. ATR based Take Profit and Stop Loss ATR is a measure of volatility over a specified period of time. The most common length is 14, which is also a common length for oscillators, such as the relative strength index (RSI) and stochastics. A higher ATR indicates a more volatile market, while a lowe

Moving Average Crossover Scanner and Dashboard For MT5 Advanced Moving Average Scanner Moving Averages Crossover Dashboard MT4 Version of the product can be downloaded: https://www.mql5.com/en/market/product/69260 The indicator scans the market and sends signals and alerts for Moving Average crossovers, death cross and golden cross.
Crossovers are one of the main moving average ( MA ) strategies.
MA Crossover ( cut ) strategy is to apply two moving averages to a chart: one longer and one sho

Осциллятор MACD ADX – индикатора, который сочетает лучшее из MACD (Конвергенция-Дивергенция Скользящих Средних) и ADX (Средний Индекс Направления), чтобы предоставить вам непревзойденное представление о рыночной динамике и силе тренда. Ключевые особенности: Двойной анализ динамики: Этот индикатор объединяет способность MACD обнаруживать изменения в рыночной динамике с измерением силы тренда ADX, предоставляя вам всесторонний взгляд на направление и мощь рынка. Настраиваемые параметры: Настройте

У каждого индикатора есть свои достоинства и недостатки. Трендовые показывают хорошие сигналы во время тренда, но запаздывают во время флэта. Флэтовые прекрасно себя чувствуют во флэте, но при наступлении тренда сразу же умирают. Все это не было бы проблемой, если было бы просто предсказать, когда тренд сменится флэтом, а флэт сменится трендом, но на практике это крайне серьезная задача. Что если разработать такой алгоритм, который сможет в индикаторе устранить недостатки и усилить его достоинст
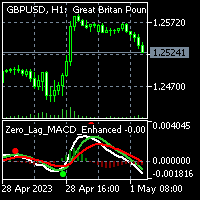
To get access to MT4 version please click here . This is the exact conversion from TradingView: "Zero Lag MACD Enhanced - Version 1.2" by " Albert.Callisto ". This is a light-load processing and non-repaint indicator. All input options are available. Buffers are available for processing in EAs. You can message in private chat for further changes you need. Thanks

To get access to MT4 version please click here . This is the exact conversion from TradingView: " Impulse MACD" by LazyBear.
This is a light-load processing and non-repaint indicator. All input options are available except candle coloring option. Buffers are available for processing in EAs. You can message in private chat for further changes you need. Thanks for downloading
To get access to MT4 version please click here . This is the exact conversion from TradingView:"HIGH AND LOW Optimized Trend TrackerHL OTT" by "kivancozbilgic" This is a light-load processing indicator. It is a non-repaint indicator. All input options are available. Buffers are available for processing in EAs. You can message in private chat for further changes you need. Thanks.

To get access to MT4 version please click here . This is the exact conversion from TradingView: "[SHK] Schaff Trend Cycle (STC)" by "shayankm". This is a light-load processing indicator. This is a non-repaint indicator. Buffers are available for processing in EAs. All input fields are available. You can message in private chat for further changes you need. Thanks for downloading
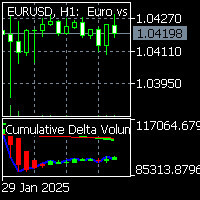
To get access to MT4 version please click here . This is the exact conversion from TradingView: "Cumulative Delta Volume" by "LonesomeTheBlue". The screenshot shows similar results from tradingview and Metatrader when tested on ICMarkets on both platforms. This is a light-load processing and non-repaint indicator. All input options are available. Buffers are available for processing in EAs. You can message in private chat for further changes you need. Thanks for downloading
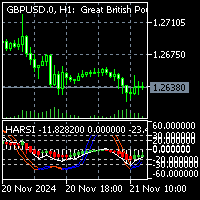
To get access to MT4 version please click here . This is the exact conversion from TradingView:"Heikin Ashi RSI Oscillator" by "jayRogers" The screenshot shows similar results from tradingview and Metatrader when tested on ICMarkets on both platforms. This is a light-load processing indicator. It is a non-repaint indicator. I removed colored areas option to fit into metatrader graphics. Buffers are available for processing in EAs. You can message in private chat for further changes you need.

To get access to MT4 version please click here . This is the exact conversion from TradingView: "SwingArm ATR Trend Indicator" by " vsnfnd ". The screenshot shows similar results from tradingview and Metatrader when tested on ICMarkets on both platforms. Also known as : "Blackflag FTS" by "Jose Azcarate" This is a light-load processing and non-repaint indicator. All input options are available except multi time frame. Buffers are available for processing in EAs. Extra option to show buy and sel

Point and Plot: The Anchored VWAP with Channel Bands tool is designed for traders of all levels, from beginners to seasoned professionals. Point to the price level you want to anchor to, plot the horizontal line, and watch as this versatile tool transforms your trading approach. User-Friendly Interface : Navigate the tool effortlessly with a user-friendly interface that ensures you never miss a crucial detail. Real-Time Analysis : Make informed decisions in real time with dynamic data that upda
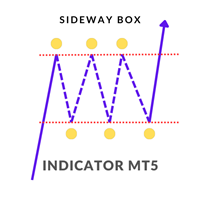
Sideway Box Indicator
The Sideway Box Indicator is an advanced trading tool designed to help traders identify and capitalize on sideways market conditions. This powerful indicator detects periods when the market is in a sideways (ranging) phase, providing traders with clear visual cues. Key Features
Sideways Market Detection : The Sideway Box Indicator accurately identifies sideways market conditions, allowing traders to recognize when the price is consolidating within a specific range. Buy/Sel

6-BAND VWAP (Volume Weighted Average Price)
Fully customized and EA-friendly VWAP Bands Indicator.
Main Features:
Choose the period of VWAP calculation reset (Daily, Weekly or Monthly): For day trading use the Daily VWAP, and for longer term analysis use the Weekly or Monthly calculations. Choose how many bands (deviations) you want to show, up to 6. Choose zero to display only the main VWAP line. Fine adjustment of the deviation of the bands: Find the best band’s deviation for the instrum

Se você já ouviu falar do Método de Wyckoff, Análise de dispersão de volume, etc., com certeza chegou até aqui para buscar o indicador que lhe faltava!! Nosso indicador é capaz de lhe mostrar a dispersão de volume negociado pelos grandes players durante todo o período de negociação!
E o grande diferencial deste tipo de abordagem é a capacidade que este indicador possui de lhe mostrar onde está armado o "ACAMPAMENTO" dos BigPlayers e, assim, tirar o melhor proveito em seus trades, entrando junt

The indicator monitors the Dinapoli MACD trend in multiple timeframes for the all markets filtered and shows the results on Dashboard.
Key Features Indicator can be used for all markets Monitors every timeframe, from 1 Min to Monthly
Parameters
UseMarketWatch: Set true to copy all symbols available in market watch MarketWatchCount : Set the number of symbols that you want to copy from the market watch list. CustomSymbols: Enter the custom symbols that you want to be available in dashboard. Ti

The order block locator is powered by three main search algorithms thar can be used to find order blocks. Simple Fractal Search Algorithm Naive Fractal Movers Algorithm
Candle Transition Algorithm You can even combine the power of your 2 favourite algorithms and get the best of both worlds: Mixed Algorithm (Naive Fractal + Candle transition) Mixed Algorithm (Simple Fractal + Candle Transition
Simple Fractal Search Algorithm
The algorithm finds the fractals based on your setting paramers for c

SpinSpike Detector is an amazing New Deriv MT5 indicator on the Market which detects Spikes and Crashes on Boom and Crash pair with more than 90% Accuracy . This indicator will give alerts before a spike or a crash so that you get ready to strike. The Indicator will only work for Boom and Crash pairs and will not work on any pair and it will give errors. This is a Non-Lag Indicator as witnessed by its stagnant arrows on chart which do not move. You can scalp all the day with this wonderful ind

The Simple ICT Concepts Indicator is a powerful tool designed to help traders apply the principles of the Inner Circle Trader (ICT) methodology. This indicator focuses on identifying key zones such as liquidity levels, support and resistance, and market structure, making it an invaluable asset for price action and smart money concept traders. Key Features Market Structure : Market structure labels are constructed from price breaking a prior swing point. This allows a user to determine the curr

Мультивалютный и мультитаймфреймовый индикатор Moving Average (MA). На панели вы можете видеть текущее состояние индикатора — прорывы и касания (ценой) Быстрой МА и Медленной МА, а также пересечение линий МА между собой. В параметрах можете указать любые желаемые валюты и таймфреймы. Также индикатор может отправлять уведомления о касании ценой линий и о их пересечении. По клику на ячейке будет открыт данный символ и период. Параметры
Fast MA
Averaging period — период усреднения для вычисления

Live Trading Results MT4 Version Contact for Manual Guide Next Price $125 Free Scanner Dashboard (Contact me)
Strategy - Breakout / Retest / Aggressive Hello Everyone, We are excited to introduce one of the most reliable and high win rate patterns in trading: the Cup and Handle . This is the first time we are releasing this meticulously crafted indicator, boasting an impressive 95% success rate . It is versatile and effective across all types of pairs, stocks
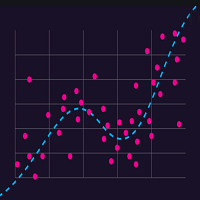
Канал Регрессии состоит из двух линий, равноудалённых сверху и снизу от линии тренда регрессии. Расстояние между границами канала и линией регрессии равно значению отклонения максимальной цены закрытия от линии регрессии, только это определение соответствует самим свежым точкам регресии.
Термин регрессии относится к области статистики. Центральная линия канала является линией тренда. Для ее расчета используется метод наименьших квадратов. Линия, расположенная выше центральной, выступает сопро
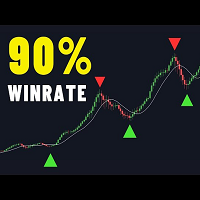
There are many linear regression indicators out there, most of them draw lines or channels, but this one actually draws a chart. This indicator also alow user show MA line on chart. So buy signal is when red candle and crossdown with MA line and vice versal. Following MA type is supported: SMA EMA RMA WMA This simple mineset but powerfull KISS - Keep it simple, stupid :D
Arrow Simulator mt5 gives buy and sell signals based on non repaint arrow logic
It also shows take profit and stop loss placement based on average true range
Also provided is a simulation panel in the corner to show how the signals performed over a set number of bars
When running in strategy tester or live lower the number of bars to reduce using pc resources and speed up back testing
Filter out arrows with the ma filter if needed and choose your trading time
Default settings is for 5m EUR
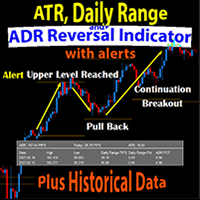
The Daily Range ATR ADR Reversal Indicator shows you where price is currently trading in relation to its normal average daily range. You will received alerts via pop-ups when price exceeds its average daily range. This will enable you to identify and trade pullbacks and reversals quickly.
The Indicator also shows you the Daily Range of Price for the current market session as well as previous market sessions. It shows you the ATR which is the average range of pips that a candle may move in that

This indicator gives you arrows, two SR lines and a golden trend line. Uses a special trend algorithm to plot the arrows, combined with support and resistance inputs. Perfect for channel trading. Features alert functions.
Parameter TrendArrowPeriod. Parameter TrendLinePeriod. (Change to your preference) How to use: Simply attach to any chart with default settings. Zoom in the chart, to see the two blue SR lines and arrows more clearly. When the blue SR line is below the price, golden trend line

The Gann Scalping Gold Indicator is a robust technical analysis tool designed for precision trading in gold markets. It leverages Gann-based methodologies to identify key price levels, enabling traders to anticipate potential market reversals, breakouts, and areas of consolidation. Daily Reset Logic: Automatically resets touch statuses at the start of a new trading day, ensuring that the indicator aligns with fresh daily trends. How It Works: The indicator draws horizontal lines at predefine
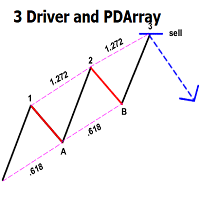
This indicator automatically identifies the SMC 3-Drive pattern and sends notifications to users when the pattern is detected. Additionally, the indicator identifies PDArray (including FVG and OB) and offers an option to combine the 3-Drive pattern with PDArray. This combination provides users with more reliable signals. What is the 3-Drive Pattern? This pattern is formed by three price pushes in one direction, providing a strong reversal signal (Figure 3). The key to identifying this pattern is
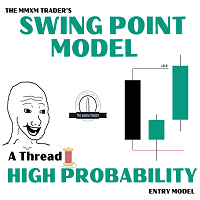
Introducing the Swing Point Model Indicator – A Professional Trading Tool The Swing Point Model Indicator is an innovative tool designed for traders who want to capture market structure and identify potential trading opportunities. With a logical and transparent approach, the Swing Point Model helps you gain deeper market insights and make precise trading decisions. This is multiple Timeframe indicator so you can choose Higher timeframe for detect Swing point model What Is the Swing Point Model?
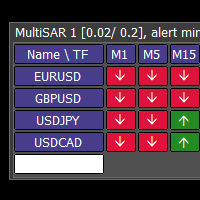
This tool monitors Parabolic SAR indicators on all time frames in the selected markets. Displays a table with signals to open a BUY trade (green) or SELL trade (red). You can easily add or delete market names / symbols. If the conditions for opening a trade on multiple time frames are met, you can be notified by e-mail or phone message (according to the settings in MT5 menu Tools - Options…) You can also set the conditions for sending notifications. The list of symbols/ markets you have entered

This is diamond! Contact me to send you instruction and add you in group.
Diamond Pattern is based on Read The Market(RTM) concepts. The purpose of this model is to face the big players of the market (financial institutions and banks), As you know in financial markets, big traders try to fool small traders, but RTM prevent traders from getting trapped. This style is formed in terms of price candles and presented according to market supply and demand areas and no price oscillator is used in i

MT5 RSI Experiment: This indicator leverages the Relative Strength Index (RSI) and floating levels to pinpoint potential buy and sell signals.
The code uses enums for prices and RSI calculation methods. These enums define indicator parameters.
Input variables include RSI period, price type for RSI calculation, smoothing method, and look-back period with levels for floating levels.
Index buffers store RSI fill, RSI up line, RSI middle line, RSI down line, and trend line data.
For each bar, i

Indicator basic idea is buy strong currency and sell weak currency. If A/B currency pair is in an uptrend, it shows if it is due to A strength or B weakness.On these signals one can choose the most optimal pair to trade. You can use Currency Power System for pattern trading as well, among basic patterns which can be used are: cross trend break divergencies So much for theory. I searched for a ready-made indicator (Currency Strength) to support my trade but did not find one. Well. I have to wr

Поднимите свой анализ на новый уровень с Weis Wave Box! Если вы ищете точность и ясность в торговле, то Weis Wave Box — это инструмент, который вам нужен. Этот продвинутый индикатор предлагает детализированный визуальный анализ волн объема и точек разворота, помогая вам лучше понять соотношение усилий и результатов на рынке. Основные функции Weis Wave Box: Настраиваемые Волны Объема: Регулируйте волны объема в тиках в соответствии с вашими торговыми стратегиями. Настраиваемая История:
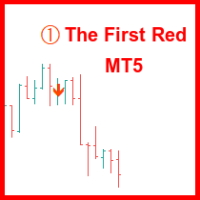
Индикатор "The First Red", основанный на стратегии, созданной Дарьюшем Дарго, предназначен для идентификации и пометки свечей на графике, которые соответствуют условиям стратегии "The First Red" и её расширений, таких как "Second Red", "First Green" и "Second Green". Стратегия сосредоточена на анализе локальных экстремумов и сигналов осциллятора MACD. Первая красная свеча: Свеча отмечается как "First Red", если она достигает локального максимума, а гистограмма MACD меняет направление на нисходящ

Индикатор TickCounter осуществляет подсчет тиков вверх и вниз на каждом новом баре. Подсчет начинается с момента установки индикатора на график. Столбики гистограммы отображают: Желтые столбики - общее количество тиков; Синие столбики - тики ВВЕРХ; Красные столбики - тики ВНИЗ. Если синий столбик не виден, значит тиков вниз больше и красный столбик отображается поверх синего (красный слой выше синего). MT4 version: https://www.mql5.com/en/market/product/82548 Каждая переинициализация ин
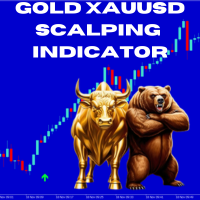
Gold XAUUSD Scalping Indicator The Gold XAUUSD Scalping Indicator is a powerful trend-following tool crafted for traders who specialize in scalping. This indicator is optimized for the M5 timeframe , ensuring precise signals, but it is also versatile enough to be used on M1 and M15 charts to suit various trading strategies. Key Features Trend-Following Accuracy : Identifies high-probability buy and sell opportunities by analyzing trend direction effectively. Multi-Timeframe Compatibility : Best

С помощью этого инструмента можно быстро проанализировать структуру рынка и воспользоваться важными ценовыми уровнями.
Структура рынка
Этот пользовательский индикатор отображает важные ценовые уровни, которые можно использовать в качестве точек входа или целей получения прибыли.
Определение торгового диапазона Скальпировать с помощью этого индикатора можно, ориентируясь на точки разворота рынка.
Возможности торговли на прорывах Используйте этот индикатор для определения возможностей прор

Users of PVRSA / PVA certainly already know the Dragon indicator and its use.
The Dragon works as dynamic support and resistance and can be used for scalper or trend follower.
In addition to the Dragon we have the WGT (fast) and EMA (slow) averages that can show immediate movement and also trend movement.
Stay tuned for the Dragon's inclination!
The indicator can be used on any asset/currency pair and can be customized according to the trader's interest.
See also my volume analysis indicato

Индикатор подкрашивает свечи относительно дельты их объёмов. Вычисление дельты свечей производится на основе тиковой истории либо ленты сделок (см. далее описание входной переменной "Volumes").
Подкраска производится по двум параметрам : по знаку дельты, как цвет свечи, по значению дельты, как контрастность цвета свечи на фоне цвета окна графика.
Помимо подкраски свечей индикатор также отображает профиль дельты на промежутке, который задаётся пользователем между двумя вертикальными линиями. По

Camarilla Pivot Points is a math-based price action analysis tool that generates potential intraday support and resistance levels. Pivot price values are stored in output buffers within this indicator, enabling any Expert Advisor to utilize this indicator's data for trading purposes. This indicator offers the potential for developing numerous strategies. To explore some of these strategies, please visit the following websites: https://www.babypips.com/forexpedia/camarilla-pivot-points https:

Индикатор FFx Patterns Alerter дает торговые рекомендации по входу в рынок, по уровням TP 1, TP 2 и SL на основе любого из выбранных паттернов (PinBar, Engulfing, InsideBar, OutsideBar) Предлагаются следующие варианты: Для работы с несколькими парами можно запускать несколько экземпляров индикатора на одном графике. Рекомендации по входу - количество пипсов, которые будут добавлены после пробоя для входа в рынок 3 различных варианта расчета SL - по пипсам, с использованием множителя ATR или по м

PipTick Correlation отображает текущую корреляцию между выбранными инструментами. Настройки по умолчанию установлены на 28 валютных пар, золото и серебро, но индикатор может сравнивать любые другие символы.
Интерпретация индикатора Положительная корреляция (выше 80 %) Отрицательная корреляция (ниже -80 %) Слабая корреляция/корреляция отсутствует (между -80 и 80 %)
Основные характеристики Индикатор показывает текущую корреляцию между выбранными символами. Простое сравнение одного символа с друг

Переключение между графиками для анализа рыночных трендов на нескольких таймфреймах быстро становится утомительной задачей.
Нахождение конвергенции (согласованности между таймфреймами) является важным элементом для принятия обоснованных торговых решений. Этот инновационный индикатор упрощает процесс, позволяя видеть тренды на нескольких более низких таймфреймах прямо с графика более высокого таймфрейма. С помощью этого индикатора вы можете одновременно отслеживать четыре настройки Хейкен Аши,

Boom and Crash Gold miner v2 Trading indicator based on market momentum works on m1 for boom and crash 1000 and M5 time frame for normal trading pairs wait for blue arrow to appear plus change of candle stick color and candlesticks must be above the 2 modified moving averages then you can buy the market. wait for orange arrow to appear plus change of candle stick color and candlesticks must be below the 2 modified moving averages then you can sell the market.
MetaTrader Маркет - лучшее место для продажи торговых роботов и технических индикаторов.
Вам необходимо только написать востребованную программу для платформы MetaTrader, красиво оформить и добавить хорошее описание. Мы поможем вам опубликовать продукт в сервисе Маркет, где его могут купить миллионы пользователей MetaTrader. Так что занимайтесь только непосредственно своим делом - пишите программы для автотрейдинга.
Вы упускаете торговые возможности:
- Бесплатные приложения для трейдинга
- 8 000+ сигналов для копирования
- Экономические новости для анализа финансовых рынков
Регистрация
Вход
Если у вас нет учетной записи, зарегистрируйтесь
Для авторизации и пользования сайтом MQL5.com необходимо разрешить использование файлов Сookie.
Пожалуйста, включите в вашем браузере данную настройку, иначе вы не сможете авторизоваться.