Смотри обучающее видео по маркету на YouTube
Как купить торгового робота или индикатор
Запусти робота на
виртуальном хостинге
виртуальном хостинге
Протестируй индикатор/робота перед покупкой
Хочешь зарабатывать в Маркете?
Как подать продукт, чтобы его покупали
Платные технические индикаторы для MetaTrader 5 - 61

Точки входа, предоставляемые индикатором Olo May, следует рассматривать как потенциальные моменты изменения направления рынка. Этот индикатор основан на использовании циклически-волновой зависимости, что делает каждую точку входа оптимальной для выявления изменений движения. Самый простой способ использования этого индикатора - открытие позиции в направлении текущего тренда. Однако наилучшие результаты достигаются при комбинировании его с фундаментальными новостями, так как он может использовать

Этот индикатор технического анализа позволяет с высокой вероятностью определить, преобладает ли на рынке тренд или плоскость. Он может использоваться как для торговли внутри канала, так и для торговли на пробой, при условии использования стоп-лоссов для защиты от ложных сигналов.
Индикатор отображает канал в виде линий, расположенных выше и ниже цены, как и другие подобные индикаторы. Верхняя и нижняя линии также могут выступать в качестве уровней сопротивления и поддержки.
Он достаточно точн

Определение текущего рыночного тренда - ключевая задача для успешной торговли. Именно для этой цели был разработан индикатор Book Scheme, который представляет собой передовой алгоритм для наглядного отображения тренда на графике. Многие трейдеры мечтали о наличии надежных скользящих средних, которые не отставали от рынка. Именно эту мечту я превратил в реальность с помощью моего индикатора. Book Scheme позволяет предсказывать будущие значения и создавать точные сигналы для входа и выхода из рынк

Descubra o poder do nosso indicador de alta precisão, projetado para identificar as regiões de alvo e exaustão de qualquer ativo. Testado e validado por mais de 3 anos nos mercados de mini dólar e mini índice, ele oferece confiabilidade e eficácia incomparáveis. Transforme sua estratégia de trading e alcance novos patamares de sucesso com nossa ferramenta inovadora.

Evaluate operational viability in each timeframe and in any instrument, according to their respective spread and percentage volatility, which are essential for correct risk management in your trades.
This indicator is essential for both Day Traders and Swing Traders, as in addition to evaluating operational viability in each timeframe, it is also possible to identify the fair minimum stop for each period and instrument.
Example in Swing Trade: your broker charges a spread equivalent to 0.05%
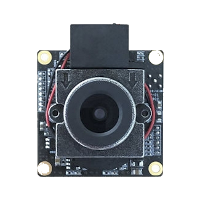
Индикатор Oriole разработан для выявления ценовых тенденций и позволяет быстро определить не только направление тренда, но и уровни взаимодействия покупателей и продавцов. Он функционирует на всех таймфреймах и валютных парах.
Индикатор Oriole предоставляет достаточно точные сигналы и может использоваться как на трендовых, так и на флетовых рынках. Рекомендуется применять его в сочетании с другими инструментами для получения более надежных сигналов и принятия обоснованных решений.
Индикатор н

Индикатор Market Matrix - это эффективный инструмент для определения трендов на рынке Форекс. Он служит надежным помощником для трейдеров, помогая выявить зоны тренда и флета. Ниже представлены основные характеристики и преимущества данного индикатора:
Особенности индикатора Market Matrix: Надежность и стабильность: Индикатор не перерисовывает предыдущие значения, что обеспечивает стабильность сигналов. Быстрая реакция на изменение тренда: Алгоритм индикатора позволяет оперативно реагировать н
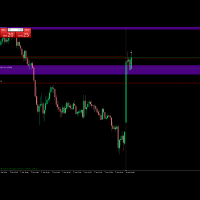
Your average price indicator for the position you were looking for. This indicator inserts a horizontal line on your chart when you are positioned, long or sold, after completing the partial. After completing the partial, it inserts the horizontal line on the graph visually showing where the true BreakEven of the operation is. Take a look the line of point 0 of operation.
OBS: This indicator only works in Netting Account.
Seu indicador de preço médio da posição que estava procurando. Este indi
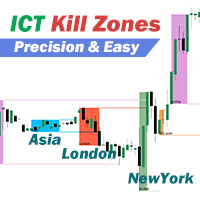
ICT killzones - это определенные временные периоды на рынке, во время которых объем торгов и волатильность часто увеличиваются. Для того чтобы помочь трейдерам получить полное понимание ситуации на рынке и лучше сформулировать торговые стратегии, мы разработали индикатор торговой сессии. Все 5 killzones настраиваются с помощью собственных цветов и таймфреймов, их можно точно настроить на свой вкус или перенастроить на совершенно другой часовой пояс. Индикатор будет автоматически отслеживать изме

StochastiX is an extension of a well-known indicator.
1) StochastiX is displayed in the range of -100 to 100.
2) A histogram is calculated from the difference of the main and signal curves - again as a stochastic, but without smoothing.
The histogram gives the user a hint about the dynamics of oscillator changes. Patterns need to be studied from real graphs.
I wish you successful trading.

Why the RSI Alert Indicator is Essential for Your Trading Toolkit
In the fast-paced world of trading, timely and accurate information is crucial. The RSI Alert Indicator is a powerful tool designed to help you stay ahead of the market by providing real-time alerts when the Relative Strength Index (RSI) reaches critical levels. Whether you're a novice trader or a seasoned professional, this indicator can significantly enhance your trading strategy by pinpointing potential market reversals with
The Order Imbalance indicator, crucial in the toolkit of traders and market analysts, serves to highlight significant disparities between buy and sell orders within a specific financial asset. Essentially, it reveals the difference in volume between buy and sell orders over a defined period, typically in short, frequent intervals ( You can choose the frequency ). For traders, Order Imbalance can be interpreted as a signal of buying or selling pressure in the market. A positive imbalance, where s

Индикатор тренда Onion — это революционное решение для торговли по трендам и фильтрации рыночных данных, объединяющее все важные функции инструмента тренда в одном инструменте! Он отлично подходит для любого трейдера, будь то Форекс или бинарные опционы. Никаких настроек не требуется, всё оптимизировано временем и опытом, эффективно работает как в условиях флета, так и при тренде.
Индикатор тренда Onion — это инструмент технического анализа финансовых рынков, который отражает текущие отклонени

The indicator identifies critical support and resistance areas. It also can give alerts and notifications to your mobile. A lot of customization options are available:
You can have different timeframe on your current chart. For example, if your current chart timeframe is H1, you can assign the indicator timeframe to M15.The indicator identifies critical support and resistance areas. It also can give alerts and notifications to your mobile. A lot of customizations are available. There is an optio

Индикатор Supernova Momentums упрощает визуальное восприятие ценового графика и сокращает время на анализ: если сигнал отсутствует, сделка не открывается, а при появлении противоположного сигнала рекомендуется закрыть текущую позицию. Этот стрелочный индикатор разработан для определения тренда.
Supernova Momentums реализует стратегию торговли по тренду, обеспечивает фильтрацию рыночных шумов и включает все необходимые функции в одном инструменте. Его работа основана на автоматическом определен

Индикатор Dorian - это интуитивный инструмент для определения текущего рыночного тренда. Он основан на простой визуализации в виде двухцветных линий, что делает его удобным для использования как начинающими, так и опытными трейдерами.
Этот индикатор не только помогает определить направление тренда, но и служит ценным советником для принятия решений о входе в рынок или закрытии позиций. Благодаря своей простоте и эффективности, Dorian рекомендуется для трейдеров любого уровня опыта.
Интерпрета
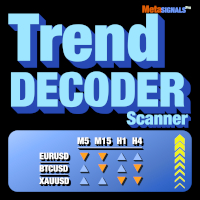
Получайте сигналы TrendDECODER для нескольких активов и нескольких временных единиц | Определите лучшую временную единицу для входа | Максимизируйте свою прибыль и выигрышные сделки Индикатор и скринер без перерисовки и задержки - идеален для ручной и автоматической торговли - для всех активов и всех временных единиц. 49$ за первые 50 копий - затем 99$ . После покупки, пожалуйста, оставьте комментарий или отзыв, и мы отправим вам ДОПОЛНИТЕЛЬНЫЙ индикатор стоимостью 99$.
О чем это?
Этот скрин

Powerful Order Block indicator in Tradingview platform. Indicator type: Price Action indicator Introduction: The Order Block Indicator - Elevating Your Price Action Analysis. If you're seeking a comprehensive Order Block indicator on the MQL5 platform, look no further.
Firstly, according to this indicator, an OB is understood as a zone of pending orders from large institutions that haven't been fully executed, revealing themselves in the market through subtle signs. Prices react strongly when

Індикатор Lumina Parallax разработан на основе оригинальных индикаторов поиска экстремумов и отлично подходит длЯ определениЯ разворотов или резких движений цены в одну из сторон. ‘ помощью этого индикатора вы сможете заранее знать о таких изменениЯх, так как он уведомит вас поЯвлением синей точки для покупки и красной для продажи‚ своей основе индикатор использует процесс выЯвлениЯ скорости изменениЯ роста цены, что позволЯет находить оптимальные точки входа и выхода с рынка.
Індикатор Lumina

Swing Sentry — это передовой технический индикатор, специально созданный для трейдеров на рынке Форекс. Он работает на основе уникального алгоритма, который позволяет прогнозировать будущие цены, анализируя исторические данные за указанный пользователем период.
Индикатор предоставляет трейдерам ценную информацию о возможных изменениях в направлении движения цены. Специальная формула, лежащая в основе работы Swing Sentry, точно рассчитывает сигналы, эффективно определяя моменты разворота или

Индикатор Rising представляет собой полноценную торговую систему, обрабатывающую данные от нескольких технических инструментов. Появление его сигналов – это результат сложных вычислений. Индикатор самостоятельно оценивает силу рыночных сигналов и указывает на смену направления, уведомляя об этом трейдера, который затем принимает торговое решение. Этот индикатор функционирует на всех таймфреймах. Важно понимать, что любой индикатор – это лишь визуальное представление сигнала. Валютные пары никог

Introduction The “RSI Continuous Detection” is an innovative trading indicator developed by TvT Trading. It integrates the principles of the Average Directional Index (ADX) and the Relative Strength Index (RSI) to analyze market trends and pinpoint potential profitable entry points for traders. Our observations indicate that during a trend, prices typically retract temporarily before continuing in the direction of the prevailing trend. This insight forms the basis of our “RSI Continuous Detectio

Триллиантовый индикатор тренда.
Trilliant тренд является передовым форекс индикатор, который сочетает в себе скрытые уважаемые индикаторы для раннего обнаружения тренда. Как указывает название, это индикатор тренда, но встроенный в торговле практически всеми стратегиями форекс (все в одном), манипулируя настройками, лентами и линиями в индикаторе.
КАЖДОЙ форекс стратегии можно торговать с использованием триллионный тренд. Условия выполнены, когда формирующие свечи касаются триллиантовой верх

Предлагаю попробовать торговлю по индикатору Bph всем, кому это интересно.
Bph – это инструмент технического анализа, который использует математические вычисления для определения различных аспектов движения цен, основываясь на исторических данных. Индикатор работает на принципе циклично-волновой зависимости, что позволяет находить оптимальные точки входа, где изменяется направление движения цены. Bph выявляет ключевые аспекты движения цены, помогая трейдерам принимать обоснованные решения. Все

Terra Infinity — индикатор флета.
Эта улучшенная версия индикатора CalcFlat имеет три дополнительные линии, значительно повышающие его эффективность. В отличие от своего предшественника с двумя статическими уровнями, Terra Infinity добавляет три динамические линии над основной гистограммой, которые интерпретируются следующим образом:
базовая сигнальная линия, минимальная сигнальная линия, максимальная сигнальная линия. Эти линии формируются с помощью дополнительного параметра Avg, представляю
This is a multi time frame Support and resistance indicator which works on all forex pairs and commodities. Users can also see the historical support and resistance levels which got taken out . For Major Forex pairs like EURUSD, GBPUSD, USDCAD , USDCHF, NZDUSD, AUDUSD, EURCHF enable the s&r levels from 5 minutes from the settings. (Lower timeframe snr levels may act as as noise for major currency pairs.) For Gold and Silver enable all timeframe s&r levels.
Results may vary from broker to bro
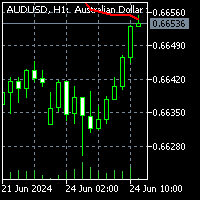
To download MT4 version please click here .
- This is the exact conversion from TradingView: "Chandelier Exit" By "everget". - This is a non-repaint and light processing load indicator - input options related to coloring and labels are removed to fit into MetaTrader graphics. - Buffers are available for processing within EAs. - You can message in private chat for further changes you need.

Indicator Description This indicator displays the highest and lowest prices for the previous day, week, and month. Additionally, it shows pivot levels calculated using different methods: Standard, Fibonacci, Woodie, Camarilla, and Floor pivots. Features: Previous Day High/Low: Indicates the highest and lowest prices of the previous trading day. Previous Week High/Low: Indicates the highest and lowest prices of the previous trading week. Previous Month High/Low: Indicates the highest and lowest p

Jabidabi Session Indicator The Market Session Indicator is a powerful tool used by traders to identify and track different trading sessions within the forex and stock markets. It visually highlights key trading periods, such as the Asian, European, and North American sessions, directly on the trading chart. This indicator is especially useful for traders who follow ICT (Inner Circle Trader) strategies, which emphasize the significance of various market sessions for optimal trading opportunities.
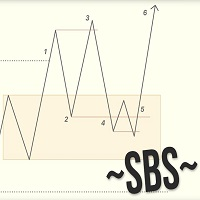
Swing Breakout Sequence | SBS presents a comprehensive trading strategy designed to help traders identify and capitalize on market swings and breakouts. The Swing Breakout Sequence (SBS) strategy is built around a series of well-defined steps to optimize trading decisions and improve profitability. Version 2.01: Add "golden entry" - entry by fib. Stoic added to it (fibo) he calls this setup gold SBS here is the video the description of the setup starts at 18min24sec Version 2: + Add BOS filter .

Наш новый индикатор является важной частью системы Smart Money Concept (SMC) Он использует современное видение рынка и быстрые методы расчета. В результате трейдер имеет полную картину торговли в каждый момент времени, что делает процесс получения результата легче и быстрее.
Наш новый индикатор Smart Money Concept отображает следующие важные паттерны: Order Blocks . Imbalance – Fair Value Gap (FVG). Break Of Structures (BoS). Change of character (CHoCH). Equal highs & lows. Premium , Equilibriu

Подписывайтесь на канал MA7 Trading для получения уведомлений о новых программах, обновлениях и другой информации. Задавайте вопросы через профиль на MQL5 .
Описание работы Индикатор MA7 Moss основан на стандартном индикаторе Accelerator Oscillator (AC). Показывает зоны перекупленности и перепроданности. Подробная информация о индикаторе MA7 Moss .
Настройки индикатора General settings – общие настройки: Upper level – верхний уровень; Lower level – нижний уровень.
Message settings – настройк
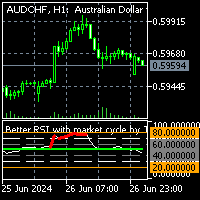
To get access to MT4 version please click here . This is the exact conversion from TradingView: " Better RSI with bullish / bearish market cycle indicator" by TradeCalmly.
The screenshot shows similar results from tradingview and Metatrader when tested on ICMarkets on both platforms. This is a light-load processing and non-repaint indicator. All input options are available. Buffers are available for processing in EAs. You can message in private chat for further changes you need.

IMPORTANT: The indicator will remain at the price of $34.90 until the release of the update scheduled for July 16, 2024. The New Price will be $49.90 (taxes excluded) FVG indicator. If you are an SMC trader this indicator will be very useful to you, it automatically identifies the FVGs on the graph distinguishing them into 2 types: bearish FVGs and bullish FVGs (see the photos to understand better). This indicator works on any Timeframe and on any market you want to use it. If you are interested

RSI OverZone: Enhancing Trading Accuracy RSI OverZone is a trading tool designed to optimize the use of the Relative Strength Index (RSI) by dynamically adjusting its values to identify overbought and oversold conditions. Here’s how it works: Higher Timeframe Analysis: RSI OverZone leverages higher timeframes to determine the current trend. By doing so, it aims to maximize profitability. We recommend using the H1 (1-hour) and D1 (daily) timeframes for trend analysis. Trend as Our Guide: Recogni

Highs, Lows and Bos Indicator for MT5; The indicator works on any type of market and on all TimeFrames. It also works on the MetaTrader5 Tester. the main function of the indicator is to identify the highs and lows by marking them with a point above/below the candle, then with a horizontal line it marks the Bos. It is very simple and intuitive, there are only 2 inputs: -the color of the maximums -the color of the minima
For any other information do not hesitate to contact me.

Price Action Scanner is an indicator that identifies price behaviors and provides alerts. This indicator can simultaneously detect signals for up to 6 different symbols across various timeframes. By setting a separator, you can add different symbol names and timeframes.
The indicator can detect multiple common signal types such as Pinbar, Engulfing Pattern, Inside Bar, Morning Star, Evening Star, Fakey, and display corresponding information in separate subcharts, indicating the direction of th

Price Action Scanner Pro is an indicator that identifies price behaviors and provides alerts, offering more features and customization compared to Price Action Scanner. This indicator can simultaneously detect signals for up to 15 symbols across different timeframes. You can configure it to detect signals during specific trading sessions such as Asian, European, and US sessions, using different timeframes. This allows you to use lower timeframes for active trading periods and higher timeframes

Объем и MarketProfile Pro Описание: Индикатор MarketProfile предоставляет точный и детализированный анализ торгового объема по различным уровням цен. Он рассчитывает и отображает профиль объема для каждого торгового дня, помогая вам понять структуру рынка и распределение объема для принятия обоснованных торговых решений. Основные характеристики: Ежедневный анализ объема: Индикатор рассчитывает и отображает профиль объема для каждого торгового дня, позволяя вам легко определить распределение объ

The SuperTrend MTF indicator is an excellent trend tracking indicator . It can not only display SuperTrend trends within the timeframe of the chart, but also set up to display SuperTrend trends for larger time frames simultaneously . This will be beneficial for grasping trends at a larger time scale and predicting future trends . At the same time, the price of the trend line can also be displayed at a glance, making it easy to observe.
Input parameters :
ATR period used at chart timeframe
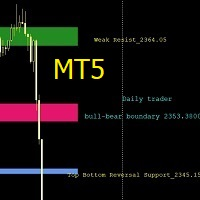
Support and Resistance Levels is an intelligent indicator that displays horizontal support and resistance levels, suitable for traders of different trading frequencies. You can select your preferred trading frequency, and the indicator will automatically calculate the support and resistance levels relevant to that frequency. Among these, the Bull-Bear Line is an interval used to distinguish the strength of bullish and bearish forces, and is an important level.
You can combine it with other ind

Индикатор для синтетических индексов Boom и Crash Индикатор будет продан в ограниченном кол-ве. Представляем вашему вниманию технический индикатор, разработанный специально для работы с синтетическими индексами Boom и Crash от брокера Deriv. Этот инструмент предназначен для трейдеров, предпочитающих методичный подход к торговле с четко определенными ценовыми уровнями.
Функциональность индикатора: • Отображение ключевых ценовых уровней для входа в позицию • Индикация уровней для усредн
The Reversal Candlestick Structure indicator detects multiple candlestick patterns occurring when trends are most likely to experience a reversal in real-time. The reversal detection method includes various settings allowing users to adjust the reversal detection algorithm more precisely.
A dashboard showing the percentage of patterns detected as reversals is also included. USAGE Figure 1 Candlestick patterns are ubiquitous to technical analysts, allowing them to detect trend continuation
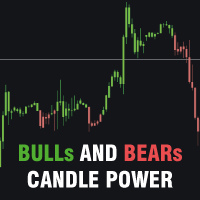
Bulls and Bears trend Power
The Bulls and Bears trend Power is a no repaint versatile technical analysis tool that helps traders identify market trends and see who's in control. It features dynamic trend capture logic that adapts to market conditions for a clear visual representation of trend direction. Traders can customize the colors to suit their preferences.
Features : Trend identification Compensation of market noise by strength of sellers or buyers
Recommendations : Use H1 timeframe a
The DYJ SignalSource WPRBashboard signal source is based on the WPR indicator information dashboard It can be used for any currency pair and time frame.
WPR suggests that a metric value between 80% and 100% indicates oversold in the market The indicator value between 0 and 20% indicates that the market is overbought.
The entry signal of this indicator is a turning point in the trend.
It provides reverse trend selection direction.
This indicator uses simulated trading techniques.
It provide

Благодаря техническим и логическим манипуляциям брокерской компании, я прошел долгий путь, чтобы вывести этот индикатор, который объединяет многочисленные стратегии, обладающие следующими возможностями:
Определение рыночного тренда: понимание общего тренда рынка.
Точки разворота: определение потенциальных точек, в которых рынок может изменить направление.
Точки входа и выхода: определение оптимального времени для входа и выхода из сделок.
Для полного понимания того, как использовать этот ин
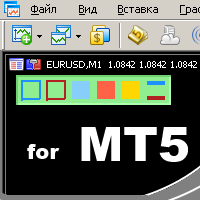
удобный инструмент для тех, кто использует технический анализ с использованием таких инструментов, как Трендовая линия и Прямоугольник. Имеется возможность настройки двух пустых прямоугольников, трех закрашенных и двух трендовых линий. Настройки индикатора крайне просты и делятся на пронумерованные блоки: С цифрами 1 и 2 вначале - настройки пустых прямоугольников (рамок); С цифрами 3, 4 и 5 - настройки закрашенных прямоугольников; С цифрами 6 и 7 - настройки трендовых линий. Объекты создаются оч

To get access to MT4 version please click here . This is the exact conversion from TradingView: " WaveTrend" by LazyBear.
This is a light-load processing and non-repaint indicator. All input options are available. Buffers are available for processing in EAs. You can message in private chat for further changes you need. The filling area option is omitted to fit into MT5 graphics.

Индикатор Индекса Силы Валюты (Currency Strength Index - CSI) ПЕРЕД АКТИВАЦИЕЙ ИНДИКАТОРА НЕ ЗАБУДЬТЕ УСТАНОВИТЬ "TRUE" ДЛЯ ОТОБРАЖЕНИЯ ПАР Индикатор Индекса Силы Валюты (Currency Strength Index - CSI) — это мощный инструмент, используемый в торговле на Форекс для измерения относительной силы основных валют. Этот индикатор помогает трейдерам определить самые сильные и слабые валюты в любой момент времени, что позволяет принимать более обоснованные торговые решения. Основные характеристики: Сравн

The Bollinger Bands Dashboard indicator offers a convenient and informative way to track Bollinger Bands indicator signals on different timeframes using one panel (Dashboard). This tool allows traders to quickly and easily obtain the information they need, enabling efficient decision-making in the market.
Main characteristics:
1. **Signals Panel**: The Dashboard displays Bollinger Bands signals for selected timeframes, providing users with clear and structured information. 2. **Flexibility in
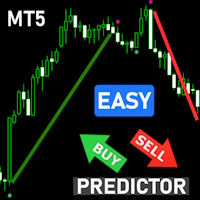
Overview: Elevate your trading strategy with the Advanced SuperTrend Buy Sell Signals Indicator! Designed for both novice and professional traders, this indicator provides clear and accurate buy/sell signals based on the popular SuperTrend algorithm, enhanced with customizable parameters and visual alerts. Features: Clear Trend Visualization: Identifies UpTrends (green line) and DownTrends (red line) with precision. Customizable Parameters: Adjust ATR period and multiplier to fit your trading s
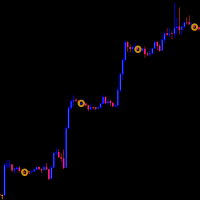
The Daily Closing Price Indicator marks the closing prices of previous days to easily spot them during chart analysis.
Features: -Available for MT5 only -Applicable in all instruments -Applicable in all timeframes
https://c.mql5.com/31/1144/daily-closing-price-indicator-screen-9611.png https://c.mql5.com/31/1144/daily-closing-price-indicator-screen-1492.png
https://c.mql5.com/31/1144/daily-closing-price-indicator-screen-5676.png
Parameters: https://www.mql5.com/data/temp/7867750/38bze8eu30

Синие и красные уровни поддержки и сопротивления отображаются прямо на графике.
Оповещения о закрытии выше сопротивления и закрытии ниже поддержки.
По умолчанию: EnableNativeAlerts = ложь;
EnableEmailAlerts = ложь;
EnablePushAlerts = ложь;
Действительно легко торговать. Нет лучшего места, чем торговля SR! Отказ от ответственности: Поддержка возникает там, где ожидается приостановка нисходящего тренда из-за концентрации спроса. Сопротивление возникает там, где ожидается временная приостан

Изменение тренда > Стрелки («Вверх» и «Вниз»)
Когда в индикаторном буфере появляется значок («Вверх» или «Вниз»), срабатывают оповещения.
Вы можете использовать 200 EMA, чтобы уменьшить количество ложных сигналов.
Войдите в сделку, когда появится стрелка, но подождите, пока свеча закроется.
Закрывайте сделку при изменении цвета линии или используйте собственную стратегию закрытия.
Работает на всех таймфреймах
Работает на всех валютах
Примечание лучше работает с другими индикаторами или

Insight Pro is a comprehensive tool for market analysis. It offers various features such as trend analysis, resistance and support levels, and distribution analysis, suitable for both novice and experienced traders. Features Trend Analysis Detects and visualizes market trends. Suggests potential entry and exit points based on trends. Customizable trend lines for clear market direction. Displays extreme levels based on standard deviation. Positive slope indicates buy orders; negative slope indic

the Spike detector show multiple indication for entries, for max profits enter on each indication given u can also add on lots size as entries go to secure max profits before spike occure, the more entries you enter along the way ,the more profits u have after the initial spike, after spike hold 3-5 candles before close for max profits . good on al timeframes max stop loss is 22candles.

ObieTrader представляет собой индикатор краткосрочных сигналов. Используется для внутридневной торговли. ObieTrader определяет краткосрочный тренд, используя индикатор процента R Уильямса и средний истинный диапазон. Когда индикатор подтверждает краткосрочный тренд, он отображает на столбце семафоры, показывающие тренд. Столбцы с красными точками указывают на нисходящий тренд, а столбцы с синими точками указывают на восходящий тренд.
Когда тренд определен, открывайте позиции в направлении трен

RSI Divergence Signal
The RSI Divergence Signal is a technical analysis tool used in financial markets to identify potential trend reversals. It compares the Relative Strength Index (RSI) with price action to detect divergences. When the RSI moves in the opposite direction of the price, it signals a potential change in momentum, suggesting that the current trend may be weakening. This divergence can indicate a buying opportunity in a downtrend or a selling opportunity in an uptrend. Traders u

Magnified Price Experience trading like never before with our Magnified Price indicator by BokaroTraderFx , designed exclusively for MetaTrader 5. This revolutionary tool provides traders with instant insights into price movements, offering a clear advantage in today's fast-paced markets.
Key Features: 1. Real-time Precision: Instantly magnify price action to uncover hidden trends and patterns. 2. Enhanced Visibility: Clear visualization of price movements with adjustable zoom levels. 3. User

Наш индикатор BOOM SELL ALERT специально разработан для анализа свечей на BOOM 1000. BOOM 500 — это инструмент, оптимизированный для таймфрейма M1 (1 минута), гарантирующий получение своевременной и действенной информации. Индикатор представляет собой комбинацию многих индикаторов. - АО-осциллятор - Стохастик КАК ИСПОЛЬЗОВАТЬ ЭТОТ ПОКАЗАТЕЛЬ Чтобы хорошо использовать этот индикатор, необходимо использовать SCHAFF TREND RSX (5 MIN OR M5). ЕСЛИ тренд SCHAFF RSX ЗЕЛЕНЫЙ, и у вас есть сигнал, тогда
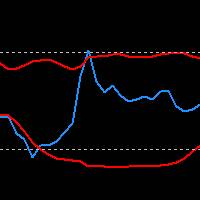
RSI Indicator with Bollinger Bands: Maximize Your Win Rate with Precision and Advanced Trading Strategies Take your trading to the next level with the RSI Indicator combined with Bollinger Bands. Customize the RSI period, band moving average, and deviation to tailor the indicator to your unique strategies. Upon request, we also offer the possibility to customize or create bespoke indicators to best meet your trading needs.
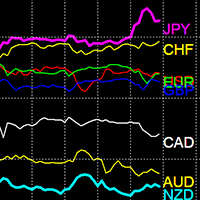
Индикатор силы валюты
Индикатор силы валюты — мощный инструмент для выявления тенденций. Он сравнивает силу и слабость различных валют и позволяет легко находить трендовые валютные пары.
Цена продажи: 49 долларов США.
Функции
Эффективно различает сильные и слабые валюты Автоматически определяет трендовые валюты Мультитаймфрейм Загружает 28 валютных пар Оптимизирована производительность
Использование индикатора Сильные валюты. Валюты выше 80 считаются сильными. Слабые валюты: Валюты ниже 20

If you like this project, leave a 5 star review.
Follow on TikTok: @quantum.trader
[ Any Symbol Can Be ADDED ] DM me for adding any Pair symbol, crypto, index, stock or anything related. you can also DM me in TikTok [@quantum.trader] Works on [ EURUSD-GBPUSD-GBPJPY-USDJPY-XAUUSD-US30-BTCUSD-ETHUSD-SOLUSD ]
This indicator calculate and draw the Prediction or Forecast the peaks of the current day ( forecast high - forecast low - forecast middle - forecast upper q - forecast lower q

Rivoluziona il Tuo Trading con l'Indicatore di Segnali Scalping su Timeframe Multipli Scopri il segreto del successo nel trading con il nostro esclusivo indicatore di SEGNALI scalping su timeframe multipli. Questo strumento avanzato è progettato per trovare segnali efficienti e precisi, aiutandoti a massimizzare i profitti e a ridurre i rischi associati al trading veloce L'indicatore di segnali Alien Scalper MTF è uno strumento di analisi tecnica altamente efficace, progettato per identificare
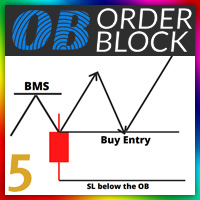
Orde Block Detector: The order block detector can automatically identify the breakthrough of the market structure. After the trend framework breaks through, the order block area can be drawn automatically. In order to draw the OB area more accurately, we also automatically find the candle on the left and right sides of the original candle according to its trading principle, and draw a more accurate ob area through more subtle quantitative rule judgment. Futures : 1. Customize the BMS color, a

The ICT Propulsion Block indicator is meant to detect and highlight propulsion blocks, which are specific price structures introduced by the Inner Circle Trader (ICT). Note: Multiple Timeframe version avaiable at here
Propulsion Blocks are essentially blocks located where prices interact with preceding order blocks. Traders often utilize them when analyzing price movements to identify potential turning points and market behavior or areas of interest in the market.
USAGE (fingure 1)
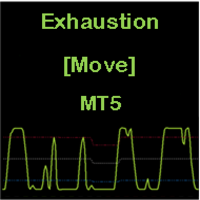
CONSTITUTION Exhaustion [Move] is an indicator consisting of an oscillator and three dynamic levels (upper, middler, lower). The inputs can be used to adjust the oscillator, dynamic levels and warning signals. It is designed for the MT5 platform only. APPLICATION This indicator should be used with a trend filter [e.g. moving averages, MA 200]. It detects the exhaustion of correction movements within a trend, thus giving entry points for new trades. It is usually used in the RENKO chart for SCA
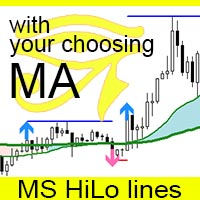
The MS High Low Lines indicator is a tool designed to enhance trend visualization for MT5. It displays high and low prices as lines, using your preferred Moving Average (MA) settings (either SMA or EMA, with customizable periods). The indicator shows configured signals when prices break above or below these MAs. By setting it up with highly functional MAs, traders can better understand market trends and make trades with a statistical edge. You can modify settings and place multiple indicators o

Moving Pivot Average The Moving pivot indicator compares the selected period with its counterpart from the previous period. The indicator uses very flexible algorithm for pivot value calculating. It allows you to allocate in days a certain time intervals (custom bars) and calculate the average pivot value based on High, Low and Close prices of these bars. How many custom bars will be taken into account is determined by the "Days" setting. The pivot line can be considered an average trend line
A MUST HAVE - NON REPAINT INDICATOR - that will help you to make the decision whether to Buy or Sell , including where to set the Take Profit and Stop Loss . The Buy/Sell signal will not redraw nor repaint until the next new signal occurs. The Take Profit and Stop Loss will change following the market conditions. Our indicator will give alert to your mobile/handphone when new buy/sell signal arrive. For best result, combine this indicator with your knowledge on price action and support & resista
MetaTrader Маркет - единственный магазин, где можно скачать демоверсию торгового робота и подвергнуть его проверке и даже оптимизации на исторических данных.
Прочитайте описание и отзывы других покупателей на заинтересовавший вас продукт, скачайте его прямо в терминал и узнайте, как протестировать торгового робота перед покупкой. Только у нас вы можете получить представление о программе, не заплатив за неё.
Вы упускаете торговые возможности:
- Бесплатные приложения для трейдинга
- 8 000+ сигналов для копирования
- Экономические новости для анализа финансовых рынков
Регистрация
Вход
Если у вас нет учетной записи, зарегистрируйтесь
Для авторизации и пользования сайтом MQL5.com необходимо разрешить использование файлов Сookie.
Пожалуйста, включите в вашем браузере данную настройку, иначе вы не сможете авторизоваться.