Conheça o Mercado MQL5 no YouTube, assista aos vídeos tutoriais
Como comprar um robô de negociação ou indicador?
Execute seu EA na
hospedagem virtual
hospedagem virtual
Teste indicadores/robôs de negociação antes de comprá-los
Quer ganhar dinheiro no Mercado?
Como apresentar um produto para o consumidor final?
Indicadores Técnicos para MetaTrader 4 - 35

QuantumAlert RSI Navigator is a free indicator available for MT4/MT5 platforms, its work is to provide "alerts" when the market is inside "overbought and oversold" regions in the form of "buy or sell" signals. This indicator comes with many customization options mentioned in the parameter section below, user can customise these parameters as needful. Join our MQL5 group , where we share important news and updates. You are also welcome to join our private channel as well, contact me for the pri
FREE

A flexible 2-Line MACD indicator The default MACD indicator inside MT4, limits you to using the MACD with a fast-EMA, slow-EMA, and signal-SMA. This MACD indicator allows you to set your own MA-Method choices for these 3 components, separately! You can select from SMA-EMA-SMMA-LWMA, and can even use a separate method for each 3 fast-slow-signal periods. A more featured version is available with colored candles+conditions, full alerts+conditions, line coloring, DEMA and TEMA options; MACD MAX
FREE

The Channel Builder (CB) or Ivanov Bands indicator is a broad generalization of the Bollinger Bands indicator. First, in CB, the mean line <X> is calculated using various averaging algorithms. Secondly, the mean deviations calculated by Kolmogorov averaging are plotted on both sides of the middle line <X>. The middle line <X>, besides the standard SMA, EMA, SMMA and LWMA averaging algorithms, can be Median = (Max + Min) / 2 sliding median (which is the default). In
FREE

3 strategies with RSI! Alerts! Signal freshness check! The indicator is based on the classic RSI. I recommend watching my advisor - Night Zen EA It includes 3 strategies: Entry of the RSI indicator into the overbought zone (for buy trades) / oversold (for sell trades) Exit of the RSI indicator from the overbought zone (for sell trades) / oversold (for buy trades) Touching the overbought limit (for sell trades) / oversold (for buy trades) The indicator provides alerts. To enable them in the s
FREE
Highly configurable RSI indicator. Features: Highly customizable alert functions (at levels, crosses, direction changes via email, push, sound, popup) Multi timeframe ability Color customization (at levels, crosses, direction changes) Linear interpolation and histogram mode options Works on strategy tester in multi timeframe mode (at weekend without ticks also) Adjustable Levels Parameters:
RSI Timeframe: You can set the current or a higher timeframes for RSI. RSI Bar Shift: you can set
FREE

Screener Breakout Congestion: Have you ever missed a trading opportunity because you were not looking at the chart of that market in that specific time frame? Here is this screener to help you identify congestion breakouts in the markets you want to follow in the different time frames required. Once you have identified the markets (forex, indices, CDF) and the different time frames (1M, 5M, 15M, 30M, 1H, 4H, Daily), the screener is represented by several buttons that change colour when the conge
FREE

Macd Predictor Macd's main chart indicator If you like this indicator , Dinapoli Levels Expansion and Retracement Demo is a helpful tool: https://www.mql5.com/en/market/product/35884
1. You can determine the price at which the MACD will change from buy to sell, and vice versa. It is the cousin of the oscillator predictor. If you know a position at the time, then the exact price, current and next (future) columns will need to reach the MACD crossover. You can also see how far the market has t
FREE

You've probably heard about the Dow trend Theory, where higher highs and lows indicate an uptrend, and lower highs and lows indicate a downtrend. This indicator determines this trend based on the Dow Theory. You just need to enter a number representing the number of candles between extremes. The optimal solution is the number 3, unless you want to have the trend from M5 but you're on M1, then you need to multiply this number by 5. Check various combinations to trade with the trend. In the scree
FREE

Harami is a two candle pattern with recent candle formed inside the previous candle's high and low . It represents indecision in the market and is used for breakout price action trading strategy. This indi fires all signals to a dashboard on the chart including pop_up alert, push to phone notification and email. Harami has two types, bullish and bearish pattern. Enter long for bullish Harami and enter short for bearish Harami. Inputs : Currency Symbols: EURUSD,GBPJPY,USDJPY,USDCAD (default) , u
FREE

The indicator displays the signals of the RSX oscillator on the price chart. (To display these signals in a separate window, along with the oscillator, another indicator is used - RSX Osc 4 AM ). It is optimal to use the indicator signals as signals to open a trade when the price overcomes the maximum or minimum of the bar at which the signal was given. An opposite signal cancels the previous signal.
Settings: Data period for indicator calculation - data period for indicator calculation; Data
FREE

Fractal Divergence Channel is based on the fractal divergence patterns , representing them in the form of a channel with the borders changing the moment the next pattern appears. The upper border of the channel corresponds to the upper part of the last found bearish fractal divergence pattern. The lower border of the channel is the lower part of the last found bullish pattern (see screenshot 1). Compared to the FractalDivergence_Patterns indicator, the channel version has the same parameters wit
FREE

Double Price Channel Indicador de canal de preço para um determinado número de barras especificadas nas configurações.
As linhas indicadoras representam o suporte dinâmico ou os níveis de resistência. O limite superior é o preço máximo para um determinado número de períodos, o inferior é o mínimo. Ao contrário das médias móveis, que são baseadas em preços de fechamento, o indicador não é “distraído” por pequenas flutuações. Ele será recalculado apenas se os limites mudarem. Se isso acontecer,
FREE

The Sentiment Ratio indicator gauges current Market Sentiment between -100% and 100%, where lower than -40% is considered Bearish and higher than 40% is Bullish. The channel between the two is considered Neutral. The indicator has been a very useful filter tool for signals within a trading system.
Example call function: int SentimentIndicator(double triggerLevel)//Return sentiment if trigger level is activated { double sentimentRatio=iCustom(NULL,0,"Sentiment Ratio",0,0,0); if(sentimentRa
FREE

The Cossover MA Histogram indicator is a simple tool showing the trend based on crossover of moving averages. Simply specify two mobving averages and addicional parameters like MA method and Applied price. When fast MA is above slow MA the histogram is green, indicating an uptrend. When MA fast is below MA slow the histogram is red, indicating an downtrend.
FREE
Mars 12 is a Pullback indicator is a powerful indicator of Pullback trade for any par and any timeframe. It doesn't requires any additional indicators for the trading setup.The indicator gives clear signals about opening and closing trades.This Indicator is a unique, high quality and affordable trading tool. Can be used in combination with other indicators Perfect For New Traders And Expert Traders Low risk entries. Never repaints signal. Never backpaints signal. Never recalculates signal.
Download the USDJPY free version here.
Scalping Strategy
BUY SELL
Having a strategy in the market is one of the main conditions for trading. The presence of various and complicated indicators and tools sometimes makes trading difficult, and the user gets confused after trying various methods and gets stuck in a loss cycle, the result of which is usually clear. This indicator is a simple strategy based on the detection of pivots and short-term trends, which helps you to easily trade i
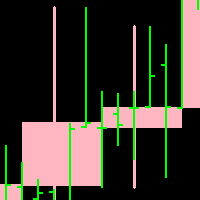
Candleline: candleline indicator. According to the specified period, draw the candle line of the specified period on the current chart. In addition, the new candlelight line is superimposed with the candlelight line of the current chart.
Note: the period of the current chart must be less than the period of the candle line to be drawn.
For the specific effect of self drawing candle line, please see the attached picture below. Parameter: 1.TimeFrame; 2. NumberOfBar; 3.Up candle
FREE

Multi-Asset Forex Scanner
This indicator allows you to scan multiple assets at once, sending you configurable alerts when any asset touches daily pivot levels 1, 2 or 3.
The original code was just modified to send alerts to MT4 Desktop, MT4 Mobile or Email. (Credits for the original code go to Carlos Oliveira)
In order to receive mobile or Email alerts you must configure Notifications and Email sections in the MT4 platform.
In addition to pivots, this indicator also shows ATR, Volume,
FREE
GTAS Power is a momentum indicator that helps to determine deep trends using combination of moving averages. This indicator was created by Bernard Prats Desclaux, proprietary trader and ex-hedge fund manager, founder of E-Winvest.
Description The indicator is represented as a green or red histogram around a 0 equilibrium line.
How to use When GTAS Power is green, deep trend is bullish. When it is red, deep trend is bearish. This indicator can be use as a filter in addition to other GTAS indi
FREE

Introduction and Description
The indicator displays an arrow whenever a " Bearish Engulfing " is detected. The latter usually indicates the beginning of a downward trend. A bearish engulfing pattern is a technical chart pattern that signals lower prices to come. The pattern consists of an up candlestick followed by a large down candlestick that eclipses or "engulfs" the smaller up candle. The pattern can be important because it shows sellers have overtaken the buyers and are pushing the price m
FREE
This oscillator calculates different price/time vectors to plot the aggregate market direction and two moving averages, in order to detect if the market is accelerating or decelerating. [ Installation Guide | Update Guide | Troubleshooting | FAQ | All Products ] Easy to use and understand Acts as a top-quality filter for trades It has a unique speed detection algorithm It is non-repainting and non-backpainting It implements alerts of all kinds It can be used as a top-quality filter for trend tra
FREE

A ratio between 0 and 1 with the higher values representing a more efficient or trending market, It is used in the calculation of Perry J. Kaufman Adaptive Moving Average (KAMA), dividing the price change over a period by the absolute sum of the price movements that occurred to achieve that change. The Fractal Efficiency or also known as Efficiency Ratio was first published by Perry J. Kaufman in his book ‘Smarter Trading‘. This is mostly considered a filter for volatile markets none the less
FREE

This indicator shows in a subwindow the trend in M1, M5, H1, D1 timeframes based on MA, MACD, Stochastic This way you could see in once in different timeframes what happening. This is my first free indicator. Please follow I will put here some more. Thank you for you attention. . . . . .
lfknglkslksnlgslgnsflgjrpoesv ,msv lkrjpfjésmdg sd.npo4wsmdglknsp4jwpkeégmfs.lkmp Thank you
FREE

This indicator displays the signals of a highly effective oscillator - Laguerre Osc 2 AM - on the price chart. The presented indicator uses the Laguerre filter to build an oscillator. The indicator has the possibility of double additional smoothing, which can be useful for small values of the Gamma parameter. The indicator gives three types of signals: Exit of the oscillator from the overbought / oversold zone; The oscillator crossing the middle of the value between the overbought/oversold
FREE
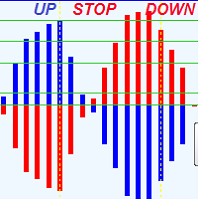
This indicator that shows precise price direction ,and force of this direction, reversals ,added it to any chart and you supress any confusion .
It calculs force of current direction and Predicts price reversals with high degree of accuracy withs its key levels and it is great for scalping , Or swing trading . For any time frame the following behavor is the same : Blue Histogram above 0.0 means that a buyers dominates price movement In other side , Red Histogram Above 0.0 means sellers

Introduction and Description
Colored candlesticks showing the trend based on two moving averages and the slope of the slow moving average. A trend is the overall direction of a market or an asset's price. In technical analysis, trends are identified by trendlines or price action that highlight when the price is making higher swing highs and higher swing lows for an uptrend, or lower swing lows and lower swing highs for a downtrend. Many traders opt to trade in the same direction as a trend, whi
FREE

This indicator displays the moment when the RSI oscillator crosses the zero value, and the moment when the RSI oscillator crosses its smoothed value. Crossing the zero value by the RSI oscillator is a buy/sell signal. If the RSI oscillator crosses its smoothed value, it is a signal of a trend change. The signal is given after the end of the formation of the candle. The signal is confirmed when the price crosses the high/low of the bar on which the signal was given. The indicator does not redraw.
FREE

The Candle High Low Exit indicator uses the highest high and the lowest low of a range to draw trailing stop lines (orange under buys, magenta over sells) that advance with the trend until the trend changes direction. Moreover, the trailing stop lines are generated to support the order’s trend direction (long or short): In an upward trend, the long trailing stop line (orange line under buy) appears and advances upward until the close crosses under the line.
In a downward trend, the short tra
FREE

CCI Trend Finder indicator with different colors at levels 0, 100 and -100. The cross is a signal for "123 Exit" as presented by MPlay and used in Woodies CCI system. This exit signal is effective especially in short-term breakout trades, because it prevents early exiting at small corrections. This indicator is great for having it as an extra tool for your analysis.
FREE

Now there is no need to check volatility on third-party websites in order to determine the average movement rage of a certain currency pair. The Truly Volatility indicator is designed for determining volatility for the specified period and is displayed in a separate window as a histogram and line. If attached to a chart with the Н1 timeframe, the indicator displays the average price movement for each hour (from 0 to 23) based on the history data. On the D1 timeframe it displays the average movem
FREE

The indicator allows you to trade binary options. The recommended time frame is М1 and the expiration time is 1 minute. The indicator suitable for auto and manual trading. A possible signal is specified as a arrows above/under a candle. You should wait until the candle closes! Arrows are not re-painted Trade sessions: LONDON and NEWYORK section Currency pairs: GRB/USD Working time frame: M1 Expiration time: 1 minute. The indicator also shows good results when using the martingale strategy - "Mar
FREE

Active Price Lines
Indicator gives you full custom control over the Bid and Ask price lines, both color and style. Color control is also customizable based on increased or decreased price by the tick.
Options include: Show both the Bid line and the Ask line Set unique color for each Set unique line style for each Set unique color for increased price (by the tick) Show only Bid line Show only Ask line
Rider Capital Group
FREE
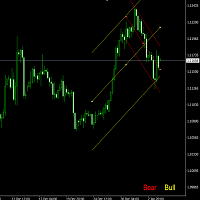
This indicator judges current trend, with Linear regression and the angle. Each parameters setting contents below. Period Period from current
Angle The angle of judging the trend
Width of Lines Width of Linear regression lines* Font size Font size of display text
Lines&Text colour Colour of display lines and test
* This parameter judges that if lines spreads too wide, there is no trend.
FREE
This is yet another non-parametric ZigZag. Its every upward edge continues until next bar's high is formed below highest low of its bars, and every downward edge continues until next bar's low is formed above lowest high of its bars. In addition to zigzag itself (shown in orange color), the indicator shows signal marks on those bars where zigzag direction changes. The blue arrow up denotes that new bullish edge is started (but not yet completed), whereas the red arrow down denotes that new beari
FREE
Indicador Gratuito desarrollado por Mr Beast Inversiones Mr Beast : Gestión de riesgo profesional. Brindo a la comunidad la entrada a productos de M Beast. Echar un vistazo a mis señales y expert advisors. Descuentos de hasta 70% Diclaimer: La negociación en Forex, CFD y Opciones conlleva un riesgo de pérdida sustancial y no es adecuada para todos los inversores. El alto grado de apalancamiento puede actuar en su contra y también en su favor, Antes de decidirse a operar en productos tan apalanca
FREE

Free Scalping is a comprehensive manual system developed for the most efficient trading at any market conditions and time scale.
The system is based on two main blocks:
1. The block of trend determination that calculates dynamic support and resistance. The function of auto-optimization is available for this block.
2. The block of price deviation from its median based on the big set of regressions to get the statistically-valid result. Entry rules For buys:
1. The trend goes up
2. The pr
FREE
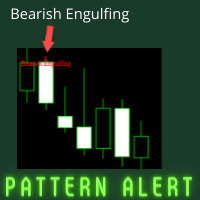
Welcome to pattern alert indicator page. This indicator designed for alerting purpose of Bullish and Bearish engulfing pattern alert. This stuff is suitable for 1 hour, 4 hour and 1 day time frame. high winning ratio is tested. Buy Alert: when the bullish engulfing pattern alert is noticed. Sell Alert: when the bearish engulfing pattern alert is noticed. See the attached screenshots for more clarity. Happy trading !!! Open Account (Get $15 cash back for each and every 1 lot trades has done) : ht
FREE

This indicator calculates how much has an instrument won or lost in percentage terms on each bar displayed in the chart. [ Installation Guide | Update Guide | Troubleshooting | FAQ | All Products ]
Identify market patterns Find decisive price movements Be suspicious about overbought/oversold situations It is an extremely easy to use indicator... The blue histogram represents winning bars The red histogram represents losing bars The gray line represents the average win/loss per bar
Labels are
FREE

This indicator calculates directly the value of the dollar index by using the ICE formula to plot the chart, this can help you as reference. You do not need your broker to provide the ICE DX to use this indicator, is a way to have it calculated. Little discrepancies could be found in the exact value of the candles or time due closing time of the trading floor and the use of decimals, but generally will give you good reference. You need your broker offers the feed for the following pairs in orde
FREE

FractZigER calculates reversal vertices on the chart and connects them by lines individually for High and Low and complements the chart with lines by bottoms for High and Low in a similar way. Only one parameter is used for setup (ReachBars - number of neighbouring bars for plotting a vertex), as well as one parameter for drawing into history (DRAWs - number of bars in history to be used in calculation). Use the indicator the same way you previously used ZigZags and indicators based on fractals,
FREE

Muitos traders utilizam The Bull-Bear Indicator, eu decidi reunir os dois em apenas um, assim fica melhor a visualização, e estou compartilhando com vocês. as regras de negociação permanecem as mesmas, você pode ajustar o período de acordo com sua preferência. The Bull-Bear Indicator é um indicador gratuito com diversas versões amplamente divulgado na internet, essa é apenas uma versão que eu montei, espero que gostem. Caso queira conhecer os indicadores de minha autoria por gentileza acesse min
FREE

This indicator shows the realistic and precise trend. The plotted line as a trend indicator is the best secure place to set the stop-loss.
In case that trend is bullish you will see the plotted line under the candles and in the case of the bearish market, the plotted line is on the upper side of candles. Buy paid version of this indicator which it is Statistical Support Resistance .
FREE

Este indicador mostrará os pregões ativos e inativos, bem como definirá variáveis globais como se o pregão está ativo (1) ou inativo (0). Usando a função de biblioteca iCustom, você pode invocar este indicador de um Expert Advisor ou Script, da seguinte forma: // Invocar indicador personalizado iCustom ( Symbol (), PERIOD_D1 , "Market/RedeeCash_TimeZone" , 0 , 0 ,Blue,Red); // obter os valores das variáveis globais double NewYorkSessionIsActive = GlobalVariableGet ( "TZ-NewYork" ); double London
FREE
Hello, This indicator is a unique high reliability 7-in-1 multicurrency indicator comprising these sub-indicator’s: A Trend Power Crossover Indicator. A Percent Change Crossover Indicator. A Currency Overbought/Oversold Indicator. A Currency Deviation Indicator. A Currency Impulse Signal Indicator. A Trend Power Indicator. A Currency Volatility Indicator. The main advantage of this indicator is that it's reasoning by currency and not by currency pair. The values of each sub-indicator are calcul
FREE

This indicator colors candles in accordance with the projected price movement. The analysis is based on the values of the classic ADX. If the DMI+ line is above the DMI- line - the candlestick is painted in color that signals a price growth; If the DMI+ line is below the DMI- line - the candlestick is painted in color that signals a price fall. The indicator does not redraw on completed candlesticks. The forming candlestick can change its color depending on the current data. Thus, it is recommen
FREE

Necessary for traders: tools and indicators Waves automatically calculate indicators, channel trend trading Perfect trend-wave automatic calculation channel calculation , MT4 Perfect trend-wave automatic calculation channel calculation , MT5 Local Trading copying Easy And Fast Copy , MT4 Easy And Fast Copy , MT5 Local Trading copying For DEMO Easy And Fast Copy , MT4 DEMO Easy And Fast Copy , MT5 DEMO
Strongly recommend trend indicators, automatic calculation of wave standard and MT5 ve
FREE

This scanner shows the trend values based on crossovers of two moving averages for up to 30 instruments and 8 time frames. You can get alerts via MT4, Email and Push-Notification as soon as the direction of the trend changes. This is the FREE version of the indicator: https://www.mql5.com/en/market/product/29159
Important Information How you can maximize the potential of the scanner, please read here: www.mql5.com/en/blogs/post/718074
You have many possibilities to use the scanner. Here are
FREE

The indicator My Big Bars can show bars (candles) of a higher timeframe. If you open an H1 (1 hour) chart, the indicator puts underneath a chart of H4, D1 and so on. The following higher timeframes can be applied: M3, M5, M10, M15, M30, H1, H3, H4, H6, H8, H12, D1, W1 and MN. The indicator chooses only those higher timeframes which are higher than the current timeframe and are multiple of it. If you open an M30 chart (30 minutes), the higher timeframes exclude M5, M15 and M30. There are 2 handy
FREE
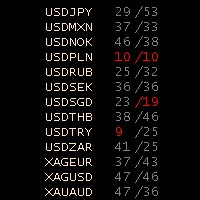
Stochastic Oscillator Panel Introducing the Stochastic Oscillator Panel, a comprehensive representation of the stochastic oscillator for all currencies (up to 75 pairs). This powerful tool operates within the current time frame, utilizing the simple moving average and relying on the Low/High prices. The panel consists of three columns: Name of the currency MODE_MAIN (main line) MODE_SIGNAL (signal line) The Stochastic Oscillator Panel provides visual cues through color coding: Green color (overb
FREE

The intention of the dashboard is to provide a quick overview of the daily, weekly and monthly range of configured assets. In "single asset mode" the dashboard shows you possible reversal points directly in the chart, thus making statistics directly tradable. If a configured threshold is exceeded, the dashboard can send a screen alert, a notification (to the mobile MT4) or an email. There are various ways of using this information. One approach is that an asset that has completed nearly 100% o
FREE

Support and Resistance Levels Arrow Indicator please leave 5 stars to me A support level is a level where the price tends to find support as it falls. This means that the price is more likely to "bounce" off this level rather than break through it. However, once the price has breached this level, by an amount exceeding some noise, it is likely to continue falling until meeting another support level. A resistance level is the opposite of a support level. It is where the price tends to find re
FREE

The different server times for each broker can be a heavy load when trading in short period.
This indicator displays the minimum trade information required to win at a glance.
The sub window displays the local time, and the main chart displays not only the local time,
-Symbol
-Period
-BarEndTime
-Spred
-TokyoTime
-LondonTime
-NewYorkTime
-ServerTime
and so on...
The information display on the main chart can be selected from four places: upper right, lower ri

O indicador MACD (Moving Average Convergence Divergence) é uma das ferramentas de análise técnica mais amplamente utilizadas pelos traders em todo o mundo. Criado por Gerald Appel na década de 1970, o MACD é um indicador que ajuda os investidores a identificar a direção da tendência, a força da tendência e possíveis pontos de reversão de tendência. O indicador MACD é composto por um histograma que mostra a diferença entre a média móvel exponencial de 12 períodos e a média móvel exponencial de 26
FREE

PLEASE HELP REVIEW/ SUPPORT/ SHARE THIS OTHER INDICATOR HERE https://www.mql5.com/en/market/product/51637 AS YOU DOWNLOAD THIS ONE FOR FREE. THANKS.
This Indicator is based on four moving averages and the PIVOT points. The indicator provides clarity to trading, especially in ranging markets when price is very slow and tight. You can trade intensively daily, every day with this indicator. You may decide to trade with this indicator alone and get the maximum out of the market. The indicator w
FREE
Простой, но полезный индикатор для контроля волатильности при внутридневной торговле. Индикатор наносит на текущий график уровни средней волатильности (ATR) за указанное количество дней. На текущем торговом дне уровни динамические и перемещаются в зависимости от минимума и максимума цены текущего дня в режиме "реального времени". Во входных параметрах мы задаем: - количество дней для расчета и отрисовки уровней среднего АТР - цвет линий уровней среднего АТР - толщину линий уровней среднего АТР
FREE
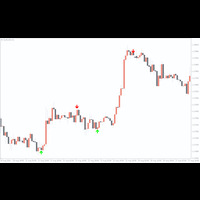
The indicator is a 15-minute signal indicator for all types of traders. Meaning, you could make lots of profits trading two different signals in one indicator.
NOTE: Both indicators are channels for achieving the same result. RED ARROW -- Sell Signal BLUE ARROW -- Buy Signal
Purchase now to be part of our community. We offer standard chart setups for both novice and intermediate traders. Trade with ease!
FREE

A simple but useful indicator for controlling volatility in intraday trading.
The indicator plots the average volatility (ATR) levels for the specified number of days on the current chart.
On the current trading day, the levels are dynamic and move depending on the minimum and maximum prices of the current day in "real time" mode.
In the input parameters we specify:
- the number of days to calculate and draw the ATR levels
- color of the ATP level lines
- the thickness of the ATR le
FREE

This indicator demonstrates that the price change of financial instruments is NOT a random walk process, as advocated by the "Random Walk Hypothesis", and as popularised by the bestselling book "A Random Walk Down Wall Street". I wish that were the case! It is shown here that the real situation with price change is actually much worse than a random walk process! Deceptive market psychology, and the bulls-bears tug of war, stack up the odds against traders in all instruments, and all time frame
FREE
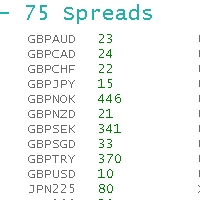
ObiForex 75 Spreads Discover a powerful indicator showcasing instant spreads for 75 currency pairs. Unlock valuable insights for informed trading decisions and optimize your strategies. The indicator features 3 columns, providing a comprehensive view of the spreads. Spread reading can be effectively used with macroeconomic news. Share your strategies! For optimal performance, install the indicator on the USDJPY currency pair. Experience the capabilities of ObiForex 75 Spreads and elevate your tr
FREE
DStochastic is an improved version of the classic Stochastic oscillator with an added moving average. The indicator dampens the market noise, determines the direction of the market and reduces the number of false signals. We have also added a function of multicolor signal line display of increase and decrease by means of dots. The blue dots indicate the development of an ascending trend, the red dots - descending. Similar to all standard oscillators, DStochastic can be combined with all trend in
FREE

Supertrend Moving Average A combination of Supertrend and Moving Average to create a converging trade setup Input parameters: signal mode: set it to true if you want to plug it into STAT (Signal Tester and Trader) arrow shift: distance between fast EMA line to arrow on chart turn on moving average signal for converging setup supertrend period ATR multiplier Moving average period Averaging method Pricing You can find the best setting for 4 hour EURUSD on this video
FREE
The indicator informs when the current bar closes and a new bar opens. TIME is an important element of trading systems. BarTimerPro indicator helps you CONTROL THE TIME . Easy to use: place on the chart and set “alarms” if it necessary. In the tester, the indicator does not work. See the Lite version BarTimerPro-Lite
Key Features
4 operating modes: Shows the time elapsed since the opening of the current bar (11) Shows the time remaining until the current bar closes (11) Indicator Updates Ever
FREE

The GTAS BSI is an indicator designed to provide the trend direction and buy/sell signals, using combination of momentum indicators. This indicator was created by Bernard Prats Desclaux, proprietary trader and ex-hedge fund manager, founder of E-Winvest.
Description The BSI indicator is represented as a histogram under the price chart. +100 (green) value indicates a bullish trend. -100 (red) value indicates a bearish trend. When the BSI turns to +100 (green), it gives a potential buy signal. W
FREE
What is a tool ? This indicator use for forecast direction of the 28 pairs, Calculates from multiple pairs and timeframes and present by percentage as 70-79% , 80-89% , 90-100% is a little, medium and strong trend. How to use Place the indicator on any pair and any timeframe. Pair : Any Timeframe : Any Input Parameter No Visit my products Target Profit Magic Target Profit All The Profit Tracker Currency Scoring Pair Direction
FREE

Chart Time Indicator is very simple and easy, but it can be very important to control the time before opening any manual trade. This indicator shows the time on the chart between 3 different options.
Input parameters Show Time : Select all the time options that you want to see. Local Time (Personal Computer Time), Server Time (Broker Time) or GMT Time. Recommendations: Use only one Chart Time Indicator for each chart.
FREE

Hello all. This indicator helps you to open a trade, when break out occurred, also you can add to your position and ride it if trend continued. I use it on 1-5 min chart, as you can use short stop loss. Also profit target should be small as well. It is better to enter few small position, so you can book some profit early and ride the rest for bigger gains. Look at the past to have a plan. Enjoy.
FREE

Supreme Stoploss is an indicator for metatrader 4 that is based on the ATR indicator , it gives stoploss/takeprofit as lines drawn above and below the price , this indicator does not repaint/back paint and is not delayed. can be used to determine the stop loss or take profit of a trade using ATR value multiplied by the number set by user. ====================================================================================================== Parameters : ATR SL period : ATR period identity : leave
FREE
The purpose of this new version of the MT4 standard indicator provided in your platform is to display in a sub-window multiple timeframes of the same indicator. See the example shown in the picture below. But the display isn’t like a simple MTF indicator. This is the real display of the indicator on its timeframe. Here's the options available in the FFx indicator: Select the timeframes to be displayed (M1 to Monthly) Define the width (number of bars) for each timeframe box Alert pop up/sound/ema
FREE
Rectangle Control простой индикатор который отображает на графике панель для рисования прямоугольников с различными настройками, будет удобен тем кто рисует на графике зоны поддержки, сопротивления. Прямоугольник можно нарисовать с заливкой или без, различной толщины и цвета. А также выбрать таймфрейм на котором нарисованный прямоугольник будет отображаться. При нажатой кнопке алерт будет срабатывать оповещение (если прямоугольник находиться ниже цены на верхнем его краю, если прямоугольник нах
FREE
Highly configurable MFI indicator. Features: Highly customizable alert functions (at levels, crosses, direction changes via email, push, sound, popup) Multi timeframe ability Color customization (at levels, crosses, direction changes) Linear interpolation and histogram mode options Works on strategy tester in multi timeframe mode (at weekend without ticks also) Adjustable Levels Parameters:
MFI Timeframe: You can set the current or a higher timeframes for MFI. MFI Bar Shift: you can set th
FREE
O Mercado MetaTrader oferece um local conveniente e seguro para comprar aplicativos para a plataforma MetaTrader. Faça download de versões de demonstração gratuitas de Expert Advisors e indicadores a partir do seu terminal para testes no Testador de Estratégia.
Teste os aplicativos em diferentes modos para monitoramento do desempenho e assim fazer um pagamento para o produto que você deseja, usando o sistema de pagamento MQL5.community.
Você está perdendo oportunidades de negociação:
- Aplicativos de negociação gratuitos
- 8 000+ sinais para cópia
- Notícias econômicas para análise dos mercados financeiros
Registro
Login
Se você não tem uma conta, por favor registre-se
Para login e uso do site MQL5.com, você deve ativar o uso de cookies.
Ative esta opção no seu navegador, caso contrário você não poderá fazer login.