Смотри обучающее видео по маркету на YouTube
Как купить торгового робота или индикатор
Запусти робота на
виртуальном хостинге
виртуальном хостинге
Протестируй индикатор/робота перед покупкой
Хочешь зарабатывать в Маркете?
Как подать продукт, чтобы его покупали
Технические индикаторы для MetaTrader 4 - 125
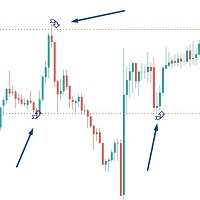
*** Introductory Offer! *** Ends soon - do not miss it! The Price Rejection Alerts Indicator is part of my suite of Price and Trendline Alerts Indicators. I'm excited to introduce the Price Rejection Alerts Indicator – part of my new suite of Price and Trendline Alert Indicators – fantastic tools designed to alert you when candles close above or below significant prices in the markets you trade. With this indicator, you can set up to 4 price alerts on any asset, allowing you to quickly spo

The Supertrend Indicator is a powerful tool for traders that provides alert, notification, and email features. With its customizable color scheme, you can easily personalize the look and feel of the indicator to fit your trading style. This indicator is designed to help traders identify trend changes and potential entry and exit points in the market. Whether you're a seasoned professional or just starting out, the Supertrend Indicator is a valuable addition to your trading toolkit. It will be av
Индикатор Volume New это основной индикатор для расчета направления движения цены по тиковых объемах. Индикатор выдает максимальное число сигналов, которые возможно фильтровать согласно своих стратегий. Индикатор не перерисовывается и не запаздывает и выдает сигнал согласно установок величины SIGNALBAR, по умолчанию 1 - после закрытия текущей свечи. Количество баров истории для расчета задается в меню индикатора величиной BarsCount, по умолчанию 500 баров.

Индикатор MT4 Выйдите впереди кривой с индикатором Wamek Trend Consult. Разработанный для определения начальных и продолжительных трендов, этот мощный инструмент дает трейдерам возможность входить на рынок в точно подходящий момент, используя мощные фильтры, чтобы уменьшить количество ложных сигналов и повысить точность ваших сделок. Путем точного анализа рыночных тенденций и фильтрации ложных сигналов с использованием своих продвинутых алгоритмов и непревзойденной точности индикатор Trend Consu
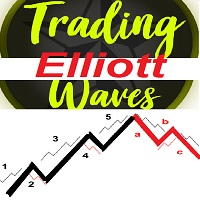
A simple Approach to Elliot waves patterns Signal generated on trend continuation when breaking the "5" level or on corrective direction after 1-5 waves detected 1-5 labeled points arrows used for signal UP/DOWN direction Chaotic patterns in Blue are drawn all times until a 1-5 Elliot wave pattern detected 1-5 Red pattern in Bull Market : UP arrow in BULL trend continuation OR DOWN arrow as a reversal DOWN direction as pattern correction 1-5 Green pattern in Bear Market :DOWN arrow in BEAR tr
Check My Product Contact me to discover all my services
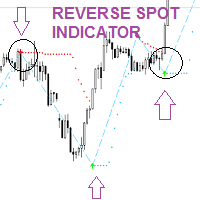
Reverse Spot is an indicator that can help you find and identify possible price reverse zones. This indicator can be used both as a trend continuation signal after a small period of consolidation or retracement and as a trend change signal.
Reverse spot is a very easy to use indicator and thanks to the signals it sends with the arrows it is easy for the trader to identify moments in which to evaluate his own operations.
Reverse Sp
This is a modern MACD indicator based on regular MACD indicator. It also has alert system included. This indicator gives you alerts when base line of MACD indicator crosses above or below Zero level so you can look for Buy or Sell opportunity. Available Alerts: 1. Audible Alerts on Chart / Trading Terminal window. 2. Alerts on your email. 3. Alerts on your mobile phone. Type of Alerts Explained: 1. Audible_Chart_Alerts - Audible alerts and Popup message on your compu

An indicator based on support and resistance levels with many signals (per candle) Can be used in all time frames Can be used in all symbol Blue lines: upward trend. Red lines: downward trend
How It work: This indicator gives signals based on support and resistance levels as well as some complex calculations. Based on past data
As you know, one of the most important trade options are support and resistance levels.
Get good signals using this indicator.
How To work: Run the indicator.
Gravitas indicator – High quality / Non-repainting Signals for day trading
If you are sick and tired of not being profitable each month or you simply want a safe earning while you are studying the markets or while you practice and master your strategy give this indicator a try. I called this indicator “Gravitas” as indication of seriousness and importance that trading is for me and respect for the market and the other traders involved in it. I developed it last
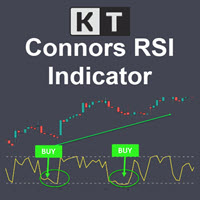
KT Connors RSI is a modified and more advanced version of the original Connors RSI developed by Larry Connors. It was designed to help traders generate trade signals based on short-term price movements.
The Connors combine the standard RSI calculation with two additional elements: a short-term RSI, ROC, and a moving average.
Features Provides more transparent and more actionable buy and sell signals using the overbought/oversold zones. Incorporates short-term RSI and moving average, provid

You can change the time period of the chart at the touch of a button. You can also change multiple charts at the touch of a button. You can also change multiple charts at the touch of a button, saving you the trouble of changing time periods.
We are live-streaming the actual operation of the system. https://www.youtube.com/@ganesha_forex
We do not guarantee your investment results. Investments should be made at your own risk. We sharll not be liable for any disadvantage or damage caused by
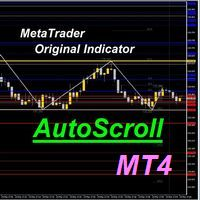
AutoScroll automatically scrolls the chart by the set width (pips). You can see the next milestone without having to operate the chart yourself. You can concentrate on trading.
We are live-streaming the actual operation of the system. Please check for yourself if it is usable. Please check it out for yourself. https://www.youtube.com/@ganesha_forex
We do not guarantee your investment results. Investments should be made at your own risk. We sharll not be liable for any disadvantage or damage
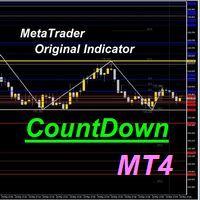
The time until the end of the bar is counted down. Therefore, you can time your order while watching the chart. You can concentrate on your trading.
We are live-streaming the actual operation of the system. Please check for yourself if it is usable. Please check it out for yourself. https://www.youtube.com/@ganesha_forex
We do not guarantee your investment results. Investments should be made at your own risk. We sharll not be liable for any disadvantage or damage caused by the use of the in

Fibonacci automatically draws Fibonacci retracement, Because Fibonacci automatically draws Fibonacci retracement, you can know at a glance the price to buy at a push or sell back. Therefore, you can trade in favorable conditions in a trending market.
We are live-streaming the actual operation of the system. Please check for yourself if it is usable. Please check it out for yourself. https://www.youtube.com/@ganesha_forex
We do not guarantee your investment results. Investments should be mad

The chart pattern is automatically drawn. It also automatically tells you the price at which you are most likely to buy or sell according to the pattern. Therefore, there is no need to memorize patterns or draw lines by yourself.
We are live-streaming the actual operation of the system. Please check for yourself if it is usable. Please check it out for yourself. https://www.youtube.com/@ganesha_forex
We do not guarantee your investment results. Investments should be made at your own risk. W

The system automatically draws resistance and support lines, The system automatically draws resistance and support lines, so you can see at a glance the price range where you are most likely to encounter resistance. Therefore, you can trade in price zones where you are less likely to encounter resistance.
We are live-streaming the actual operation of the system. Please check for yourself if it is usable. Please check it out for yourself. https://www.youtube.com/@ganesha_forex
We do not guar

Based on the Dow Theory, the system automatically draws a turning point, which is the starting point for buying or selling. It also automatically tells you whether the market is in a buying or selling condition and recognizes the environment. It is also a good tool to prevent false trades and to make profitable trades.
We are live-streaming the actual operation of the system. Please check for yourself if it is usable. Please check it out for yourself. https://www.youtube.com/@ganesha_forex

Check My Product Contact me to discover all my services
Supply and demand zones are one of the most basic things a beginner forex trader learns. These zones are so important, price reacts off of them even after years since they first developed. And with the supply and demand zones indicator, a forex trader might not need to worry about drawing all these historical zones one after the other.
The supply and demand zone indicator accurately draws the supply and demand zones of a currency pair

Fractal Advanced - отображает индикаторы Fractal и Alligator на графике цены. Обладает широкими возможностями настроек и кастомизации. Также оснащён алертами и системой горячих клавиш.
Инструкция/Мануал ( Обязательно читайте перед приобретением ) | Версия для МТ5
Преимущества
1. Индикатор не забивает весь график фракталами, а позволяет отображать только актуальные сигналы.
2. Регулировка количества фракталов осуществляется при помощи скролла мыши с зажатой клавишей Shift.
3. Мгновенное ото

Fibonacci Currency Strength Meter (FCSM) Early Access Sale!!
This new product is still in the process of adding new features and settings. For early bird buyers. The Price will be 50% Sale. In a few weeks, the product will be done. Go Grab your copy while it's still cheap. More details will be added soon. Things to be added. Alert Levels Mobile and Email Alert
From it's name, Fibonacci Currency Strength Meter is a combination of Fibonacci levels and Currency Strength Meter. The plot of Fib

If you are using naked eyes to find candlestick patterns on your chart it's a good thing but it requires your time and attention and still you miss some patterns here and there. Don't worry! This indicator will help you to find "Harami Candlestick Pattern" on your chart very easily. *Note: Default inputs are set for EURUSD H1 (1 hour) timeframe. This is an alert system which gives you alerts whenever harami candlestick pattern happens. Types of alerts it can give you are: 1. Audible Alerts -
What you get upon purchase:
-Lifetime support for the use of the system - Easy to use, clean user friendly interface with no single settings required - Arrow Signals showing where to buy and sell -Visual Arrows, Sound Alert, Email and sms alert functionalities - Customizable colors and sizes -Lifetime Updates - Both Trend and breakout signals -Appropriate signals for both Entry levels, Take profit levels and stop loss Preferred timeframe is 15 MINUTES ACCURATE SIGNALS WITH SIMPLE AND USER

GPT Candlestick T he Indicator show algorithm of Candlestick Automatically. GPT Candlestick is a MetaTrader 4 Indicator that uses a proprietary algorithm based on Price of Moving Average and Average True Range to show the Color of Candlestick on your trading. Means candlestick is going Up or Down (View Simply). I nstead, it analyzes data of market and identify entry points and opportunities. I t's also a trading tool that be used to practice and enhance your manual trading skills. GPT Candlestic

[ MT5 Version ] [ Order Blocks ] [ Kill Zones ] [ SMT Divergences ] How to trade using Order Blocks : Click here User Interface Performance: During testing in the strategy tester, the UI may experience lag. Rest assured, this issue is specific to the testing environment and does not affect the indicator's performance in live trading. Elevate your trading strategy with the Order Blocks ICT Multi TF indicator, a cutting-edge tool designed to enhance your trading decisions through advanced orde

Forex 3D - готовая торговая система для скальпинга на любой валютной паре. Рекомендуемый таймфрейм M5. Среднее количество, которое можно найти каждый день от 5 до 15. Эта торговая система подходит для торговли на всех валютных парах, включая золото и серебро. Forex 3D - это очень простая торговая система, которая подходит для новичков в форекс. Она не требует дополнительного анализа рынка с помощью других торговых инструментов. Мы тщательно изучаем технический анализ данного индикатора и рассмат
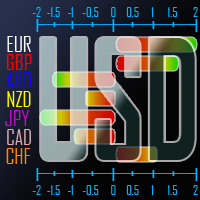
Versus USD рассчитывает изменение цены каждой основной валюты по отношению к доллару США и отображает ясное и сравнительное представление их производительности для каждого периода или бара, индексируемого курсором в текущем временном интервале диаграммы с полосами прогресса. Кроме того, он помечает стрелкой бар/период, где данная валюта испытала наибольшее или наименьшее изменение курса по сравнению с другими валютами, тем самым обеспечивая более точную оценку производительности валюты. Доллар С

"Настроения трейдеров" на финансовых рынках это тема, которая нас давно интересует. Со временем мы не смогли найти правильную формулу для определения этих настроения. Мы прошли много этапов в поисках нужной методологии - от взятия данных из внешних источников для расчета открытых позиций покупателей и продавцов до расчета тиковых объемов, но все равно нас не удовлетворили результаты. Расчет открытых позиций покупателей и продавцов из внешних источников имел несколько проблем - это была выборка з
Скальпинговый форекс индикатор, основанный на стрелочных точках разворота цены, является одним из передовых инструментов для трейдинга на финансовых рынках. Он предоставляет трейдерам возможность быстро реагировать на изменения на рынке и достаточно точно предсказывать дальнейшее направление движения цен. Индикатор основывается на использовании современных алгоритмов и технологий, которые позволяют быстро рассчитывать точки разворота цены на графике. Каждая точка обозначается стрелкой, указываю
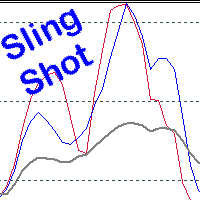
Scalping, Mean reversion or Position trading strategy
Get into an established trend on a pullback in the market. Use the Pinch in the indicator for profit taking. Use the Pinch as a mean reversion strategy, scalping back to a moving average line.
Input Parameters Fast Sling Shot configuration. Slow Sling Shot configuration. Dual Sling Shot configuration. Price line configuration. Trigger zones or levels. Example of Sling Shot trade idea: Price line sets the mood, below the baseline le
Введение BreakOut Consult, революционного инструмента, который поднимет ваше торговое мастерство на новый уровень! Наш современный алгоритм комбинирует несколько трендов и осцилляторов для генерации точных сигналов на покупку и продажу, что делает его мощным инструментом для любого трейдера. С BreakOut Consult вы можете легко выявить прорывы на рынке с помощью нашего динамического канала, который использует уровни сопротивления и поддержки для обнаружения прорывов. Наш алгоритм обнаруживает два
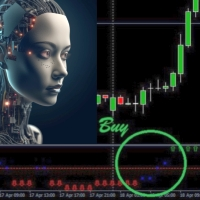
Introducing Trend Fusion 444F, a powerful MQL4 indicator designed to determine market direction using multiple trading indicators. This comprehensive tool offers a unique fusion of technical analysis techniques that help traders make informed decisions in various market conditions. Key Features: Comprehensive Analysis: Trend Fusion 444F combines several widely-used trading indicators to provide a multi-dimensional view of the market. The indicators include Moving Averages, MACD, RSI, DeMarker,

Трендовый индикатор Go Master находит текущий тренд на основе многих факторов. Простой и удобный индикатор. Пользователь может легко увидеть тренды. Он использует базовый подход торговли, широко описанный в торговой литературе.
Это первый индикатор, предназначенный для обнаружения колебаний в направлении тренда и возможных разворотов. Работает при помощи специального алгоритма и набора внутренних индикаторов. Вы можете использовать данный индикатор самостоятельно или в сочетании с другими инд
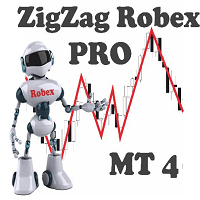
Интеллектуальный индикатор ZigZag. Имеет всего две настройки. Чем выше значения, тем более значимые экстремальные значения показывает. Область применения. Для определения тренда. Направление рисования линии. Для распознавания многочисленных паттернов. Если наложить два индикатора на один график с быстрыми и медленными значениями. Изменив цвет одного из них, то очень хорошо можно разложить движение цены на волны. Индикатор может оказаться отличным помощником для разметки графика и обозначения к

The "AI Forecast" indicator is the result of a unique experiment in which I asked an AI how to create the best indicator to anticipate the market. The AI suggested measuring the past history of the price and its reactions to different levels, and then calculating the probabilities of the price reaction in the future.
With this idea, I designed with the help of another AI the "AI Forecast" indicator, which adapts to any MetaTrader chart and shows you three lines: one for entry and two for poss

Все трейдеры ждут пока успокоится рынок и лишь после этого войдут в рынок. Они все время смотрят на монитор. Теперь вам больше не нужно следить за этим, вместо вас это сделает ваш лучший помощник. Вы займитесь своими обычными делами и спокойно ждите сигнала. А как только спред достигнет установленного вами значения, то вы получите моментальное уведомление на ваш телефон.
Данный индикатор представляет собой отображение элементов торговой системы, а именно торговли в зоне, описанной Биллом Вильямсом. Индикатор использует идею открытия сделок на продажу в период одновременного падения значений MACD и OsMA (в книгах Билла Вильямса для этих индикаторов используются названия АО и АС) или наоборот, открытие сделок на покупку в период одновременного роста значений таких индикаторов. Подтверждением сигнала индикатора является преодоление ценой максимума/минимума бара на
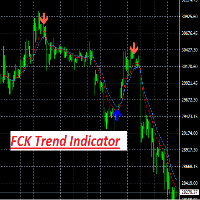
FCK Trend Indicator is an indicator for determining the current direction of price movement and reversal points. The indicator will be useful for those who want to see the current market situation better. The indicator can be used as an add-on for ready-made trading systems, or as an independent tool, or to develop your own trading systems. FCK Trend Indicator indicator, to determine the reversal points, analyzes a lot of conditions since the combined analysis gives a more accurate picture of t

Supply and Demand Indicator + FREE Currency Strength Meter ADD-ON Looking for a powerful tool that can help you identify the most reactive zones in the forex market? Our supply and demand indicator for MetaTrader 4 and 5 is exactly what you need. With its advanced algorithms and real-time analysis, this indicator helps traders of all experience levels make informed trading decisions. The supply and demand indicator is a cutting-edge tool that helps traders identify areas where buyers and seller
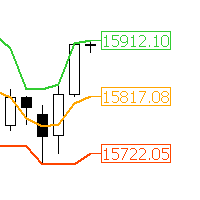
"AV Donchian Channel" is an indicator for MetaTrader 4, which shows the current prices of the donchian channels and the middle line.
Multiple AV Donchian Channel indicators can be placed on one chart. The center line can be used for trailing.
See also Richard Dennis Turtle Trader strategy.
Settings:
- Donchian Channel Period
- Colors and widths of the lines
- Colors and widths of price labels
Please report bugs to me.

Considering the main theories of Forex (Dow Theory, support lines, chart patterns, and Fibonacci retracements), It tells you the price range where whales (large investors) are likely to appear. You can trade at the price points that professionals also aim for. You no longer have to warry about where to aim next.
We are live-streaming the actual operation of the system. Please check for yourself if it is usable. Please check it out for yourself. https://www.youtube.com/@ganesha_forex
We do no
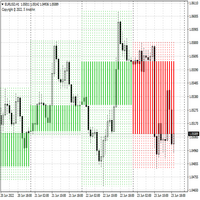
Aligning higher time frames for trading One of the main concepts behind the beginner strategy is multiple time frame analysis – using a higher time frame to determine the overall market direction and executing trades on a lower time frame. By determining the overall direction on a higher time frame and trading in that direction, you make sure that you trade in the direction of the overall trend – this increases your chances of profitable trades. In the beginner strategy, you use the 30 minute ch
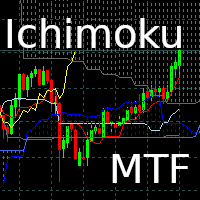
Ichimoku Hinko Hyo MTF
Ichimoku Hinko Hyo MTF is a Multi Time Frame indicator. It allows to overlap several ichimoku indicators (from different timeframes) on the same chart.
Doing this allows a better read of the market as informations are directly available to user.
It is possible to select different curves to be displayed (Tenkan, Kijoun, Chikou, Kumo)
In this version 1.0, it is possible to
On M1 chart, overlap M5 and M15 indicators.
On M5 chart, overlap M15 and H1 indicators.
On M15
Данный индикатор представляет собой отображение элементов торговой системы, а именно торговли в зоне, описанной Биллом Вильямсом. Индикатор использует идею открытия сделок на продажу в период одновременного падения значений MACD и OsMA (в книгах Билла Вильямса для этих индикаторов используются названия АО и АС) или наоборот, открытие сделок на покупку в период одновременного роста значений таких индикаторов.
Значения АО и АС падают - свеча окрашена в красный цвет. Значения АО и АС растут - све

Бесплатно обучаем торговле с этим индикатором в нашем канале: https://www.mql5.com/en/channels/scalpm1period Scalping arrow indicator M1 - это стрелочный сигнальный индикатор для скальпинга на таймфрейме М1. Он рисует трейдеру на графике точки разворота цены и не перерисовывает их. Индикатор показывает трейдеру, когда лучше всего открывать сделку и в каком направлении. После того, как индикатор определил точку разворота цены, он на графике рисует красную или синюю стрелку. Эти стрелки указываю

Алгоритм индикатора Synthetic Trend генерирует входные сигналы и уровни выхода. Принцип работы индикатор заключается в том, чтобы при размещении на график автоматически определять текущее состояние рынка, анализировать исторические данные, на основании исторических данных и выводить на экран трейдеру указания к дальнейшим действиям. Система сама показывает в виде стрелок когда покупать и когда продавать. Стратегия для торговли по тренду, фильтрация и все необходимые функции, встроенные в один ин
Данный индикатор представляет собой отображение элементов торговой системы, описанной Биллом Вильямсом. Индикатор использует идею открытия сделок на продажу в период одновременного падения значений MACD и OsMA (в книгах Билла Вильямса для этих индикаторов используются названия АО и АС) или наоборот, открытие сделок на покупку в период одновременного роста значений таких индикаторов. Толстая и тонкая цветные гистограммы соответствуют значениям MACD и OsMA. Если гистограмма больше 0, значение инди

Instantly spot simple candlestick patterns with MSHT Price Pattern
MSHT PRICE PATTERN can automatically detect more than 200 different candlestick patterns, including multi-candle patterns. This makes it easy for you to see if what you care about is present on a chart or not at a glance, and reduces the amount of time you have to stare at charts to check off items on your investment checklist. Candlestick Pattern Recognition is supported on charts, alerts, in scanners and smart checklists.
A
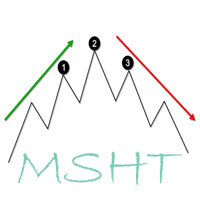
MSHT Head&Shoulders indicator for MT4 automatically scans the chart for head and shoulders candlestick patterns. Obviously, the scanner shows the Symbol, Timeframe, Direction, Pattern Name, Age, and Chart time frame in which the head and shoulders pattern is identified. Furthermore, the scanner displays the inverted head and shoulders pattern also. So, forex traders can BUY or SELL based on the head and shoulders candlestick pattern. Additionally, the indicator also scans and plots emerging head

Special Entry Arrow indicator is designed for signal trading. This indicator generates trend signals.
It uses many algorithms and indicators to generate this signal. It tries to generate a signal from the points with the highest trend potential.
This indicator is a complete trading product. This indicator does not need any additional indicators.
The indicator certainly does not repaint. The point at which the signal is given does not change.
Features and Suggestions Time Frame:

The best instrument for scalping. It allows you to always be correctly positioned in the price. It's a simple and extraordinarily powerful visual reference. Very suitable for price action. It consists of four components. 1. Fork. There are two levels that surround the price and mark the rebound points. They can be varied independently with 4 associated controls, two for each level. Its amplitude is indicated in pips in the indicator data. The minimum fork is updated with each tick. It has
Super Pair Strong Indicator is a highly popular momentum and trend indicator that utilizes multiple currencies to determine trends. It is a one-chart indicator that combines the algorithms of the MACD and Currency Strength Meter. With its one-click feature, users can view 28 major and minor pairs on their dashboard, and by clicking on a specific pair, the chart will automatically change to the user's preferred chart. In addition to its user-friendly interface, Super Pair Strong Indicator offers

Credible Cross System indicator is designed for signal trading. This indicator generates trend signals.
It uses many algorithms and indicators to generate this signal. It tries to generate a signal from the points with the highest trend potential. The indicator works based on instant price movements. This indicator is a complete trading product. This indicator does not need any additional indicators.
The indicator certainly does not repaint. The point at which the signal is given does not
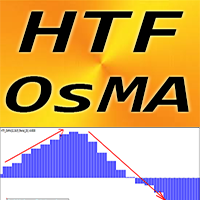
Forex Indicator HTF OsMA Oscillator for MT4, No repaint HTF OsMA is one of the best trend indicators on market . HTF means - H igher Time Frame This indicator is excellent for Multi-Time Frame trading systems with Price Action entries or in combination with other indicators HTF OsMA Indicator allows you to attach OsMA from Higher time frame to your current chart --> this is professional trading approach // More great Expert Advisors and Indicators are available here: http
Индикатор состоит из MACD и OsMA. Эта комбинация позволяет использовать преимущества обоих типов индикаторов. Продукт быстро реагирует на изменения конъюнктуры рынка и эффективно следует за рынком, фильтруя шум. Данный индикатор представляет собой отображение элементов торговой системы, описанной Биллом Вильямсом. Индикатор использует идею открытия сделок на продажу в период одновременного падения значений MACD и OsMA (в книгах Билла Вильямса для этих индикаторов используются названия АО и АС) и
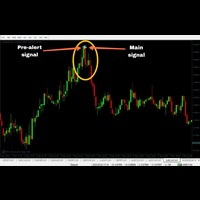
This Indicator has a accuracy in between 70-90% but it will work one time in a day. The timing is (MT4 time 18:00 to 18:05) Tickmill, Alpari, Amarket MT4 recommended. Although it will work on most of the MT4.
MT2 Auto trading supported: Buy buffer = 0 // Sell buffer = 1
Intrabar
Candle TF = M1
Trade Expiry = 1 minute or 5 minutes
No martingale required, but if you wish then you can take 1 step martingale.
Features: Neural Network based Advance price action algorithms Advance consolid
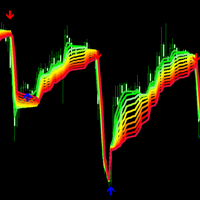
"Gradient adaptive rsi mt4" - адаптивный форекс индикатор RSI, который отображается на графике цены в виде градиента. Этот индикатор помогает трейдеру определять направление текущего тренда, силу тренда, точки разворота тренда. "Gradient adaptive rsi mt4" - создан для платформы Metatrader4 и может работать на всех валютных парах и таймфреймах. С помощью настроек этот индикатор "Gradient adaptive rsi mt4" можно адаптировать для работы с различными торговыми стратегиями. Индикатор "Gradient adapti

Nice Stable Arrow indicator is designed for signal trading. This indicator generates trend signals.
It uses many algorithms and indicators to generate this signal. It tries to generate a signal from the points with the highest trend potential.
This indicator is a complete trading product. This indicator does not need any additional indicators.
The indicator certainly does not repaint. The point at which the signal is given does not change. Signals are sent at the beginning of new candle
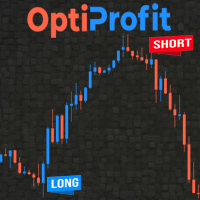
This indicator is a unique, high quality and affordable trading tool. The calculation is made according to the author's formula for the beginning of a possible trend.
An accurate MT4 indicator that gives signals to enter trades without redrawing! Download EA for this indicator https://www.mql5.com/ru/market/product/98089 Ideal trade entry points for currencies, cryptocurrencies, metals, stocks, indices! The indicator builds buy/sell arrows and generates an alert. Graphically displays the ent
Introducing our groundbreaking Forex indicator, specifically designed to help traders master the art of identifying critical support and resistance zones, as well as double top and double bottom patterns with unprecedented accuracy. Say goodbye to guesswork and hello to a powerful tool that will revolutionize your trading experience. Our proprietary indicator leverages cutting-edge technology to recognize key price levels where buying and selling pressures are poised to shift the market dynamic
"Mt4 neutral market indicator" индикатор стрелками показывает точки разворота цены. Линиями показывает направление тренда или коррекции. Если посмореть внимательно на график, Вы сможете легко заметить, что точность стрелок достаточно высокая. Индикатор хорошо показывает сигналы на всех таймфреймах и валютных парах. Когда этого индикатора создавался совместно с чатом ChatGPT. На протяжении всей работы по написанию этого индикатора, мы обращались к чату для создания кода и алгоритмов работы. Совме

Based on data from the Bank for International Settlements, 78.8% of the world's major 8 currency pairs can be checked instantly. It tells you whether the U.S. dollar is being bought or sold in a matter of seconds. So, even in the fast-moving phase after the release of economic indicators, you can see the flow and pushes of the U.S. dollar,
We are live-streaming the actual operation of the system. Please check for yourself if it is usable. Please check it out for yourself. https://www.youtube.

This is a Non-Repaint Reversal Indicator that will send you an Alert when the signal Appears
alerts are done by Mobile, Push notification, Desktop Notification, Email Notifications The indicator can be used on all Time Frames A reversal non-repaint indicator arrow is a technical analysis tool used to identify potential trend reversals in financial markets. The arrow represents a signal that traders can use to enter or exit positions based on the direction of the arrow. The term "non-repaint" m
EasyTrend 3 AM - индикатор который позволяет открыть позицию в самом начале значительного движения цены. Вторым важнейшим качеством индикатора является способность максимально долго следовать тренду для получения всей потенциальной прибыли при этом минимизируя потенциальные убытки. Индикатор позволяет оповещать пользователя о своих сигналах отправляя сообщения на терминал и электронную почту. Индикатор не перерисовывается и не пересчитывается. Бесплатная версия данного индикатора - EasyTrend AM

DAO HIDDEN CODE FX Это предложение уникально. Мы не искали священный Грааль в дельте Амазонки и не раскапывали Египетские гробницы. Мы собрали складчину и заказали в программистов индикаторы. Под концепцию,на которую мало обращали внимания. Все, кроме Теслы. И древних даосов. 1.Логическая концепции такова: · Фондовый график имеет только два измерения - вверх или вниз. Покупка или продажа. Два вектора движения. · График дает третье измерение - время. Оно движется слева напра
SuperTrend 3 AM - индикатор который позволяет открыть позицию в самом начале значительного движения цены. Вторым важнейшим качеством индикатора является способность максимально долго следовать тренду для получения всей потенциальной прибыли при этом минимизируя потенциальные убытки. Индикатор позволяет оповещать пользователя о своих сигналах отправляя сообщения на терминал и электронную почту. Индикатор не перерисовывается и не пересчитывается. Бесплатная версия данного индикатора - SuperTrend A
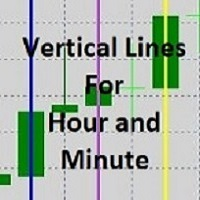
MT4 Indicator that puts up to 4 vertical lines for each selected hour and minute. Vertical line color and thickness are adjustable Input parameters: lineEnabled1 = true lineEnabled2 = true lineEnabled3 = true lineEnabled4 = true lineColor1 = Red lineColor2 = Blue lineColor3 = Green lineColor4 = Yellow lineTime1 = "12:00" lineTime2 = "14:00" lineTime3 = "16:00" lineTime4 = "18:00" lineWidth1 = 1 lineWidth2 = 1 lineWidth3 = 1 lineWidth4 = 1
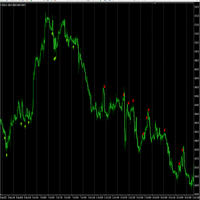
Трендовый стрелочный индикатор MT4 - это мощный инструмент для технического анализа, который поможет трейдерам определить направление тренда на финансовых рынках. Этот индикатор основан на использовании нескольких математических алгоритмов и методов анализа цены, что позволяет давать точные и прозрачные сигналы для входа в рынок. Рабочий таймфрейм H1. Описание индикатора включает в себя стрелки вверх и вниз, которые указывают на будущее направление ценового движения. Кроме того, индикатор может

С помощью алгоритма форекс индикатора Trend Alternative, вы можете достаточно быстро понять, какая именно тенденция в данный момент развивается на рынке.Индикатор Trend Alternative сопровождает длинныетренды, можно использовать без ограничений по инструментах или таймфреймах. При помощи этого индикатора можно пытатся прогнозировать будущие значения. Но основное применение индикатора заключается в генерации сигналов на покупку и продажу. Индикатор отслеживает рыночный тренд с игнорируя резкие ко

Max Min Reversal Arrows - стрелочный разворотный индикатор для прогнозирования движения цены. Индикатор строится по уровням поддержки и сопротивления по локальным минимумам и максимумам цены.
Возможности продукта
Стрелки появляются на текущей свече. Индикатор не перерисовывается.
Может использоваться на всех тайм-фреймах и торговых инструментах. Рекомендуемые тайм-фреймы для использования M30, H1, H4.
Точечные линии - это уровни поддержки и сопротивления в пределах сигнала. Движение цен

hello friend, there is an active adx based indicator for binary options, it only operates on 1 currency (eurusd) on TF M1, it operates the signal on the next candle. indicator test results within 2 months are very satisfactory, accuracy exceeds 85%. very optimal run in markets that issue news (medium impact and high impact). so of course it is very optimal, only a 1 month and lifetime trial is available.For orders, please go to the telegram developer: https://t.me/AgresivetradingSupport (@agresi
MetaTrader Маркет - единственный магазин, где можно скачать демоверсию торгового робота и подвергнуть его проверке и даже оптимизации на исторических данных.
Прочитайте описание и отзывы других покупателей на заинтересовавший вас продукт, скачайте его прямо в терминал и узнайте, как протестировать торгового робота перед покупкой. Только у нас вы можете получить представление о программе, не заплатив за неё.
Вы упускаете торговые возможности:
- Бесплатные приложения для трейдинга
- 8 000+ сигналов для копирования
- Экономические новости для анализа финансовых рынков
Регистрация
Вход
Если у вас нет учетной записи, зарегистрируйтесь
Для авторизации и пользования сайтом MQL5.com необходимо разрешить использование файлов Сookie.
Пожалуйста, включите в вашем браузере данную настройку, иначе вы не сможете авторизоваться.