Смотри обучающее видео по маркету на YouTube
Как купить торгового робота или индикатор
Запусти робота на
виртуальном хостинге
виртуальном хостинге
Протестируй индикатор/робота перед покупкой
Хочешь зарабатывать в Маркете?
Как подать продукт, чтобы его покупали
Технические индикаторы для MetaTrader 4 - 121

Better Period Separators For MetaTrader 4 The built-in period separators feature doesn’t allow users to specify the time period, so you can use this indicator to create more customizable period separators. On intraday charts, you could place period separators at a specific time, you could also place extra period separators at a specific time on Monday to mark the start of a week. On higher timeframe charts, this indicator works the same as the built-in period separators, On the daily chart, peri

Bank Expert Indicator Uses A Simple method of tracking price as it moves across the chart and signals when a potential long or short position is active and indicates this to the trader giving you the opportunity to take a position on the market. Or you can simply use this indicator to give yourself signals and determine if you want to take the trade or learn the strategy on your own. The Signals From this indicator are targeted at long-term positions and focus on top quality call outs.
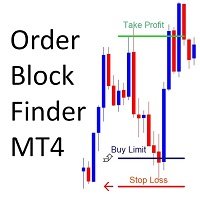
!! FLASH SALE !! Over 80% off !! For ONE week only. Now only $47 - normally $297! >>> Ends on 30 June 2023 - Don't miss it!
Sends Alerts – On MT4 To Your Phone To Your Email
Does not repaint .
Works on any Forex pair, any timeframe.
10 Activations allowed so you are free from limitations >> MT5 Version Here
For spreads from a tiny 0.1 pips RAW/ECN Accounts, click here . Check out my Waka Esque EA signal here: >> High Risk Settings or Medium Risk Settings .
What Is An
The indicator is coded to be suitable for every parity and every period. The purpose of the indicator is to capture the correct signal levels. The product is equipped with all notification and alarm options. In this way, you will be able to receive signals even if you are not at the screen. The product tries to find the signals in the trend direction as a strategy. Thus, it is more reliable. you have input signals. For default settings, recommended periods should be M15,M30,H1.

Innovative Max Min swing This is a really different indicator for drawing Max and Min on the charts. This indicator draws Min and Max levels in a innovative way, based on a volatility proprietary calculation. In this way you will be able to draw trendlines in an objective way and also to see the break of Max and Min levels. You have three paramaters you can play with, in order to suite the volatility to your trading style. The indicator works on every time frame. Added: - Sound Notification
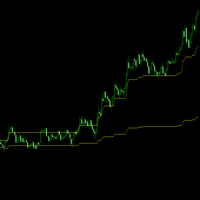
Is the market ranging (balance) or trending (Imbalance) ? This indicator exports a huge concept used in volume analysis (value area) into the price action. It makes it on Intraday level. How to read it? Simple! But you need to make practice. Making profit in market is more than a 2-rule system.
When the price inside the lines, the market is in "range mode".
If the price is above the upper line, the market is trending up.
If the price is below the lower line the market is trending down

Clear trend filter This is a filter-trend indicator. From the settings you can select to use more filter or less. The very interesting part of the indicator comes out using with all the filter. In this way you can follow the trend easily even when the market is without a strong trend, but is instead more flat. I personally use it on 1 minutue timeframe with MORE FILTER (you can select it from the input setting) in order to have an overlook of trend in the market. Added: - Sound Notificatio
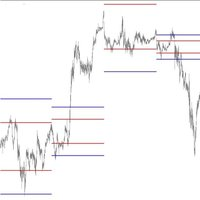
Equilibrium Levels support resistence Intraday indicator --> it means it works on lower TimeFrames , from 1minute to 4hours. This indicator is able to calculate and draw 2 levels (1 support and 1 resistence) representing the Barycenter's levels for a specific day session. From the setting you can choose only one parameter, that's the lenght of Barycenter's orbit. I personally attach the same indicator 2 times on the same chart, inputting as orbit: 0.15 and 0.30. Then what you will no
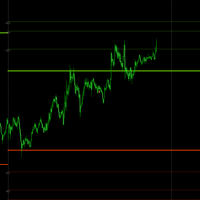
This indicator draws the projections of Fibonacci above the yesterday high and below the yesterday low. Why?
1) First of all, in this you can take the pulse of the market (trend or range). For instance If the price runs above yesterday's high the trend is UP.
2) In this way you will have automatic targets for the trend
3) you can wait the market on excess levels for contrarian and low risk trades.
If you buy the product feel free to contact me for additional tips or info.
I wish you
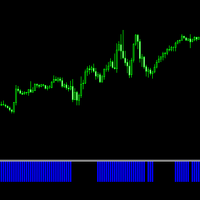
This is a clear and simple filter I've created based on a Ichimoku strategy and setup. I personally like to use the indicator in a multi timeframe approach. It can be used in a double way:
1) Every time the indicator change the colour, you can use the this first change as your trigger point.
2) You can follow the indicator for the trend direction and trade with your other signals.
Added: - Sound Notification - PopUp Notification - Mobile Push Notification (To make it work follow
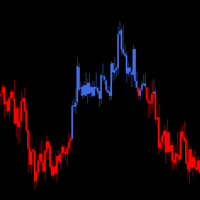
Never aginst the trend This is a really top indicator indicating the main trend in a clear and easy way. I reccomend you to use it on multiple timeframe in order to create a powerful view and strategy. It works on every market in the same way. If you trade against the trend you will work more for less, so stick with the trend. I hope you will find it useful. All the best with your trading! Keep it simple stupid, is the way! Added: - Sound Notification - PopUp Notification - Mobile Push Noti
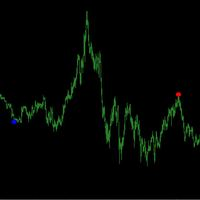
Semi automatic system John Bollinger bands Entry Bollinger Excess with Filter.With this indicator you can build your own semi-automatic strategy based on bollinger bands excess. You can play with the settings to find the best solution for your style and trading attitude. The indicator shows a signal whenever it finds a trigger-entry(coded inside) based on bollinger bands excess and an additional trend-filter(moving average). This tool will support your manual trading in order to easily spot
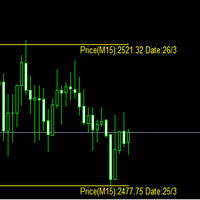
This indicator can spot strong volume levels on different timeframes. Everything is customised from the setting. You can hide by the colour the leveles you don't need. In this way you will map the market with reaction zone and you can use them as target levels or entry levels depending on your strategy. Hope you will find it useful and all the best with your trading. Added: - Sound Notification - PopUp Notification - Mobile Push Notification (To make it work follow the instructions: htt

'Zig Zag Percentage strenght' This indicator is awesome. Why? It's able to show the percentage of the last leg, compared with the previous leg. In this way you have a better understanding of the forces in play in that moment. In fact, for example, if you see that the up extensions are, in percentage, greater of the down legs, that means that there is more bullish pressure or maybe the market is starting to reverse from downtrend to uptrend. Hope you will ind it useful !
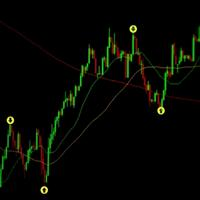
Indicator with 95% Assertiveness
Average of 2% to 3% per day of the value of your capital
Indicator that directs buy and sell entries based on bullish and bearish price targets.
Here are some settings to make it operational:
Currency pair: XAUUSD Timeframe: 15 Minutes Do not operate with news Better nighttime performance
Easy setup Full support
Schedule Take Profit to 100 pips
Entry only on the second candle
Any further queries, please get in touch. Support via WhatsApp.

Приручить тренд стало ещё проще! Об изменении настроения цены просигнализирует PDS индикатор. Всего одна настройка!
Изучите работу индикатора и получите возможность для прибыльных сделок на основе проверенной и протестированной стратегии. Математический алгоритм докажет даже скептикам свою работоспособность при любых рыночных условиях. Прекрасно сочетается с любой торговой стратегией. Никогда не пересчитывает сигналы. Сигналы появляются по октрытию нового бара. Работает с любыми финансовыми
Based on Trend Following Strategy, QCAFE SUITE was built to get more accurate signal for Traders to decide whether to enter trades, included in the SUITE is QCAFE+ filter to eliminate false signals. The Signals are generated based on formula of Hull Moving Average ( HMA ) to minimize the lag of a traditional moving average - developed by Alan Hull in 2005 Setting: Limited Bars of back test Fast Period Low Period Fast/Low period to generate Buy/Sell signal
Based MA Period B ased Moving Averag

True Order Blocks is an excellent indicator for day traders, swing traders, and even scalpers. It is combined with multiple market-moving strategies. It identifies market structure, marks supply and demand zones, displays imbalance moves, structure break, trendline breakout, and much more. True order blocks are compatible with forex, stocks, cryptocurrency, and any market with any timeframe. NOTICE:- CONTACT ME TO GET FREE ACCESS OF ADVANCED TREND
And I'll show you how to use this tool in yo
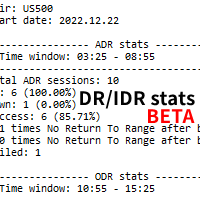
Based on the free DR/IDR indicator but with basic stats. Has the feature to export the daily data to a HTML file. So you can check the daily DRs yourself. Be mindful that the stats can vary from different broker feeds. So make sure your MT4 has enough data.
Scroll back in your MT4 and check for any gaps in the feed. Sometimes you will have to scroll back to update the stats. Feel free to contact me for questions related to the purchase, installation and use of the Indicator.
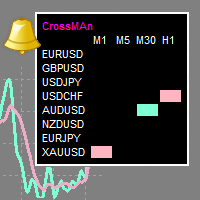
"CrossMAn" - индикатор-таблица, который даёт сигналы о пересечении двух скользящих средних , н а выбранных инструментах и временных периодах .
Пересечение скользящих средних один из самых популярных сигналов на бирже.
Сигнал отображается в виде цветных прямоугольников в таблице. Таким образом, можно одним взглядом оценить, какому инструменту стоит уделить внимание.
(Crossman не добавляет скользящие средние на график.)
Таблицу индикатора можно перетаскивать мышью.
Размер таблицы зав

rsi sniper It has the strategy of an rsi line where the same indicator marks you buy and sell , When the line turns red, it marks a sale, it comes with alerts! + a red arrow that also confirms the sale, the same for the purchase, when the line becomes true mark sale, plus the alert accompanied by the phlegm that marks on the candle! works for all seasons ideal for scalping and day trading, suitable for forex and synthetic indices, all pairs are tradeable ! enjoy the sniper!

We’ll start off by just testing the default DMI crossover strategy. We’ll buy when the 14-period DMI-plus crosses above the 14-period DMI-minus, and sell once the former crosses below the latter. Here are the results: As you see, the strategy seems to work well in bull markets. Still, this isn’t something we’d like to trade in its raw form! So how could we go about improving the strategy? We’ll one common approach is to demand that ADX is above 25. However, in our tests, we’ve found out that a l

The Accelerator MT4 forex indicator was designed by Bill Williams’ and warns you of early trend changes for any currency pair. The indicator is also known as the Accelerator/Deceleration forex indicator. It basically looks for changes in momentum, either accelerating or decelerating. As you can see from the EUR/USD H1 chart shown below, the indicator draws green and red bars above and below the 0.00 level. Green and red bars above the 0.00 level suggest bullish momentum in price (price goes up).

Prometheus Trade Engine is an indicator that combines price action, ratio based indicator with custom indicators& other lagging indicators to create this leading indicator that has a multi-timeframe approach to trading so that you are able to see what other timeframes are doing all in one chart and give you high probability trade setups to assist you to make a prediction on what is MOST likely to happen in the market going foward
Chart Features 1. Reversal Zone
It is the rectangular box on
Parabolic SAR Parabolic SAR Technical Indicator was developed for analyzing the trending markets. The indicator is constructed on the price chart. This indicator is similar to the Moving Average Technical Indicator with the only difference that Parabolic SAR moves with higher acceleration and may change its position in terms of the price. The indicator is below the prices on the bull market (Up Trend), when it’s bearish (Down Trend), it is above the prices. If the price crosses Parabolic SAR

Everyday trading represents a battle of buyers ("Bulls") pushing prices up and sellers ("Bears") pushing prices down. Depending on what party scores off, the day will end with a price that is higher or lower than that of the previous day. Intermediate results, first of all the highest and lowest price, allow to judge about how the battle was developing during the day. It is very important to be able to estimate the Bears Power balance since changes in this balance initially signalize about possi

Everyday trading represents a battle of buyers ("Bulls") pushing prices up and sellers ("Bears") pushing prices down. Depending on what party scores off, the day will end with a price that is higher or lower than that of the previous day. Intermediate results, first of all the highest and lowest price, allow to judge about how the battle was developing during the day. It is very important to be able to estimate the Bears Power balance since changes in this balance initially signalize about possi

Everyday trading represents a battle of buyers ("Bulls") pushing prices up and sellers ("Bears") pushing prices down. Depending on what party scores off, the day will end with a price that is higher or lower than that of the previous day. Intermediate results, first of all the highest and lowest price, allow to judge about how the battle was developing during the day. It is very important to be able to estimate the Bears Power balance since changes in this balance initially signalize about possi
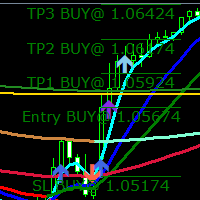
Вы можете комбинировать этот индикатор с советником Assistant.
ПОМОЩНИК MT4: https://www.mql5.com/en/market/product/91340
ПОМОЩНИК MT5: https://www.mql5.com/en/market/product/97828
Индикатор Enhanced Momentum Weighted Moving Average (EMWMA)
Индикатор Enhanced Momentum Weighted Moving Average (EMWMA) представляет собой сложную разновидность традиционной скользящей средней, тщательно разработанную для улавливания и усиления рыночного импульса при минимизации ложных сигналов. Он был то

Индикатор трендового сигнала. Показывает трейдеру стрелками на графике точки разворота цены и направление тренда. Когда появляется красная стрелка, цена разворачивается вниз. Когда появляется синяя стрелка, цена разворачивается вверх. Индикатор не перерисовывает свои значения. Не перерисовывает стрелки. Стрелка появляется вначале свечи. Можно регулировать точность сигналов с помощью параметров "period_long" и "period_short". Если поставить значения этих параметров меньше, индикатор будет показыв
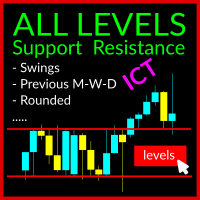
The Swing Levels Support and Resistance Indicator is a robust tool designed for MetaTrader 5 traders (also available for MT4). It aids in identifying crucial market levels where price direction may change by showcasing: Swing High and Swing Lows across all timeframes Previous Highs and Lows for Day, Week, and Month ICT US Midnight level and Yesterday Midnight Level ICT US Preopen 8:30 AM Level Rounded Levels This indicator features a toggle button, enabling you to display or hide these levels o
An Ultimate Tool for quick and efficient market analysis. Unique combination of solid indicators defining market direction for trend tracking and filtration designed for you to stay on the right side of the market.
Market Rider Tools gives you access to one of the most used from professional trades indicators on worldwide, which were not build in for MT4 and MT5 terminals . These are unique non-repainting indicators designed to be used on all time frames for all instruments classes: Fore

An Ultimate Tool for quick and efficient market analysis. Unique combination of solid indicators defining market direction for trend tracking and filtration designed for you to stay on the right side of the market.
Market Rider Oscillators gives you access to one of the most used from professional trades indicators on worldwide, which were not build in for MT4 and MT5 terminals . These are unique non-repainting oscillators designed to be used on all time frames for all instruments class

This Nice Trade Point indicator is designed for signal trading. This indicator generates trend signals.
It uses many algorithms and indicators to generate this signal. It tries to generate a signal from the points with the highest trend potential.
This indicator is a complete trading product. This indicator does not need any additional indicators.
The indicator certainly does not repaint. The point at which the signal is given does not change.
Features and Suggestions Time

Индикатор показывает точки разворота цены на золоте и других валютных парах. Рекомендуемые периоды для работы: M1, M5, M15, M30, H1. Индикатор анализирует рынок и точками показывает трейдеру где есть вероятность разворота цены в другую сторону. Точность сигналов зависит от настроек, периода и выбраного режима работы. В среднем точность сигналов до 93%, что подходит для торговли по стратегии скальпинга внутри дня. Вы можете управлять точность сигналов индикатора с помощью параметра в настройках "

Этот инструмент определяет реальное движение, используемое рынком, с помощью настоящих математических расчетов, основанных на изменениях цены. Работа TradeighT основана на этой математической зависимости, которая существовала всегда. Большинство инвесторов смотрят на одни и те же параметры и изучают одну и ту же информацию, и именно поэтому большинство из них несёт убыток. Это продукт основан не столько на идеях большинства, сколько на 4-х фундаментальных принципах, которые управляют ры

This indicator labels swing highs and swing lows as well as the candle pattern that occurred at that precise point. The indicator can detect the following 6 candle patterns: hammer , inverse hammer , bullish engulfing , hanging man , shooting star and bearish engulfing .
The notations HH, HL, LH, and LL you can see on the labels are defined as follows:
HH : Higher high
HL : Higher low
LH : Lower high
LL : Lower low
Setting
Length: Sensitivity of the swing high/low de

Lets dabble a bit into Elliot Waves.
This is a simple indicator which tries to identify Wave 1 and 2 of Elliot Impulese Wave and then projects for Wave 3.
Ratios are taken from below link: https://elliottwave-forecast.com/elliott-wave-theory/ - Section 3.1 Impulse
Wave 2 is 50%, 61.8%, 76.4%, or 85.4% of wave 1 - used for identifying the pattern. Wave 3 is 161.8%, 200%, 261.8%, or 323.6% of wave 1-2 - used for setting the targets
Important input parameters MaximumNumBars : To calculate

Индикатор Price Action Finder Multi это индикатор точек входа, который ищет и отображает паттерны системы Price Action сразу на десятках торговых инструментов и на всех стандартных таймфреймах: (m1, m5, m15, m30, H1, H4, D1, Wk, Mn). Найденные паттерны индикатор помещает в таблицу в нижней части экрана. Кликая на названия паттерна в таблице вы можете перемещаться на график, где этот паттерн находится. Инструкция/Мануал ( Обязательно читайте перед приобретением ) | Версия для МТ5 Преимущества
1.
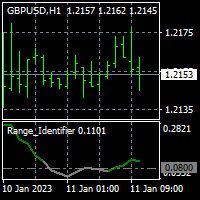
To get access to MT5 version please click here . - This is the exact conversion from TradingView: "Range Identifier" By "Mango2Juice". - All twelve averaging options are available: EMA, DEMA, TEMA, WMA, VWMA, SMA, SMMA, RMA, HMA, LSMA, Kijun, McGinley - This is a light-load processing and non-repaint indicator. - Buffer is available for the main line on chart and not for thresholds. - You can message in private chat for further changes you need.

Индикатор изменяет текущий таймфрейм графика в зависимости от просадки в валюте депозита, от количества ордеров или процента от депозита. Вы можете задать просадку в валюте депозита, количестве ордеров одного направления или проценте от депозита, при которых текущий таймфрейм изменится на выбранный. Это значительно сокращает просадку при работе советников использующих сети ордеров.
Параметры индикатора:
Просадка в валюте, ордерах или процент от депозита
Основной таймфрейм
Первый уровень

Анализ нескольких таймфреймов валютной пары в одном окне может вас запутать.
Для анализа нескольких таймфреймов вам нужны надежные индикаторы.
Один из них использует 9TF Double RSI Double MA.
Я работал день и ночь, чтобы создать простой, но надежный код, покрывающий все девять таймфреймов всего в одном индикаторе.
Давайте рассмотрим некоторые преимущества этого индикатора:
Двойной RSI, то есть RSI быстрее и RSI медленнее. Двойная MA, то есть MA быстрее и MA медленнее. 10 цветовая схем

Анализ нескольких таймфреймов валютной пары в одном окне может вас запутать.
Для анализа нескольких таймфреймов вам нужны надежные индикаторы.
Один из них использует 9TF Double CCI Double MA.
Я работал день и ночь, чтобы создать простой, но надежный код, покрывающий все девять таймфреймов всего в одном индикаторе.
Давайте рассмотрим некоторые преимущества этого индикатора:
Двойной CCI, то есть CCI быстрее и CCI медленнее. Двойная MA, то есть MA быстрее и MA медленнее. 10 цветовая схем

Identify Engulfing candle pattern with Arrows & Alert ( built-in RSI filter). This indicator helps you to identify Engulfing candle pattern or Outside bar (OB) on the chart with arrows, along with an alert when a new Engulfing candle appears. Engulfing candle pattern is one of the most important reversal Price Action signals. You can choose between standard Engulfing (Engulfing based on candle body) or non standard Engulfing (Engulfing based on candle high - low )
Alerts can be turned on a
MUST READ CAUTION BEFORE PURCHASE
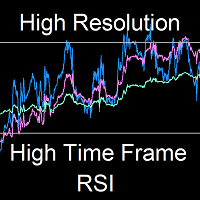
This one-of-a-kind indicator displays the instantaneous high resolution High Time Frame Relative Strength Index (HTF RSI), where up to three higher time-frame RSI's can be displayed simultaneously on the current chart. The indicator differs drastically from previous multi-time-frame RSI indicators in that it displays the high resolution bar-by-bar calculation of the HTF RSI - and not just the discrete values at the HTF bar closings. This allows for earlier

Identify Pinbar Candle Pattern with Arrows & Alert (built-in RSI filter).
This indicator helps you to identify Pin bar Candlestick Pattern (or shooting star & hammer pattern) on the chart with arrows, along with an alert when a new Pin bar appears. Pin bar pattern is one of the most important reversal Price Action signals.
You can set Minimum Percent of Wick (or Tail) Length over full bar length (Recommended: 60%, 70%, 75%).
Alerts can be turned on and off: Popup Email Push Notification S
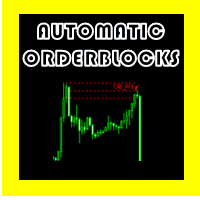
АВТОМАТИКА БЛОКИ ЗАКАЗА OSW
(МЕТАТРЕЙДЕР 5)
Этот индикатор отвечает за отображение Блоков ордеров по некоторым заранее установленным правилам, среди которых:
>что есть импульс, который ломает предыдущий импульс.
> Когда он найден, он отвечает за поиск сформированного паттерна свечи, чтобы рассчитать наиболее эффективным способом максимум и минимум места, чтобы создать максимум и минимум блока ордеров.
>После того, как блок ордеров создан, индикатор постоянно проверяет, пересекает ли к

Fibonacci por color en niveles para aplicar estrategia profesional inicialmente se coloca en el punto mas alto del dia y mas bajo con esto es para ubicar operaciones a una distancia exacta con lo cual se busca generar ganancias residuales internas en el mismo dia con esto las lineas fusias es para colocar las entrdas sell y las lineas verdes amarillas van los buy

This Trusty Strong Arrow indicator is designed for signal trading. This indicator generates trend signals.
It uses many algorithms and indicators to generate this signal. It tries to generate a signal from the points with the highest trend potential.
This indicator is a complete trading product. This indicator does not need any additional indicators.
The indicator certainly does not repaint. The point at which the signal is given does not change.
Features and Suggestions Ti
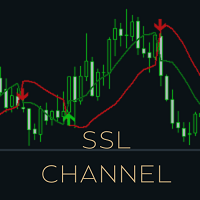
Known as the SSL , the Semaphore Signal Level channel chart alert is an indicator that combines moving averages to provide you with a clear visual signal of price movement dynamics . In short, it's designed to show you when a price trend is forming. This indicator is nothing but two 10-period simple moving averages with one applied to the high of the price and the other applied to the low of the price, therefore forming an envelope that follows the market price. The idea is to trade based on t
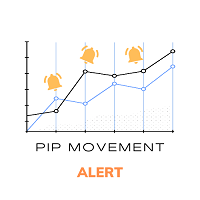
This is a basic indicator which is very useful for professional traders. The idea is to track every X pip movement in any symbol. It is a multicurrency indicator. So it will track the pip movements in all specified symbols. When there is absolute pip value price will appear (e.g 1.178500, 1.178600, 1.178700 ) it will signal the user in alert, mobile app and notification This pip step is configurable. This will help identify sudden movement in market as there will be lots of signals at that time

MT5 Version Kill Zones
Kill Zones allows you to insert up to 3 time zones in the chart. The visual representation of the Kill Zones in the chart together with an alert and notification system helps you to ignore fake trading setups occurring outside the Kill Zones or specific trading sessions. Using Kill Zones in your trading will help you filter higher probability trading setups. You should select time ranges where the market usually reacts with high volatility. Based on EST time zone, followi
Индикатор использует сложный алгоритм, который позволяет ему обнаруживать потенциальные развороты тренда. На основе его кода, индикатор сравнивает движение цены со средним диапазоном свечей. Так же индикатор показывает места флета где появляется разворот и приостанова движения цены Работает на любой валютной паре, с любым таймфреймом Дополнительно можно встроить передачу сигналов в телеграм, Выбор цветов позволяет пользователю настроить свою цветовую гамму.

[ MT5 Version ] [ Kill Zones ] [ SMT Divergences ] How to trade using Order Blocks: Click here Experience the ultimate in trading precision with the Order Blocks ICT indicator, designed to empower traders with unparalleled insights into market dynamics. This advanced tool leverages order flow and volume analysis to reveal crucial buying and selling pressures driving price action. Why Choose Order Blocks ICT? Unleash Market Insights: Order Flow Analysis: Discern buying and selling pressure

Это стратегия, основанная на ценовом действии, известная как 3Bar_Play, и она основана на формировании свечного паттерна 3Bar. Добавлены дополнительные индикаторы для фильтрации и подтверждения перед появлением стрелок сигнала покупки/продажи. Торговать им можно как на восходящем, так и на нисходящем или боковом рынке. Добавлены индикаторы: Стохастик - Импульс Фишер - Тренд ATR - волатильность, которая также четко определяет размещение стоп-лосса у основания сигнальной стрелки (используя метод

Готовая торговая стратегия для скальпинга на периоде M5 (таймфрейм М5), на любой валютной паре. Торговая стратегия протестирована и показала хорошую эффективность. Скальпировать по этой стратегии сможет каждый трейдер, даже начинающий. Для начала торговли Вам нужно открыть на ПК свой Metatrader4, загрузить с єтой страниці индикатор "Scalping signal indicator" и добавить его на график той валютной пары, на которой вы хотите торговать. Таймфрейм нужно выбрать М5 (на других таймфреймах индикатор не
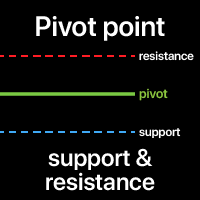
A Pivot point is used to determine the overall market trend. The pivot level itself is the average of the high and low, and the closing price from the previous bar.
On the next bar trading above the pivot point is thought to indicate ongoing bullish sentiment, while trading below the pivot point indicates bearish sentiment.
The pivot point is the basis for the indicator, but it also includes other support and resistance levels that are projected based on the pivot point. All these levels h

PSAR Scanner Dashboard for MT4:
(Multi-timeframe and Multi-currency) Parabolic SAR (Stop and Release) Indicator is mainly for analyzing the trending markets. And this dashboard will look for the switch and also other strategies. Features: Scan for PSAR Switch Show how many bars back the switch happened Check ADX line is between min and max range specified Check -DI > +DI for SELL And +DI > -DI for BUY Check Higher Timeframe PSAR Alignment Check if Moving Averages are stacked in an up/down trend
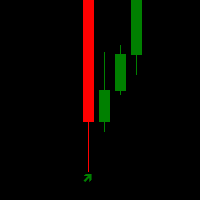
Скачай для работы индикатора фильтр BetterVolume_1_4.mq4 https://drive.google.com/file/d/1Mgsjj7MxZn9yTjwyL7emKkfQKorl40AJ/view?usp=sharing
Стрелочный индикатор без перерисовки показывают потенциальные точки входа в рынок в виде стрелок соответствующего цвета: стрелки вверх (обычно зеленые) предлагают открыть покупку, красные стрелки вниз – продажу. Появление стрелок может сопровождаться звуковыми сигналами. Обычно предполагается вход на следующем баре после указателя, но могут быть и нестанда

This Special Strong Arrows indicator is designed for signal trading. This indicator generates trend signals.
It uses many algorithms and indicators to generate this signal. It tries to generate signals from the points with the highest trend potential.
This indicator is a complete trading product. This indicator does not need any additional indicators.
The indicator is never repainted. The point at which the signal is given does not change. When the signal comes the arrows are put back one

the Super Smart Candles detection indicator
It detects the major breakout Candles amplified by the volume and Candle body size and shows it in a separate window to give a great indication of market power - if Bears dominates :: you will see big Red lines during the day bigger than green ones - if Bulls dominates :: you will see big Green lines during the day bigger than red ones It works on any time frames indicator inputs * frequency : from 1 t0 4 : : higher value gives more signals - l
The Essential Trader indicator is more comfortable with whipsaw/ranging market conditions. It is not a complicated trading indicator and can be used on any timeframe with high level of confidence. Besides, it has notifications and alerts. The dotted essential points show spots where you can make immediate entries and benefit from breakout on either side of the region. On the other hand, the color filled points display reversal regions. These are important in that you can trade along the trend or

This Pure Super Signal indicator is designed for signal trading. This indicator generates trend signals.
It uses many algorithms and indicators to generate this signal. It tries to generate signals from the points with the highest trend potential.
This indicator is a complete trading product. This indicator does not need any additional indicators.
The indicator is never repainted. The point at which the signal is given does not change. When the signal comes the arrows are put back one
Индикатор специализирован для применения в стратегии скальпирования. Имеет возможность подавать сигналы на покупку/продажу. сигналы индикатор выделяет при формировании всякого свежего тика и инвестор имеет возможность их применить не по одиночку, а с учетом n колличества конкретных сигналов за конкретное время. Другими текстами , нужно учитовать в какую сторону индикатор советует осуществлять торговлю в собственных 5-7 последних сигналах. Этот индикатор не ре
IconTradeSL. Возможность выставлять sl по уровням. В индикаторе установлена возможность показывать историю уровней на графике. Возможность выставлять sl по уровням. Настройки индикатора: ЦВЕТ_BAR - цвет баров по которым ищем SL
ЦВЕТ_Тек_BAR - Purple;//цвет текущего бара
BAR - поиск в последних BAR барах (по умолчанию 200)
show_bar - показывать бары по которым ищем SL

5nos. Exponential Moving Average (EMAx5) in One. A simple trend indicator for Day/Intra day trading. Perfect indicator for Price Action and clean chart traders. Features x5 Exponential Moving Averages EMA plus settings and option to choose either 1 or 2 or 3 to display on chart. A toggle button to hide/show indicator on chart while maintaining clean chart objectives. RED Off/GREEN On Set toggle button on any corner of the chart, adjust size of button and edit button text. Great analysis tool to
Устали быть желающим стать сотрудником Уолл-стрит и постоянно сомневаться в своих сделках? Ну, отложите гадалку и вступите в 21 век с индикатором "Current Support and Resistance" для MT4! Этот малыш будет вашим надежным спутником, анализируя рынок с глубиной, которая завидует Шерлоку Холмсу. Но это не просто одна трюковая лошадка, о нет. У него есть опции, детка! Вы хотите увидеть уровни сопротивления и поддержки на графике 1 минуты? Сделано. А как насчет еженедельного графика? Вы его имеете. И
This Perfective Signal System indicator is designed for signal trading. This indicator generates trend signals.
It uses many algorithms and indicators to generate this signal. It tries to generate a signal from the points with the highest trend potential.
This indicator is a complete trading product. This indicator does not need any additional indicators.
The indicator certainly does not repaint. The point at which the signal is given does not change.
Features and Suggestions

Доступен точный индикатор CCI.
Dashboard Trend Bar Smart Level 9TF Double CCI. Двойной CCI, то есть быстрый CCI и медленный CCI Зачем вам вторая ТПП? Использование дополнительных индикаторов убедит нас в реальной торговле 9TF Быстрая кривая CCI 9TF Медленная кривая CCI 9TF угол CCI в реальном времени 9TF значение CCI в реальном времени 9TF направление/фаза CCI в реальном времени Бар тренда 9TF Новый алгоритм расчета тренд-бара Кнопка включения/выключения. Очень удобно показывать/скрывать инди

Доступен точный индикатор RSI.
Dashboard Trend Bar Smart Level 9TF Двойной RSI. Двойной RSI, то есть быстрый RSI и медленный RSI Зачем нужен второй RSI? Использование дополнительных индикаторов убедит нас в реальной торговле 9TF Быстрая кривая RSI 9TF Медленная кривая RSI 9TF угол RSI в реальном времени Значение RSI 9TF в реальном времени 9TF направление/фаза RSI в реальном времени Бар тренда 9TF Новый алгоритм расчета тренд-бара Кнопка включения/выключения. Очень удобно показывать/скрывать и
MetaTrader Маркет - единственный магазин, где можно скачать демоверсию торгового робота и подвергнуть его проверке и даже оптимизации на исторических данных.
Прочитайте описание и отзывы других покупателей на заинтересовавший вас продукт, скачайте его прямо в терминал и узнайте, как протестировать торгового робота перед покупкой. Только у нас вы можете получить представление о программе, не заплатив за неё.
Вы упускаете торговые возможности:
- Бесплатные приложения для трейдинга
- 8 000+ сигналов для копирования
- Экономические новости для анализа финансовых рынков
Регистрация
Вход
Если у вас нет учетной записи, зарегистрируйтесь
Для авторизации и пользования сайтом MQL5.com необходимо разрешить использование файлов Сookie.
Пожалуйста, включите в вашем браузере данную настройку, иначе вы не сможете авторизоваться.