Смотри обучающее видео по маркету на YouTube
Как купить торгового робота или индикатор
Запусти робота на
виртуальном хостинге
виртуальном хостинге
Протестируй индикатор/робота перед покупкой
Хочешь зарабатывать в Маркете?
Как подать продукт, чтобы его покупали
Технические индикаторы для MetaTrader 4 - 129

В мире торговли бинарными опционами, где точный анализ рынка и стратегическое принятие решений играют решающую роль, поиск идеального индикатора, способного открывать прибыльные возможности, никогда не прекращается. Введите Secret Indicator – удивительный инструмент для торговли бинарными опционами MT4, заслуживший репутацию лучшего и самого мощного в своем классе.
Secret Indicator – результат многолетних тщательных исследований, разработки и тестирования командой опытных трейдеров и экспертн
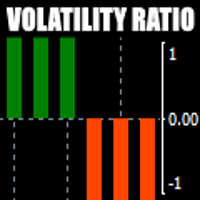
There is always a need to measure if the market is "quiet" or it is volatile. One of the possible way is to use standard deviations, but the issue is simple : We do not have some levels that could help us find out if the market is in a state of lower or higher volatility.
This indicator is attempting to do that : • values above level 0 are indicating state of higher volatility (=GREEN buffer) • values below level 0 are indicating state of lower volatility (=RED buffer)
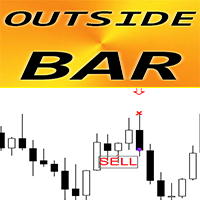
Forex Indicator OUTSIDE Bar Pattern for MT4 Indicator " OUTSIDE Bar " is very powerful indicator for Price Action trading : No repaint, No delays; Indicator detects OUTSIDE Bar patterns on chart: Bullish OUTSIDE Bar - Blue arrow signal on chart (see pictures) Bearish OUTSIDE Bar - Red arrow signal on chart (see pictures) P C, Mobile & Email alerts are included Indicator " OUTSIDE Bar Pattern " is excellent to combine with Support/Resistance Levels: https://www.mql5.com/

Представляем PivotXpert , усовершенствованный индикатор Multichart , разработанный для улучшения вашей стратегии точек разворота. Раскройте свой потенциал без особых усилий с помощью интуитивно понятного интерфейса, который делает сводную торговлю легкой.
Мультиграфический режим PivotXpert упрощает вашу торговлю, рисуя опорные линии на всех открытых графиках. Легко рассчитайте оставшиеся пипсы до каждого уровня с помощью функции CalculatePips, которая с легкостью настраивает вашу стра

Индикатор показывает точки входа. Индикатор не перерисовывает и не исчезает в истории. Индикатор может служить дополнением вашей торговой стратегии. При желание можно настроить индикатор как на агрессивную торговлю( но в этом случае будет много ложных сигналов) так же на пассивную торговлю. Хорошие показатели индикатор показывает сигналы на валютной паре GBPUSD на минутном таймфрейме.

Strength of 8 popular currencies (EUR, GBP, USD, CAD, AUD, NZD, CHF, JPY) is calculated from 28 pairs of Forex market following a Moving Average with custom period and method. You can use it by adding 2 indicators to the chart of Forex pair based on the pair currencies and use it as a confirmation on your strategies.
Currencies: EUR, GBP, USD, CAD, AUD, NZD, CHF, JPY
Inputs: Currency: 1 of the 8 currencies MA Period: Period of Moving Average MA Method: Method of Moving Average (SMA, EMA, S

Channel Vertex is a price action pattern formed by price Chanel and a triangle pattern . Price channels basically indicates possible support and resistance zones around a price movement and retracement or breakout at these levels can indicate possible trend continuation or reversal .
Majority of the times price fluctuations forms triangle patterns defined by 3 vertexes , these triangle patterns most times defines a trend continuation. A triangle pattern is a trend continuation pattern tha

Индикатор "Ultimate Non Repaint Smart" - интеллектуальная система торговли без перерисовки.
Обзор продукта:
Индикатор "Ultimate Non Repaint Smart" - мощный инструмент для трейдеров на платформе MT4, который помогает оптимизировать анализ рынка и принятие торговых решений. Благодаря комбинации различных показателей и умных систем, этот индикатор не только помогает определить потенциальные точки покупки и продажи, но также предоставляет надежные торговые сигналы.
Основные характеристики:

This is an advanced index algorithm, it provides a very accurate top-bottom signal, it will not frequently appear the wrong signal during the trend, this index does not have any redrawing, drift, or lag behavior. When this signal appears on the chart, it means that the market is about to reverse, or that a period of trend market is over, and then the market will be transformed into a consolidation market, and this indicator does not need to adjust the parameters. It applies to any currency pai

This indicator is very advanced. I dare say that there is no second indicator in the world that describes false breakthroughs so accurately. When the market hits a certain level three times in a row, the market will first break through this level and then return to the inside of the horizontal line. At this time, our indicator will send a signal to alarm that this is a standard fake breakthrough, the index has not been redrawn, the signal has not been delayed, and everything is true and reliable
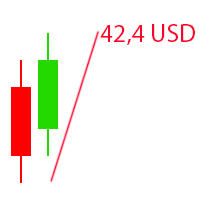
The Visual Result Calculator Indicator is a powerful tool designed to enhance your trading experience on the MetaTrader platform. This intuitive and user-friendly indicator allows you to visualize potential profits or losses on a trading chart, helping you make better-informed decisions and manage your trades with precision. The Indicator displays a dynamic line on the trading chart, representing the potential profit or loss of a trade based on the start and end of the line. Simply click and d

PowerXXX measures the power of the current candlestick and displays it in numerical format and colors. The indicator can cover multiple timeframes and can be placed on the main chart or on the charts of the underlying indicators. The number of timeframes is selectable, as well as the color levels according to the power expressed. In the latest version, the power can be expressed as a function of the opening of the candle itself or as a function of the opening of the total candles before. There

Представляем Binary Smart System: Ваш идеальный торговый компаньон Binary Smart System — это не просто индикатор, это сложный торговый инструмент, тщательно разработанный для обеспечения трейдеров точными и своевременными сигналами на различных рынках. Основываясь на передовых алгоритмах и обширной коллекции технических индикаторов, эта система является ключом к успеху в торговле. Компоненты индикатора: Процентное значение скользящей средней (MAP) : Этот компонент вычисляет взвешенное среднее зн
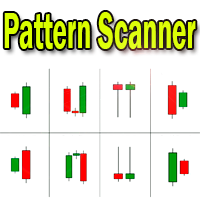
Индикатор свечных паттернов - отображение на графике найденных свечных паттернов. MT5-version: https://www.mql5.com/en/market/product/103134 Медвежьи паттерны: Обозначения медвежьих паттернов Название паттерна SS
Падающая звезда ( Shooting Star) STR(E) Вечерняя звезда ( Evening Star) DJ(E) Звезда доджи вечерняя ( Evening Doji Star) DC Завеса из темных облаков (Dark Cloud) BEP Медвежье поглощение (Bearish Engulfing) Бычьи паттерны: Обозначение бычьих паттернов Название паттерна HMR

Using Standard Deviation but not sure if the Standard Deviation is high or low?
eRSD or Easy Relative Standard Deviation comes to your help. Using this you can get a ratio of Standard Deviation to Moving Average and make a good judgement about whether the Standard Deviation is useful or not.
Just add it to the chart and use it away - it supports all periods and moving average calculation methods through the input parameters.

Индикатор "No repaint" предназначен для анализа рыночной динамики и определения моментов возможных торговых сигналов. Основной особенностью этого индикатора является отсутствие перерисовки сигналов, что способствует более точному и надежному прогнозированию движения цен на рынке. Механизм работы: Индикатор "No repaint" использует несколько видов графических элементов для обозначения торговых сигналов: Стрелки вверх и вниз: Индикатор отмечает возможные точки входа в рынок стрелками вверх и вниз.

Hello Dear Trader, Today Im Telling You About The "Golden Scalp System V1 " Metatrader4 Golden Scalp System
Scalper with EMA This is a Scalper strategy based on ( Exponential moving average) EMA . Time frame: H1 Pair: EUR/USD, GBP/USD,AUD/USD XAU/USD
Platform Mt4 Indicators for Scalper with Ema: 300 EMA (Exponential Moving Average) ; 500 EMA (Expontial Moving Average); Stochastic (5,3,3) Long Entry
1) 300 EMA > 500 EMA .
2) Find significant levels of support.
3) Wait for

Introducing the POWER TRADE indicator created by a small group of traders with a few years trading trading the financial market profitably . This is a plug and play indicator that provides you with POWERFUL Entry signals with Profit Taking and rebound zones. The indicator Works with all MT4 trading instruments. The indicator uses previous chart data as receipt to speculate on future market moves.
The Power signals occurs on all timeframes. Though the signals occur more often on smaller tim
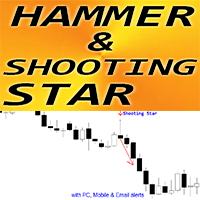
Forex Indicator " Hammer and Shooting Star pattern" for MT4 Indicator " Hammer and Shooting Star pattern " is very powerful indicator for Price Action trading : No repaint, No delays; Indicator detects bullish Hammer and bearish Shooting Star patterns on chart: Bullish Hammer - Blue arrow signal on chart (see pictures) Bearish Shooting Star - Red arrow signal on chart (see pictures) P C, Mobile & Email alerts are included Indicator " Hammer and Shooting Star pattern" is excel

Раскройте торговую информацию с помощью Auto Anchored VWAPs: Auto Anchored VWAPs служат вашим руководящим спутником в мире торговли. Эти индикаторы указывают на важные точки разворота на рынке и иллюстрируют их на вашем графике с использованием линий VWAP. Это изменит игру для трейдеров, использующих стратегии с якорными VWAP. Как это работает? Определение верхних точек: Если наивысшая цена текущей свечи ниже наивысшей цены предыдущей свечи, И предыдущий максимум выше, чем предыдущий, Мы определ

**"Support and Resistance Breakout" Indicator for MetaTrader 4 (MT4)**
Hello traders and investors on the MetaTrader 4 (MT4) platform,
We are excited to introduce to you the "Support and Resistance Breakout" indicator - a powerful tool designed for MT4 that helps you capitalize on trading opportunities involving support and resistance breakouts effectively and confidently.
**Overview:**
The "Support and Resistance Breakout" indicator is a custom tool built on the MetaTrader 4 platform,

Welcome to the "Keltner Amplified Breakout" Indicator Are you searching for a powerful and effective trading tool on the MT4 platform? Let us introduce you to the "Keltner Amplified Breakout" Indicator. Designed to help you capture potential trading opportunities, this indicator offers the perfect blend of high performance and user-friendliness. Key Advantages: Identify Strong Trends: This indicator utilizes Keltner channels and fractal signals to identify robust upward or downward trends in
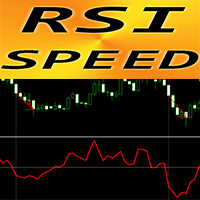
Forex Indicator "RSI SPEED" for MT4 - great predictive tool! The calculation of this indicator is based on equations from physics . RSI SPEED is the 1st derivative of RSI itself RSI SPEED is good for scalping entries into the direction of main trend Use it in combination with suitable trend indicator , for example HTF MA (as on pictures) RSI SPEED indicator shows how fast RSI itself changes its direction - it is very sensitive It is recommended to use RSI SPEED indicator fo

Это объединение нескольких осцилляторов в единую систему дивергенции, что создает впечатление более надежного индикатора дивергенции. Он основан на нескольких валютах и лучше всего работает на таймфрейме 15 минут и выше. Каждый раз, когда генерируется сигнал, он показывает предупреждение пользователю. Он более идеален в сочетании с другими индикаторами ценового действия или торговыми системами.

Hidden Gap by MMD Hidden Gap by MMD is a unique indicator that detects hidden gaps between three consecutive candles. This observation isn't my own, but in the MMD methodology, it has its application alongside other original indicators. You can apply this indicator to the chart multiple times and set the interval from which you want to see the hidden gaps. You can show or hide these gaps as needed. For example, you can view the chart at an M5 interval and see hidden gaps from an M15 chart, etc.

Привет,
Вы ищете оптимальное решение для получения прибыли на финансовом рынке на платформе MetaTrader 4 (MT4)? Представляем "Sonic R Non Repaint Smart" - интеллектуальную торговую систему, обеспечивающую точность и эффективность для трейдеров.
Знакомство с "Sonic R Non Repaint Smart":
"Sonic R Non Repaint Smart" - это надежный торговый индикатор, основанный на высоко ценной торговой стратегии Sonic R. Мы с гордостью предлагаем решение, которое помогает не только точно определять тренды р

Индикатор MOST — очень популярный индикатор, используемый на других платформах, особенно для акций и индексов. В основе лежат скользящие средние и уровни максимума-минимума. Может быть уместно использовать процентное значение 2 для акций и индексов и 1-1,5 для инструментов форекс. Вы можете сделать свою собственную настройку для каждого инструмента. Это простой в использовании, простой и понятный индикатор. Чаще встречается на часовых и дневных графиках. Пока редактировал только для платформы МТ
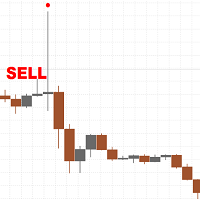
There are only a limited number of copies left, priced at 390 USD . After that, the price will be raised to 450 USD. I develop honest Indicators and know what can work in the market in the long term and what cannot. The classic and most powerful price action pattern is called the pin bar. This pattern works well after the release of fundamental news on M15, M30 and H1 timeframes, but can also be used on other timeframes such as M5 or D1. By default, the settings are set for the H1 timeframe,

Hey traders, it's easy for you to find when to buy or sell signals. Can be used for all forex pairs including gold. How to use this indicator on the M30 or H1 timeframe, for a buy signal, wait until an up arrow appears and for a sell signal, wait for a down arrow, place a stop loss 5-10 points below the arrow. Better trading time on the London and New York sessions and avoid trading when there is news. Happy Trading
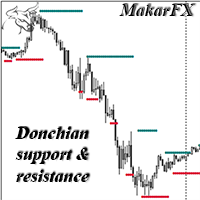
Индикатор уровней поддержи и сопротивления на основе канала Дончиана. Самый известный пример торговли по каналу Дончиана — эксперимент с группой черепашек, которые за пять лет заработали сто двадцать пять миллионов долларов. Этот индикатор можно использовать, как самостоятельный инструмент, а также как дополнительное подтверждение.
Есть MTF, не рисует NRP.
Есть настройки цвета и толщины.

This is a dashboard indicator that displays the auto-calculated risk lot, with the given risk percentage & risk points (Stop Loss) and others. The main function of this indicator is to help you calculate your exact scalping risk lots and swing risk lots. Also it displays the active trades of each pair you've executed with the following: type of trade, lot size, symbol, & equity(+/-). Also displays the bar counter set in every 5-minute bar timer. (whichever time frame you're active, the bar time

Простой и удобный индикатор, указывающий зоны стандартных индикаторов в различных таймфреймах, при необходимости можете в настройках изменить параметры RSI- Relative strength index. Стрелка вверх- если сигнальная линия ниже уровня 300, стрелка вниз- если сигнальная линия выше уровня 70 STOCH- Stochastic. Стрелка вверх- если сигнальная линия ниже уровня 20, стрелка вниз- если сигнальная линия выше уровня 80 ENVELOPE - Envelopes. Стрелка вверх- если свеча открылась ниже красной линии индика

This indicator shows when user set sessions are active and returns various tools + metrics using the closing price within active sessions as an input. Users have the option to change up to 4 session times.
The indicator will increasingly lack accuracy when the chart timeframe is higher than 1 hour.
Settings
Sessions
Enable Session: Allows to enable or disable all associated elements with a specific user set session.
Session Time: Opening and closing times of the user set session
Введение:
Turning Zone — это сложный инновационный индикатор MT4, предназначенный для предоставления трейдерам мощного инструмента для обнаружения потенциальных разворотов тренда на финансовых рынках. Используя вневременную концепцию анализа вил, индикатор Turning Zone определяет ключевые зоны разворота, где рыночные настроения могут измениться, предлагая трейдерам ценную информацию для принятия обоснованных решений. Версия MT5 : WH Turning Zone MT5
Сопутствующий продукт : WH Trend Co

This is a dashboard indicator that displays the Average Level of each selected currency pairs that filters and gives us a signal for overbought (>=90%) or if price at extreme peak above 90, and/or oversold (<=10%) or if price at extreme peak below 10.
The calculation is using Relative Strength Index default periods (2 & 9) applied to three different higher time frames H4,D1,&W1.
This won't change or altered even if you change symbol or switch to lower time frames or even in monthly and y

The Donchian Scanner Signals Indicator with is a powerful tool designed for traders operating in the financial market using the Metatrader 4 platform. This indicator combines the popular Donchian Channels strategy with advanced signalization and real-time alert features, providing a clear view of potential entry and exit points in a financial asset. Key Features: Donchian Channels Visualization: The indicator graphically displays Donchian Channels on the price chart. These channels are formed us
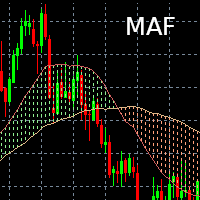
Indicateur Moving Average Filling Affiche deux moyennes mobiles (une courte et une longue) dont la durée et le type (Simple, exponentielle) est paramétrable. L'espace entre les deux moyennes mobiles est alors colorié (rempli) :
- Vert si courte > longue
- Rouge si courte < longue Il est possible de changer les couleurs selon les préférences de chacun / chacune.
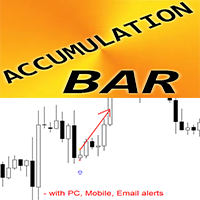
Forex Indicator Accumulation Bar Pattern for MT4 Indicator " Accumulation Bar " is very powerful breakout-focused indicator for Price Action trading Indicator detects price accumulation in narrow area during 1 bar and shows: Breakout direction, Pending order and SL locations Bullish Accumulation Bar - Blue arrow signal on chart (see pictures) Bearish Accumulation Bar - Red arrow signal on chart (see pictures) No repaint; No delays; High R/R ratio (reward/risk); I ndicator has adjustab

Индикатор Breakout Box для MT4 - Раскройте эффективные торговые возможности
Приветствуем, уважаемые трейдеры,
Мы рады представить вам индикатор Breakout Box версии 2.0 - мощный и точный торговый инструмент, созданный KPRO. Это ценный актив, который помогает вам выявлять торговые возможности на рынке Forex, оптимизируя ваши прибыли и одновременно снижая риски.
**Основные характеристики:**
1. **Эффективные торги на прорыве:** Индикатор Breakout Box специально разработан для выявления важн
Please feel free to contact me if you need any further information.
Please let me know if you have any questions.
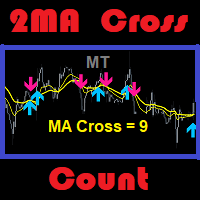
I hope the above is useful to you. MT 2ma Cross Count : is a moving average with 2 lines crossing but the strategy is to focus on the desired number of history bars and count signals that occur. Suitable for traders specialize in martingale strategy or traders specialize in technical ... etc. Traders with the ability to do fundamental analysis have an advantage. Because it will ma
Индикатор RSI Trend Lines - Определение оптимальных возможностей для покупки и продажи Введение:
Индикатор RSI Trend Lines - мощный инструмент, разработанный для помощи трейдерам в определении оптимальных возможностей для покупки и продажи на основе индикатора относительной силы (RSI). Этот передовой индикатор рисует трендовые линии на графике RSI, используя несколько точек, что предоставляет ценную информацию о потенциальных тенденциях рынка и разворотах. Используя индикатор RSI Trend Lines, т

Perfect for one minutes high trading and scalping. This indicator is very effective for trading on one minutes, in the hour. A combination of moving averages and STOCHASTICS calculation to produce a very convincing signal every hour. Blue colour signals a buy opportunity. Follow the X signs for possible buy points. The Blue average line serves as possible trend direction and support. Red colour signals a sell opportunity. Follow the X signs for possible sell points. The Red average line serves a
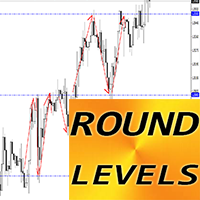
Forex Indicator "Round Levels" for MT4 Indicator "Round Levels" is must have auxiliary indicator for traders who take support/resistance into consideration Round Levels are respected by the price very much - price rebounds from round levels very often Use 1000 points Step for H4, D1 time frames U se 500 points Step for H1 and lower time frames (for intraday trading) Also Round levels are good to allocate Take Profits (in front of round level) and SL (behind the round level) These levels are ver

Добро пожаловать в мир продвинутой торговли с индикатором FxBears Super Trading. Этот инновационный инструмент, разработанный специально для платформы MT4, сочетает в себе мощь волн Эллиотта, зон спроса и предложения и внутренних индикаторов, предоставляя трейдерам высококачественные сигналы для принятия обоснованных торговых решений. Обладая более чем 90% успешным опытом, FxBears Super выводит вашу торговую стратегию на новый уровень точности и прибыльности. Of Corse: не перерисовывать и не пе

"Этот индикатор обнаруживает входы на основе теории паттерна Bystra и предоставляет значения входа для размещения лимитных ордеров с уровнями цели и стоп. Это позволяет вам рассчитать процент риска. Примечания: Этот индикатор имеет буферы, которые позволяют его использовать в советниках (EAs). Важно следить за хорошим управлением денег при работе с этим продуктом. Когда вы меняете таймфрейм, Индикатор сохранит шаблон, использованный в вашей последней сессии. Если вам нужна книга, чтобы изучить э

Market Profile Heat indicator — is a classic Market Profile implementation that can show the price density over time, outlining the most important price levels, value area, and control value of a given trading session.
This indicator can be attached to timeframes between M1 and D1 and will show the Market Profile for daily, weekly, monthly, or even intraday sessions. Lower timeframes offer higher precision. Higher timeframes are recommended for better visibility. It is also possible to use a f

Introducing the "Zone of Supply and Demand Pro" Indicator - Redefining Precision with Multi-Time Frame (MTF) Technology and Non-Repaint Capability
In the intricate world of financial markets, understanding supply and demand can be the key to success. We are excited to present the "Zone of Supply and Demand Pro" - a powerful analytical tool designed not only to help you seize trading opportunities but also to ensure unparalleled accuracy through groundbreaking technology.
**The Significance

Rapid Trend - индикатор технического анализа, который определяет направление и силу тренда, а также сигнализирует об изменении тренда. Позволяет определить текущий тренд. С помощью его алгоритма, вы можете достаточно быстро понять, какая именно тенденция в данный момент развивается на рынке. Rapid Trend может использоваться наряду с осцилляторами в качестве фильтров. Настройка трендового форекс индикатора Rapid Trend позволяет получать более точные сигналы для открытия позиций. Использует всег

Индикатор "Fibo Star" предназначен для визуализации фибоначчиевских вееров в виде звезды на вашем торговом графике. Эти фибоначчиевские веера являются мощным инструментом для анализа движения цен и могут предоставить понимание потенциальных уровней поддержки и сопротивления. Этот индикатор оснащен удобной панелью управления, которая призвана упростить процесс рисования и настройки вееров, экономя вам время и усилия. Инструкции по использованию: Этот индикатор предназначен для ручного использован

Индикатор "Currency Strength Indicator" представляет собой мощный инструмент, разработанный для того, чтобы предоставить трейдерам информацию о относительной силе различных валют на рынке форекс. Рассчитывая и отображая силу каждой валюты на основе ее соответствующего временного интервала, этот индикатор предоставляет трейдерам возможность выявлять потенциальные торговые возможности, особенно при наблюдении существенных расхождений или пересечений. Основные особенности индикатора: 1. Расчет силы

Индикатор Gann Squares представляет собой мощный инструмент для анализа рынка, основанный на математических концепциях, представленных W.D. Gann в его статье "Математическая формула для прогнозирования рынка." Этот индикатор включает в себя техники Ганна, связанные с квадратными числами, такими как 144, 90 и 52, а также Квадрат 9. Кроме того, он включает метод по использованию Квадрата 9 в сочетании с каналами и паттерном звезды. Руководство пользователя и использование: Перед использованием эт

Индикатор гармонических паттернов: Улучшение анализа гармонической торговли Индикатор гармонических паттернов - это мощный инструмент, разработанный для выявления гармонических паттернов на вашем графике торговли с использованием как ручных, так и автоматических методов обнаружения. Основные функции и возможности: Ручное и автоматическое обнаружение: Этот индикатор позволяет вам выявлять гармонические паттерны как с помощью ручных, так и с автоматическими методами. Будь вы рисуете паттерны сами

Индикатор поддержки и сопротивления Wamek (WSR) - удивительный инструмент, выделяющийся в мире технического анализа. Он выделяется тем, что умело объединяет действия цен и ведущие индикаторы для определения уровней поддержки и сопротивления с высокой степенью точности. Его уникальной особенностью является его адаптивность; пользователи могут настраивать параметры ввода индикатора, что позволяет им создавать настраиваемые уровни поддержки и сопротивления, соответствующие их торговым стратегиям.

Технический индикатор для обнаружения сильных паттернов ценового движения: Пин-бар, Внутренний бар и Внешний бар Введение: В области технического анализа паттерны ценового движения служат важными индикаторами потенциальных рыночных движений. Мы разработали утонченный технический индикатор, который упрощает идентификацию надежных паттернов ценового движения на графиках. Наш индикатор специализируется на обнаружении трех основных паттернов: Пин-бар, Внутренний бар и Внешний бар. Обнаруживаемые клю

Индикатор Опоры и Сопротивления на Основе Нумерологии для MetaTrader Введение: Откройте новое измерение в техническом анализе с нашим Индикатором Опоры и Сопротивления на Основе Нумерологии для MetaTrader. Этот уникальный инструмент использует силу нумерологии для выявления ключевых уровней поддержки и сопротивления на ваших графиках, предоставляя ценные идеи о потенциальных движениях цен. Ключевые понятия: Нумерология в Торговле: Нумерология - это мистическое изучение чисел и их значения в наш

**Представляем Order Block Pro - Ваш незаменимый инструмент торговли для MT4!**
Готовы познакомиться с улучшенным инструментом торговли, который способен оптимизировать ваш потенциал на финансовых рынках? Позвольте представить вам Order Block Pro - функциональный инструмент, который не только обладает всесторонними возможностями, но и преодолевает ограничения обычных индикаторов.
**Ключевые особенности Order Block Pro**
**1. Точное фокусирование на сигналах покупки/продажи:** При взаимоде

Binary Lines - индикатор технического анализа для валюты, товаров, криптовалют, акций, индексов и любых финансовых инструментов. Можно использовать для бинарных опционов или скальпинга на Forex. Показывает точки входа и выхода в фиксированные промежутки времени и предоставляет трейдерам необходимую информацию о результатах возможных сделок. Точки входа формируются в самом начале свечи, по направлению линии MA, длительность сделок в барах можно отрегулировать вручную и подстроить под любой финанс

**TrendLine ProX - Недалеко Карающий Индикатор для Торговли на MT4**
**Введение в продукт:** С гордостью представляем вам TrendLine ProX - оптимизированный и надежный инструмент для торговли на платформе MT4. С его точным определением тренда и функцией неперерисовки, TrendLine ProX станет вашим надежным спутником в поддержке интеллектуальных решений при торговле.
**Сила TrendLine ProX:** TrendLine ProX - это не просто торговый инструмент, это гармоничное сочетание технологий и анализа рынка

Это простая стратегия, основанная на уровнях ПРОРЫВА и ФИБОНАЧЧИ.
После прорыва,
либо рынок продолжает движение сразу к уровням 161, 261 и 423
или откатывается к уровню 50% (также называемому коррекцией) и после этого, скорее всего, продолжает движение в исходном направлении к уровням 161, 261 и 423.
Ключом системы является обнаружение бара прорыва, обозначенного зеленым (ВЕРХНИЙ ТРЕНД) или красным (НИЖНИЙ ТРЕНД) прямоугольным объектом.
В момент пробоя целевые уровни Фибоначчи рассчит

The liquidity swings indicator highlights swing areas with existent trading activity. The number of times price revisited a swing area is highlighted by a zone delimiting the swing areas. Additionally, the accumulated volume within swing areas is highlighted by labels on the chart. An option to filter out swing areas with volume/counts not reaching a user-set threshold is also included.
This indicator by its very nature is not real-time and is meant for descriptive analysis alongside other c
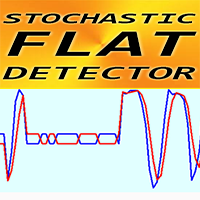
STOCHASTIC FLAT Detector - is an efficient auxiliary tool in trading! I offer you to upgrade your trading methods with this great indicator for MT4.
Indicator shows price Flat areas on the chart. It has "Flat" parameter - responsible for flat detection sensitivity. STOCHASTIC FLAT Detector can be used for Price Action entries confirmation, Divergence or OverSold/OverBought signals You can use it for trend following systems to detect flat and avoid trading there

This indicator is based on the classical indicator Stochastic and will be helpful for those who love and know how to use not a visual but digital representation of the indicator. All TimeFrames RSI MT4 indicator shows values from each timeframe. You will be able to change the main input parameters for each RSI for every TF. Example for M1: sTF1_____ = "M1"; kPeriod1 = 5; dPeriod1 = 3; Slowing1 = 3; stMethod1 = MODE_SMA; Price_Field1 = MODE_MAIN; stMode1 = 0;
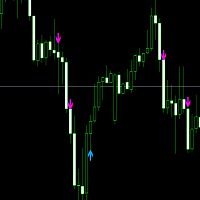
This offer is limited to a temporary period. Entry signal :follow the blue arrow for a buy trade and the Pink for a sell. Buy Trade: When the blue arrow appears, you wait until the candle completely finishes. Then you enter into a Buy Trade as soon as the next candle appears. Now wait until you hit TP1 from the Buy Goals box, then close the trade with a profit. Sell Trade: When the Pink arrow appears, you wait until the candle completely finishes Then you enter into a Buy Trade as soon as the

Drop Trend - это трендовый индикатор для торговой платформы MetaTrader 4. Данный индикатор позволяет находить наиболее вероятные точки разворота тренда. Индикатор авторский такого вы больше не где не найдете. Простая, но эффектиная система для определения форекс-тренда. По скриншотах можете сами увидеть точностью данного инструмента. Работает на всех валютных парах, акциях, сырье, криптовалютах.
Вы уже устали от постоянных взлетов и падений? Не стоит становится жертвой неустойчивых движений
This indicator converted from 5 min Buy and Sell Range Filter - guikroth version on TradingView Popularity of the Range Filter
The Range Filter is a very popular and effective indicator in its own right, with adjustments to the few simple settings it is possible to use the Range Filter for helping filter price movement, whether helping to determine trend direction or ranges, to timing breakout or even reversal entries. Its practical versatility makes it ideal for integrating it's signals into

Introducing the "Magic Trades" for MetaTrader 4 – your ultimate tool for precision trading in dynamic markets. This innovative indicator revolutionizes the way you perceive market trends by harnessing the power of advanced analysis to detect subtle changes in character, paving the way for optimal trading opportunities.
The Magic Trades Indicator is designed to empower traders with insightful entry points and well-defined risk management levels. Through its sophisticated algorithm, this indica

Индикатор определяет лучшие моменты входа на рынок.
Он написан на основе хорошо известных индикаторов как Аллигатора и ССИ. Для тонкой настройки в нем присутствуют все параметры родителей. Индикатор работает на всех таймфреймах.
Основная настройка индикатора выполняется изменением значений двух параметров "Precision" и "CCI Period". Все остальные параметры можно оставить без изменений.

Технический индикатор рассчитывающий свои показания на объемах торгов. В виде гистограммы показывает накопление силы движения торгового инструмента. Имеет независимые системы расчета для бычьего и медвежьего направления. Работает на любых торговых инструментах и тайм-фреймах. Может дополнить любую торговую систему.
Индикатор не перерисовывает своих значений, сигналы появляются на текущей свече.
Прост в использовании и не загружает график, не требует производить дополнительные расчеты параметр

The " Global Trend Pro Lines " indicator is one of the most important indicators designed to display trading volumes based on the sniper strategy. This indicator provides convenience for daily, medium-term, and long-term traders. The main advantages of the indicator are as follows: Suitable for the sniper strategy: The "Global Trend Pro Lines" indicator is suitable for the sniper strategy and allows traders to identify the best entry and exit points for trading. Displays volumes: The indicator
DYJ Peak Valley Indicator является передовой торговой системой по квадратному взвешенному среднему линию. Он содержит будущие линии тренда и углы тренда, а также отображение угла каждой волнной долины.
В конце пика SQWMA наблюдается тенденция к снижению,
На дне SQWMA наблюдается восходящий тренд. Сигналы индикатора могут имитировать статистику открытия торговых позиций, что позволяет получить более подробное представление о вероятности сигнала.
Please download the XAUUSD parameter templat
MetaTrader Маркет - лучшее место для продажи торговых роботов и технических индикаторов.
Вам необходимо только написать востребованную программу для платформы MetaTrader, красиво оформить и добавить хорошее описание. Мы поможем вам опубликовать продукт в сервисе Маркет, где его могут купить миллионы пользователей MetaTrader. Так что занимайтесь только непосредственно своим делом - пишите программы для автотрейдинга.
Вы упускаете торговые возможности:
- Бесплатные приложения для трейдинга
- 8 000+ сигналов для копирования
- Экономические новости для анализа финансовых рынков
Регистрация
Вход
Если у вас нет учетной записи, зарегистрируйтесь
Для авторизации и пользования сайтом MQL5.com необходимо разрешить использование файлов Сookie.
Пожалуйста, включите в вашем браузере данную настройку, иначе вы не сможете авторизоваться.