适用于MetaTrader 4的技术指标 - 125

"Sentiments of traders" in the financial markets is a topic that has been of interest to us for a long time. In time, we could not find the right formula to define these sentiments. We went through many stages in the search for the right methodology - from taking data from external sources to calculate open positions of buyers and sellers to calculating tick volumes, but still we were not satisfied with the results. The calculation of open positions of buyers and sellers from external sources ha
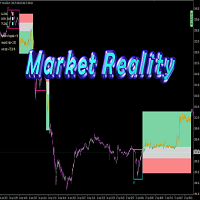
Hello, As you know more than 90% of people in the financial markets are losers, the most important reason is the lack of a proper fixed system and risk management. I want to introduce you to an indicator that is the result of my 8 years of experience, which shows you the reality of the market. My human dignity does not allow me to guarantee the future, but the table below shows the past statistics of this indicator and its performance which really the market past is the only way to find out the

基於箭頭價格反轉點的外匯剝頭皮指標是金融市場交易的高級工具之一。 它為交易者提供了快速響應市場變化和準確預測未來價格走勢的能力。 該指標基於現代算法和技術的使用,可讓您快速計算圖表上的價格反轉點。 每個點都由指示價格變動方向的箭頭指示。 由於這個指標,交易者可以快速確定何時進入和退出交易。 外匯剝頭皮指標允許交易者使用短期交易策略獲得有用的信息。 可用於外匯、股票、商品等任何金融市場的交易。 此外,該指標可以針對任何時間範圍和工具進行配置。 外匯剝頭皮指標的特點之一是它的準確性。 它使用一組有助於提高信號准確性的參數。 在分析市場變化時,它還會考慮重要的支撐位和阻力位。 因此,該指標提供了準確的信號,有助於交易者剝頭皮市場。 外匯剝頭皮指標的一個重要優勢是它的易用性。 開始在交易中使用它不需要特殊技能或知識。 此外,它可以輕鬆定制以滿足交易者的個性化需求。
該指標的好處: 沒有重新繪製 在圖表上顯示價格反轉點 可用於剝頭皮 適合新手交易者
指標設置: period - 市場分析期 size_arrow - 信號箭頭的大小 購買 - 購買箭頭的顏色 sell - 賣出箭頭的顏色
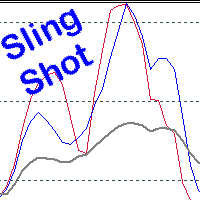
Scalping, Mean reversion or Position trading strategy
Get into an established trend on a pullback in the market. Use the Pinch in the indicator for profit taking. Use the Pinch as a mean reversion strategy, scalping back to a moving average line.
Input Parameters Fast Sling Shot configuration. Slow Sling Shot configuration. Dual Sling Shot configuration. Price line configuration. Trigger zones or levels. Example of Sling Shot trade idea: Price line sets the mood, below the baseline leve
介绍一下BreakOut Consult,这是一款革命性的工具,将帮助您将交易提升到一个新的水平!我们的尖端算法结合了多种趋势和振荡器,生成准确的买入和卖出信号,是任何交易者的强大工具。 有了BreakOut Consult,您可以轻松地通过我们的动态通道识别市场中的突破,该通道使用支撑和阻力水平来检测突破。我们的算法检测到两种类型的突破,确保您永远不会错过任何一个黄金机会。 从上方的阻力位突破和从下方的支撑位突破。 从下方的阻力位突破和从上方的支撑位突破。 当发生买入突破时,会出现一个向上的箭头,当发生卖出突破时,会出现一个向下的箭头 - 就是这么简单! 我们的算法被设计为适用于所有市场,包括外汇、商品、股票和加密货币。无论您是短线交易者、波段交易者还是持仓交易者,BreakOut Consult都可以帮助您在任何时间框架上检测突破。 我们了解到虚假突破可能是一个真正的问题,这就是为什么我们的算法使用复杂的过滤器来减少虚假突破,使BreakOut Consult更加可靠和有效。 优缺点: 一旦信号箭头在蜡烛收盘后显示在图表上,它就永远不会消失,因此您可以对自己的交易决策有信心。 尽

Introducing Trend Fusion 444F, a powerful MQL4 indicator designed to determine market direction using multiple trading indicators. This comprehensive tool offers a unique fusion of technical analysis techniques that help traders make informed decisions in various market conditions. Key Features: Comprehensive Analysis: Trend Fusion 444F combines several widely-used trading indicators to provide a multi-dimensional view of the market. The indicators include Moving Averages, MACD, RSI, DeMarker,

The Go Master trend indicator finds the current trend based on many factors. A simple and convenient indicator. The user can easily see the trends. It uses the basic trading approach widely described in the trading literature.
This is the first indicator designed to detect fluctuations in the direction of the trend and possible reversals. It works using a special algorithm and a set of internal indicators. You can use this indicator alone or in combination with other indicators according to yo

Intelligent ZigZag indicator.
It has only two settings. The higher the values, the more significant extreme values it shows.
Application area.
To determine the trend. Line drawing direction.
To recognize multiple patterns.
If you put two indicators on one chart with fast and slow values. By changing the color of one of them, you can very well decompose the price movement into waves.
The indicator can be a great helper for marking the chart and identifying the key levels from which the pri

The "AI Forecast" indicator is the result of a unique experiment in which I asked an AI how to create the best indicator to anticipate the market. The AI suggested measuring the past history of the price and its reactions to different levels, and then calculating the probabilities of the price reaction in the future.
With this idea, I designed with the help of another AI the "AI Forecast" indicator, which adapts to any MetaTrader chart and shows you three lines: one for entry and two for possi

All traders wait until the market calms down and only after that will they enter the market. They look at the monitor all the time. Now you no longer need to follow this, your best assistant will do it for you. You go about your usual business and calmly wait for the signal. And as soon as the spread reaches the value you set, you will receive an instant notification on your phone.
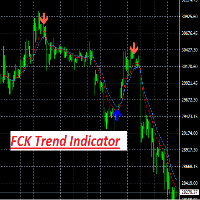
FCK Trend Indicator is an indicator for determining the current direction of price movement and reversal points. The indicator will be useful for those who want to see the current market situation better. The indicator can be used as an add-on for ready-made trading systems, or as an independent tool, or to develop your own trading systems. FCK Trend Indicator indicator, to determine the reversal points, analyzes a lot of conditions since the combined analysis gives a more accurate picture of t
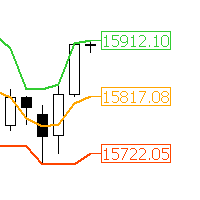
"AV Donchian Channel" is an indicator for MetaTrader 4, which shows the current prices of the donchian channels and the middle line.
Multiple AV Donchian Channel indicators can be placed on one chart. The center line can be used for trailing.
See also Richard Dennis Turtle Trader strategy.
Settings:
- Donchian Channel Period
- Colors and widths of the lines
- Colors and widths of price labels
Please report bugs to me.

Considering the main theories of Forex (Dow Theory, support lines, chart patterns, and Fibonacci retracements), It tells you the price range where whales (large investors) are likely to appear. You can trade at the price points that professionals also aim for. You no longer have to warry about where to aim next.
We are live-streaming the actual operation of the system. Please check for yourself if it is usable. Please check it out for yourself. https://www.youtube.com/@ganesha_forex
We do not
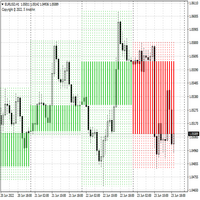
Aligning higher time frames for trading One of the main concepts behind the beginner strategy is multiple time frame analysis – using a higher time frame to determine the overall market direction and executing trades on a lower time frame. By determining the overall direction on a higher time frame and trading in that direction, you make sure that you trade in the direction of the overall trend – this increases your chances of profitable trades. In the beginner strategy, you use the 30 minute ch
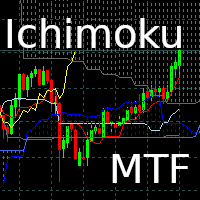
Ichimoku Hinko Hyo MTF
Ichimoku Hinko Hyo MTF is a Multi Time Frame indicator. It allows to overlap several ichimoku indicators (from different timeframes) on the same chart.
Doing this allows a better read of the market as informations are directly available to user.
It is possible to select different curves to be displayed (Tenkan, Kijoun, Chikou, Kumo)
In this version 1.0, it is possible to
On M1 chart, overlap M5 and M15 indicators.
On M5 chart, overlap M15 and H1 indicators.
On M15 chart,

我們在我們的頻道免費教授使用該指標進行交易: https://www.mql5.com/en/channels/scalpm1period
剝頭皮箭頭指標 M1 是用於在 M1 時間幀上剝頭皮的箭頭信號指標。 它為交易者在圖表上繪製價格反轉點並且不會重新繪製它們。 該指標向交易者顯示開倉的最佳時間和方向。 指標確定價格反轉點後,它會在圖表上繪製紅色或藍色箭頭。 這些箭頭表示價格可能的未來方向。 如果指標在圖表上畫了一個藍色箭頭,那麼價格現在會上漲,而當指標在價格下方畫出一個紅色箭頭時,價格就會下跌。 如果交易者知道未來價格可能走向何方,他將能夠朝這個方向開倉。 您還可以在距離箭頭幾個點的位置開啟掛單交易,然後進行突破交易。 該指標有很多交易選項。 該外匯指標顯示了 M1 時間範圍內的最佳結果。 這是剝頭皮交易的最佳時間框架。 您可以在白天進行大量空頭交易。
該指標的好處: 為在 M1 時間幀上剝頭皮而創建 顯示所有貨幣對的信號 不重畫它的箭頭 不需要額外的配置。 一切都已經為交易做好了準備。 圖表上箭頭形式的非常簡單易懂的信號
對倒賣箭頭指標 M1 的建議: 在終端上安裝

^With Mixin Combiner.
^You Can Combine 10 Indicators Together To Make One Arrow In The End
^You Can Filter Time You Want To Trade.
^You Can Control Which Candle Arrow Apear On It " Bullish Or Bearsh".
^There Is An Statistics To Can Filter "What success rate of the indicators you Combined? ".
^You Also Can Control The Appearance Of The Arrows At Any Time Of The Candle , "Is It In The Beginning Or At Any Time In Particular? ".

As traders, we know that identifying price contractions and consolidations is crucial for profitable trading. Fortunately, we have a powerful tool at our disposal. The indicator to trade price consolidation is designed to identify price contraction and alerts us on formation. It does this by analyzing historical price data and identifying price action patterns. The algorithm then uses this information to mark the zone , potential targets and liquidity lines, giving us valuable insights into mark
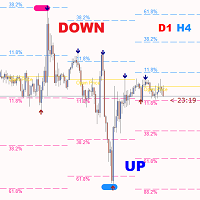
Gold ATR MTF - 這是一項優秀的股票技術指標。 ATR(平均真實波動幅度)指標的演算法透過繪製指定時間範圍(D1)開盤價的指定百分比(%)的相應水平來分析資產價格的變動並反映波動性。符號價格變動方向和箭頭訊號的指標(紅色和/或藍色 D1 H4)是舒適且有利可圖的日內交易和/或剝頭皮交易的額外且必要的輔助手段。每日利潤可以從外匯符號的 20 點開始,或從黃金符號的 50 點開始。
指標特點: - 這是一個具有魔力、趨勢方向檢測器和兩個趨勢箭頭塊的超級指標,可實現舒適且有利可圖的交易。圖表上顯示用於切換方塊的紅色按鈕。 Magic 是在指標設定中設定的,這樣您就可以在顯示不同區塊的兩個圖表上安裝指標。 - 黃金 ATR MTF 可以放置在具有不同箭頭緩衝區(DM 和 SF)的兩個圖表上。為此,在設定中,您需要選擇不同的魔法,例如,一個魔法=999,另一個魔法=666。然後您就可以在圖表上選擇帶有紅色按鈕的箭頭緩衝區。 - 在黃金 ATR MTF 中,只有當價格劇烈波動時,水平線 (ATR) 才會略微擴大,僅當價格劇烈波動時,趨勢方向指標 (紅色和/或藍色 D1 H4) 才會重

OFFER! OFFER ! After 3 weeks the unlimited price will be 500$ and in the future you will regret why you didn't make a purchase at this lowest price. Dear Traders, the atomic power Entries Indicator is one of the indicators that if used wisely and correctly can help you to find an edge over the market. The indicator will work for all forex pairs, all markets and all timeframes. Still it is your duty to find the most effective timeframe for you. When the sell or buy arrow appears you will get a

隆重推出 Auto Trendline,这是一种创新的 MT4 指标,可自动
在您的图表上绘制趋势线。告别繁琐且耗时的手动绘制趋势线任务,
让 Auto Trendline 为您完成这项工作!
*购买后联系我向您发送 说明和分步指南。
凭借其先进的算法,Auto Trendline 会自动检测并为您绘制趋势线,
从而节省您的时间和精力。只需将指标附加到您的图表,并观察它根据价格行为的高点和低点识别和绘制趋势线。 Auto Trendline 是高度可定制的,允许您调整指标的灵敏度以适合您的交易风格和偏好。
您还可以选择不同的线条样式和颜色,甚至可以设置警报以在趋势线被打破时通知您。 无论您是初学者还是经验丰富的交易者,自动趋势线都是识别和分析任何市场趋势的重要工具。
凭借其友好的用户界面和高级功能,该指标一定会提升您的交易体验并帮助您做出更明智的交易决策。 主要特征:
自动绘制趋势线 高度可定制的灵敏度设置 多种线条样式和颜色 破损趋势线的警报通知 用户友好的界面 立即试用自动趋势线,发现自动趋势线分析的好处! 相关产品 : Auto TrendLine MT5

Instantly spot simple candlestick patterns with MSHT Price Pattern
MSHT PRICE PATTERN can automatically detect more than 200 different candlestick patterns, including multi-candle patterns. This makes it easy for you to see if what you care about is present on a chart or not at a glance, and reduces the amount of time you have to stare at charts to check off items on your investment checklist. Candlestick Pattern Recognition is supported on charts, alerts, in scanners and smart checklists.
All
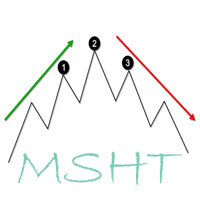
MSHT Head&Shoulders indicator for MT4 automatically scans the chart for head and shoulders candlestick patterns. Obviously, the scanner shows the Symbol, Timeframe, Direction, Pattern Name, Age, and Chart time frame in which the head and shoulders pattern is identified. Furthermore, the scanner displays the inverted head and shoulders pattern also. So, forex traders can BUY or SELL based on the head and shoulders candlestick pattern. Additionally, the indicator also scans and plots emerging head

Special Entry Arrow indicator is designed for signal trading. This indicator generates trend signals.
It uses many algorithms and indicators to generate this signal. It tries to generate a signal from the points with the highest trend potential.
This indicator is a complete trading product. This indicator does not need any additional indicators.
The indicator certainly does not repaint. The point at which the signal is given does not change.
Features and Suggestions Time Frame: H1 Wo

The best instrument for scalping. It allows you to always be correctly positioned in the price. It's a simple and extraordinarily powerful visual reference. Very suitable for price action. It consists of four components. 1. Fork. There are two levels that surround the price and mark the rebound points. They can be varied independently with 4 associated controls, two for each level. Its amplitude is indicated in pips in the indicator data. The minimum fork is updated with each tick. It has
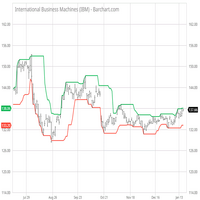
Super Pair Strong Indicator is a highly popular momentum and trend indicator that utilizes multiple currencies to determine trends. It is a one-chart indicator that combines the algorithms of the MACD and Currency Strength Meter. With its one-click feature, users can view 28 major and minor pairs on their dashboard, and by clicking on a specific pair, the chart will automatically change to the user's preferred chart. In addition to its user-friendly interface, Super Pair Strong Indicator offers
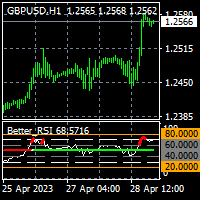
To get access to MT5 version please click here . This is the exact conversion from TradingView: " Better RSI with bullish / bearish market cycle indicator" by TradeCalmly.
The screenshot shows similar results from tradingview and Metatrader when tested on ICMarkets on both platforms. This is a light-load processing and non-repaint indicator. All input options are available. Buffers are available for processing in EAs. You can message in private chat for further changes you need.

Credible Cross System indicator is designed for signal trading. This indicator generates trend signals.
It uses many algorithms and indicators to generate this signal. It tries to generate a signal from the points with the highest trend potential. The indicator works based on instant price movements. This indicator is a complete trading product. This indicator does not need any additional indicators.
The indicator certainly does not repaint. The point at which the signal is given does not c
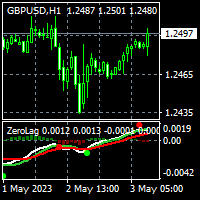
To get access to MT5 version please click here . This is the exact conversion from TradingView: "Zero Lag MACD Enhanced - Version 1.2" by " Albert.Callisto ". This is a light-load processing and non-repaint indicator. All input options are available. Buffers are available for processing in EAs. You can message in private chat for further changes you need. Thanks
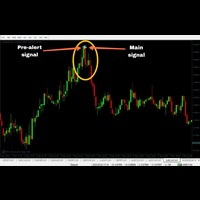
This Indicator has a accuracy in between 70-90% but it will work one time in a day. The timing is (MT4 time 18:00 to 18:05) Tickmill, Alpari, Amarket MT4 recommended. Although it will work on most of the MT4.
MT2 Auto trading supported: Buy buffer = 0 // Sell buffer = 1
Intrabar
Candle TF = M1
Trade Expiry = 1 minute or 5 minutes
No martingale required, but if you wish then you can take 1 step martingale.
Features: Neural Network based Advance price action algorithms Advance consolidation fi
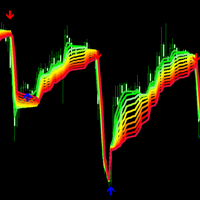
"Gradient adaptive rsi mt4" - 自适应外汇指标 RSI,在价格图表上显示为梯度。 该指标帮助交易者确定当前趋势的方向、趋势的强度、趋势反转点。 “梯度自适应 rsi mt4”- 为 Metatrader4 平台创建,可以在所有货币对和时间范围内工作。 在设置的帮助下,这个“梯度自适应 rsi mt4”指标可以适应不同的交易策略。 “梯度自适应 rsi mt4”指标使用内存交换缓冲区进行工作,因此可以轻松集成到任何机器人中并实现自动化。
"Gradient adaptive rsi mt4" 指标的优势: 很好的直观的展示了趋势的方向 显示价格反转点 显示趋势的强度
"Gradient adaptive rsi mt4" 指标的设置: Step_period - 指标计算周期。 Smooth - 平滑值的方法。 Relativity——价值适应系数。 bars - 图表上应显示指标的柱数。 size_arrow - 出现在信号线交叉点的箭头的大小。

Nice Stable Arrow indicator is designed for signal trading. This indicator generates trend signals.
It uses many algorithms and indicators to generate this signal. It tries to generate a signal from the points with the highest trend potential.
This indicator is a complete trading product. This indicator does not need any additional indicators.
The indicator certainly does not repaint. The point at which the signal is given does not change. Signals are sent at the beginning of new candles.
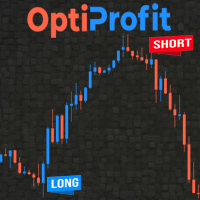
This indicator is a unique, high quality and affordable trading tool. The calculation is made according to the author's formula for the beginning of a possible trend.
An accurate MT4 indicator that gives signals to enter trades without redrawing! Download EA for this indicator https://www.mql5.com/ru/market/product/98089 Ideal trade entry points for currencies, cryptocurrencies, metals, stocks, indices! The indicator builds buy/sell arrows and generates an alert. Graphically displays the entr

Introducing our groundbreaking Forex indicator, specifically designed to help traders master the art of identifying critical support and resistance zones, as well as double top and double bottom patterns with unprecedented accuracy. Say goodbye to guesswork and hello to a powerful tool that will revolutionize your trading experience. Our proprietary indicator leverages cutting-edge technology to recognize key price levels where buying and selling pressures are poised to shift the market dynamic
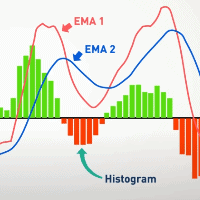
"Macdio trigger forex indicator for mt4" is a technical indicator that is used in trading on the foreign exchange market to determine when to enter and exit a position. This indicator is based on the signals received from the MACD indicator, which is one of the most popular indicators in technical analysis. The "Macdio trigger forex indicator for mt4" indicator can also be used to identify support and resistance levels, as well as identify overbought and oversold markets. If the indicator is in
带有箭头的“Mt4 中性市场指标”指标显示价格反转点。 线条显示趋势或修正的方向。 如果您仔细观察图表,您可以很容易地注意到箭头的准确性相当高。 该指标在所有时间范围和货币对上都能很好地显示信号。 当此指标与 ChatGPT 一起创建时。 在编写该指标的整个过程中,我们转向聊天来创建代码和工作算法。 联合工作取得了良好的效果。 现在每个交易者都可以独立评估这个剥头皮指标的结果。
“Mt4 中性市场指标”的优势: 适合剥头皮 用箭头显示价格反转点 显示当前价格移动的线条 “Mt4 中性市场指标”非常容易设置
如何使用“Mt4 中性市场指标”分析市场: 使用“Mt4 中性市场指标”的说明非常简单。 当蓝色箭头出现时,打开一个买单。 当红色箭头出现时,打开卖单。 TakeProfit 和 StopLoss 的大小取决于时间框架和货币对。 对于 EURUSD,我们建议止盈 15 到 30 点。 止损是 2 倍以上。
“MT4中性行情指标”设置: Period_atr - ATR 指标周期。 Period_BB - Bands 指标的周期。 Period_sar - SAR 指标周期。

Based on data from the Bank for International Settlements, 78.8% of the world's major 8 currency pairs can be checked instantly. It tells you whether the U.S. dollar is being bought or sold in a matter of seconds. So, even in the fast-moving phase after the release of economic indicators, you can see the flow and pushes of the U.S. dollar,
We are live-streaming the actual operation of the system. Please check for yourself if it is usable. Please check it out for yourself. https://www.youtube.c

Dao 隐藏代码 FX 这个提议是独一无二的。 我 们没有在亚马逊河三角洲寻找圣杯,也没有挖出埃及的坟墓。 我 们组装了一个仓库,并向程序员订购指标。 在一个很少有人注意的概念下。 除了特斯拉之外,所有人都是如此。 还有古代的道家。 1. 逻辑上的概念是这样的: · 股票 图表只有两个维度 -- 上 涨或下跌。买入或卖出。两个运动的向量。 · 该图表给出了第三个维度 -- 时间。它从左到右移动。买入和卖出向量因此成为 TrendLine 和 VSTrendLine 。 · TrendLine 和 VSTrendLine 形成定价模型 ( PATTERN ), 是主要的 , 而水平价格水平是次要的。 · 图表上不同时间段的分形期的价格模型 ( PATTERNS ) 模 拟了未来的价格走势。他们帮助交易者提前看到交易 , 可视化价格路径 , 并看到未来 2-3 根蜡 烛的摆动。 · 它 们考虑到了导致价格压缩和拉伸的力量和能量。 · 控制的 时间框架是 H4 , D1 和 W
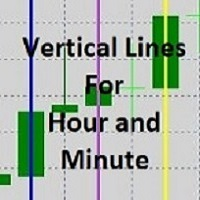
MT4 Indicator that puts up to 4 vertical lines for each selected hour and minute. Vertical line color and thickness are adjustable Input parameters: lineEnabled1 = true lineEnabled2 = true lineEnabled3 = true lineEnabled4 = true lineColor1 = Red lineColor2 = Blue lineColor3 = Green lineColor4 = Yellow lineTime1 = "12:00" lineTime2 = "14:00" lineTime3 = "16:00" lineTime4 = "18:00" lineWidth1 = 1 lineWidth2 = 1 lineWidth3 = 1 lineWidth4 = 1
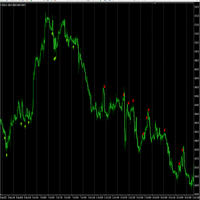
The MT4 trend arrow indicator is a powerful tool for technical analysis that will help traders determine the direction of the trend in financial markets. This indicator is based on the use of several mathematical algorithms and methods of price analysis, which allows you to give accurate and transparent signals to enter the market.
The working timeframe is H1.
The description of the indicator includes up and down arrows that indicate the future direction of price movement. In addition, the i

Using the Trend alternate indicator algorithm, you can quickly understand what kind of trend is currently developing on the market. The Trend Alternate Indicator accompanies lengths, can be used without instruments or timframes. With this indicator, you can try to predict future values. But the main application of the indicator is to generate signals for the purchase and sale. The indicator monitors the market trend with ignoring the sharp fluctuations in the market and the noise around the aver

Max Min Reversal Arrows - an arrow reversal indicator for predicting price movement. The indicator is built on the support and resistance levels at the local lows and highs of the price. Product features
Arrows appear on the current candle. The indicator does not redraw.
Can be used on all time frames and trading instruments. Recommended timeframes to use M30, H1, H4.
The dotted lines are the support and resistance levels within the signal. Price movement from these levels means a reversal.
Pr

hello friend, there is an active adx based indicator for binary options, it only operates on 1 currency (eurusd) on TF M1, it operates the signal on the next candle. indicator test results within 2 months are very satisfactory, accuracy exceeds 85%. very optimal run in markets that issue news (medium impact and high impact). so of course it is very optimal, only a 1 month and lifetime trial is available.For orders, please go to the telegram developer: https://t.me/AgresivetradingSupport (@agresi

Market Viewer gives a quick glance on correlation and direction. This indicator takes a list of symbols (max 8) Leave a symbol setting empty if you wish not to use that many - like in the defaults… It will check for each timeframe (Monthly, Weekly, Daily, H4, H1, 30min, 15min, 5min and 1min) if the current candle on that timeframe is bullish or bearish. This will give a good indication of the direction for us to trade in. We need to be in sync with the bigger timeframes.

Description: For a comprehensive understanding of our indicators, we invite you to explore the entire Q&A section within this MQL5 blog post here . The "Divergence Strategy Indicator" is an advanced technical analysis tool designed to identify potential trend reversals and trend continuation opportunities in the market. It leverages the concept of divergence, a powerful phenomenon that occurs when price action diverges from an oscillator, indicating underlying shifts in market sentiment. Spo
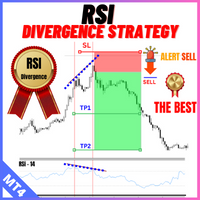
Description: For a comprehensive understanding of our indicators, we invite you to explore the entire Q&A section within this MQL5 blog post here . The "Divergence Strategy Indicator" is an advanced technical analysis tool designed to identify potential trend reversals and trend continuation opportunities in the market. It leverages the concept of divergence, a powerful phenomenon that occurs when price action diverges from an oscillator, indicating underlying shifts in market sentiment. Spot

Description: For a comprehensive understanding of our indicators, we invite you to explore the entire Q&A section within this MQL5 blog post here . The "Divergence Strategy Indicator" is an advanced technical analysis tool designed to identify potential trend reversals and trend continuation opportunities in the market. It leverages the concept of divergence, a powerful phenomenon that occurs when price action diverges from an oscillator, indicating underlying shifts in market sentiment. Spo

Description: For a comprehensive understanding of our indicators, we invite you to explore the entire Q&A section within this MQL5 blog post here . The "Divergence Strategy Indicator" is an advanced technical analysis tool designed to identify potential trend reversals and trend continuation opportunities in the market. It leverages the concept of divergence, a powerful phenomenon that occurs when price action diverges from an oscillator, indicating underlying shifts in market sentiment. Spot
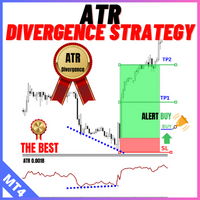
Description: For a comprehensive understanding of our indicators, we invite you to explore the entire Q&A section within this MQL5 blog post here . The "Divergence Strategy Indicator" is an advanced technical analysis tool designed to identify potential trend reversals and trend continuation opportunities in the market. It leverages the concept of divergence, a powerful phenomenon that occurs when price action diverges from an oscillator, indicating underlying shifts in market sentiment. Spo

Description: For a comprehensive understanding of our indicators, we invite you to explore the entire Q&A section within this MQL5 blog post here . The "Divergence Strategy Indicator" is an advanced technical analysis tool designed to identify potential trend reversals and trend continuation opportunities in the market. It leverages the concept of divergence, a powerful phenomenon that occurs when price action diverges from an oscillator, indicating underlying shifts in market sentiment. Spo
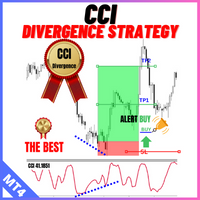
Description: For a comprehensive understanding of our indicators, we invite you to explore the entire Q&A section within this MQL5 blog post here . The "Divergence Strategy Indicator" is an advanced technical analysis tool designed to identify potential trend reversals and trend continuation opportunities in the market. It leverages the concept of divergence, a powerful phenomenon that occurs when price action diverges from an oscillator, indicating underlying shifts in market sentiment. Spo

Description: For a comprehensive understanding of our indicators, we invite you to explore the entire Q&A section within this MQL5 blog post here . The "Divergence Strategy Indicator" is an advanced technical analysis tool designed to identify potential trend reversals and trend continuation opportunities in the market. It leverages the concept of divergence, a powerful phenomenon that occurs when price action diverges from an oscillator, indicating underlying shifts in market sentiment. Spot
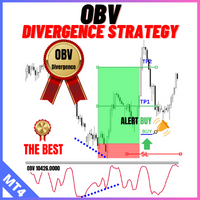
Description: For a comprehensive understanding of our indicators, we invite you to explore the entire Q&A section within this MQL5 blog post here . The "Divergence Strategy Indicator" is an advanced technical analysis tool designed to identify potential trend reversals and trend continuation opportunities in the market. It leverages the concept of divergence, a powerful phenomenon that occurs when price action diverges from an oscillator, indicating underlying shifts in market sentiment. Spot

Description: For a comprehensive understanding of our indicators, we invite you to explore the entire Q&A section within this MQL5 blog post here . The "Divergence Strategy Indicator" is an advanced technical analysis tool designed to identify potential trend reversals and trend continuation opportunities in the market. It leverages the concept of divergence, a powerful phenomenon that occurs when price action diverges from an oscillator, indicating underlying shifts in market sentiment. Spot
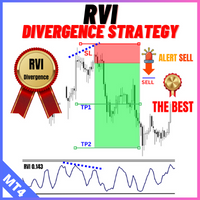
Description: For a comprehensive understanding of our indicators, we invite you to explore the entire Q&A section within this MQL5 blog post here . The "Divergence Strategy Indicator" is an advanced technical analysis tool designed to identify potential trend reversals and trend continuation opportunities in the market. It leverages the concept of divergence, a powerful phenomenon that occurs when price action diverges from an oscillator, indicating underlying shifts in market sentiment. Spo
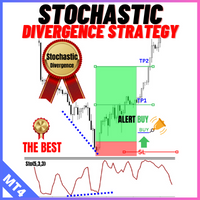
Description: For a comprehensive understanding of our indicators, we invite you to explore the entire Q&A section within this MQL5 blog post here . The "Divergence Strategy Indicator" is an advanced technical analysis tool designed to identify potential trend reversals and trend continuation opportunities in the market. It leverages the concept of divergence, a powerful phenomenon that occurs when price action diverges from an oscillator, indicating underlying shifts in market sentiment. Spo
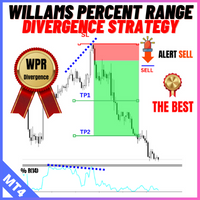
Description: For a comprehensive understanding of our indicators, we invite you to explore the entire Q&A section within this MQL5 blog post here . The "Divergence Strategy Indicator" is an advanced technical analysis tool designed to identify potential trend reversals and trend continuation opportunities in the market. It leverages the concept of divergence, a powerful phenomenon that occurs when price action diverges from an oscillator, indicating underlying shifts in market sentiment. Spo
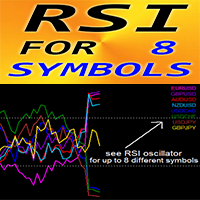
适用于 MT4 的外汇指标“8 个符号的 RSI”。无需重绘。
- RSI 是交易中最受欢迎的震荡指标之一。 - 从强超买区域(高于 70)进入卖出,从强超卖区域(低于 30)进入买入,效果非常好。 - RSI 对于背离检测非常有用。 - “8 个符号的 RSI” 让您有机会在 1 张图表上控制多达 8 个不同符号的 RSI 值。 - 此指标非常适合与超卖/买入区域的价格行动条目相结合。 ................................................................................................................... // 出色的交易机器人和指标可在此处获得: https://www.mql5.com/en/users/def1380/seller 这是仅在此 MQL5 网站上提供的原创产品。
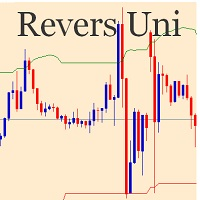
Индикатор разворота цены основанный на анализе трех таймфреймов. Когда вы выбираете параметр PERIOD, индикатор проводит рассчет по выбранному периоду и на два периода выше. Период М30 в рассчетах никак не участвует и его выбирать не рекомендуется. Максимальный верхний период для правильного рассчета применяйте не выше D1, т.к. в него уже войдут периоды W1 и MN. Период для установки индикатора выбирайте произвольно, а для более точного входа, я рекомендую М1,М5 и М15.

Description: The "ABC Pattern Strategy With Fibonacci" Indicator is a sophisticated technical analysis tool meticulously designed to recognize and leverage the power of the ABC chart patterns in combination with Fibonacci levels. This cutting-edge strategy empowers traders to make well-informed decisions in the dynamic forex market. By making spotting ABC patterns on price charts an easy task, the indicator offers insights into potential trend reversals or continuations. It seamlessly incorpor
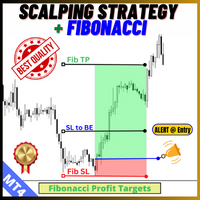
Description: For a comprehensive understanding of our indicators, we invite you to explore the entire Q&A section within this MQL5 blog post here . The "Scalping Strategy" Indicator is a cutting-edge technical analysis tool designed specifically for short-term traders who prefer to seize quick opportunities in fast-moving markets. As a scalping tool, it focuses on identifying rapid price fluctuations and generating concise yet actionable signals. Scalping Signals: Benefit from timely signals

Real Trade Entry indicator is designed for signal trading. This indicator generates trend signals.
It uses many algorithms and indicators to generate this signal. It tries to generate a signal from the points with the highest trend potential.
This indicator is a complete trading product. This indicator does not need any additional indicators.
The indicator certainly does not repaint. The point at which the signal is given does not change. Signals are sent at the beginning of new candles.

An extremely convenient indicator that truly makes the process of making money on the exchange easy. It is based on the scientifically rigorous theory of the market developed by the author, the beginning of which is presented here . The full algorithm of this indicator operation is presented in the article . The indicator calculates the most probable price movement trajectory and displays it on the chart. Based on the predicted price movement trajectory

PSI - индикатор скорости цены. Он основан на измерении длинны каждого поступающего тика в терминал. Таким образом мы можем понять насколько сильно (с какой скоростью) цена движется вверх или вниз, и видеть остановку движения цены.
При увеличенной тиковой скорости цены вверх (тики вверх имеют большую длину чем тики вниз) - индикатор показывает зеленую гистограмму, при увеличенной скорости цены вниз (тики вниз имеют большую длину чем тики вверх) - индикатор показывает красную гистограмму. Индикат

The Trend Engine indicator is good for any trader, suitable for any trader for both forex and binary options. Trend indicator, a revolutionary trend trading and filtering solution with all the important features of a trend tool built into one tool! You don’t need to configure anything, everything is perfected by time and experience, it works great during a flat and in a trend.
Absolute High Low indicator is a discretionary tool for assessing extremes in the price. It is very self-explanatory, and you can test against other default oscillators to see the difference. Combine with your trend following systems to master entry and exit at extremes. Back test and study the indicator to see the results up against a system or indicator. The indicator calculates a number of max bars so a gap will appear at the end, and it will restart. MT5 Version: https://www.mql5.com/en

Manuscript is a time-tested indicator, many tests have been conducted in its use, I will tell all buyers my recommendations on using forex, cryptocurrency or binary options
This indicator gives a signal exactly at the close of the candle of the selected period
The arrow does not disappear after the signal, you can set up email notifications
I recommend using it on the period H1,H4,daily If you are aware of its work, you will be able to trade in a plus
In the future I will give you my recomm

This all-in-one indicator displays real-time market structure (internal & swing BOS / CHoCH), order blocks, premium & discount zones, equal highs & lows, and much more...allowing traders to automatically mark up their charts with widely used price action methodologies. Following the release of our Fair Value Gap script, we received numerous requests from our community to release more features in the same category. //------------------------------------// Version 1.x has missing functions + PDAr
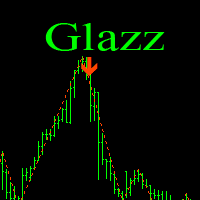
Glazz is a great mix of standard Bollinger Bands and ZigZag . The essence of the strategy - is the search for extreme points - possible reversals. When building a signal, we use Bands of a large period and a small ZigZag period. When the indicator has calculated the entire value for signal search, it shows an arrow to buy/sell and gives a sound signal. Simply put, ZigZag is looking for a possible reversal, and Bollinger Bands confirms this reversal.
The indicator settings are simple. By defaul

The indicator offers a comprehensive suite of features for identifying key market areas, including: Supply Zones Demand Zones Fair Value Gaps (FVG) and provides alerts whenever price reaches a supply or demand zone. Key Features: Historical Zones: In addition to active zones, the indicator now includes historical supply, demand, and FVG zones, allowing for a deeper analysis of past price behavior. Flexible Zone Timeframes: Zones can be plotted independently of the chart's timeframe, enabling sce
MetaTrader市场是 出售自动交易和技术指标的最好地方。
您只需要以一个有吸引力的设计和良好的描述为MetaTrader平台开发应用程序。我们将为您解释如何在市场发布您的产品将它提供给数以百万计的MetaTrader用户。
您错过了交易机会:
- 免费交易应用程序
- 8,000+信号可供复制
- 探索金融市场的经济新闻
注册
登录