Смотри обучающее видео по маркету на YouTube
Как купить торгового робота или индикатор
Запусти робота на
виртуальном хостинге
виртуальном хостинге
Протестируй индикатор/робота перед покупкой
Хочешь зарабатывать в Маркете?
Как подать продукт, чтобы его покупали
Технические индикаторы для MetaTrader 4 - 119
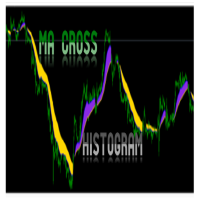
MA Histogram is MT4 Indicator for beginners which plot a histogram after Moving Average Crossover of 2 MAs. The Indicator does not have arrow or alert. It will simply plot on chart the potential Up and Down trend when trend is beginning or ending. It will show a Blue color for potential up trend and Gold color for potential down trend. Recommended pairs: All MT4 pairs including Indices You can change inputs to suit your Moving Average cross parameters and color for histogram.
Get for Forex MT
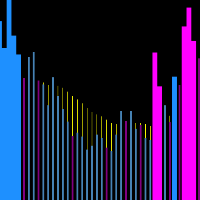
Trend Show Volume
This indicator allows you to visualize volume distortions. When the volume increases by x percent we have different colors and sizes plotted.
Indicator Parameters pPercentShow - Percentage of volume on which different colors and sizes will be plotted pLength - Average applied to volume [background bar] pModeMA - Type of media applied to the volume
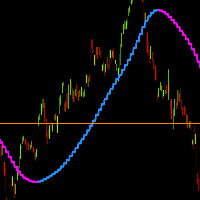
[Trend Price Actions ]
This indicator allows you to plot higher time moving averages on lower time charts with color trend change indicator.
[Indicator Parameters] [pTimeFrame] - [Timeframe for calcule moving average ] [pTrendPeriod] - [Period moving average] [pTrendPrice] - [Price of moving average] [pTrendPow] - [Power of the moving average movement]
...

Этот индикатор использует комбинацию скользящих средних.
С самого начала вы сможете определить очень простой, но прибыльный паттерн стратегии (даже начинающий трейдер не пропустит его).
Он поставляется с уже определенными входными параметрами для пользователя. Несмотря на уже определенные параметры, пользователи по-прежнему могут изменять ТОЛЬКО ЦВЕТА в соответствии со своими предпочтениями или по своему вкусу.
Встроенные параметры, так что вам больше не придется беспокоиться об изменен
CURRENTLY 20% OFF Pips breaker pro indicator MT4 Version and definitions : **Please contact us after your purchase and we will send you the complimentary indicators to complete the system.**
This indicator does not send any signal without a reason...You can observe and analyze the indicator and the signals it sends Cycle Sniper is not a holy grail but when you use it in a system which is explained in the videos, you will feel the difference. We recommend watching the videos about the india
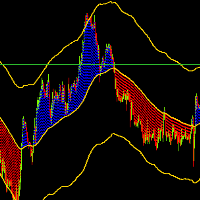
OrionZ
This indicator allows you to view the price trend and channel. When the price is above the average we have a trail color when the price is below we have another
Indicator Parameters [pTimeFrame] - [Timeframe for calcule moving average] [pPeriod] - [ Period moving average] [pMethod] - [ Method moving average] [pPrice] - [ Price applied moving average] [ChannelSpace] - [ Channel space between the average price]

В настоящее время праздничная скидка составляет $399! Цены могут вырасти в будущем. Читайте описание ниже!
Представляем Ultimate Dynamic Levels - ЛУЧШИЙ индикатор входов для Ultimate Sniper Dashboard! Чрезвычайно низкий риск своевременных входов и высокий RR!!!
Найдите Ultimate Sniper Dashboard ЗДЕСЬ. Самая важная способность как для начинающих, так и для профессиональных трейдеров - точно определить, где и когда рынок, скорее всего, развернется, и как безопасно войти в рынок и выйти из нег
This indicator will mirror the assets in use in another Metatrader, being able to choose the timeframe and a template. This is the Metatrader 4 Server, it can work with Metatrader 4 or 5 Client versions: Metatrader 4 Mirror Chart Client: https://www.mql5.com/en/market/product/88649
Metatrader 5 Mirror Chart Client: https://www.mql5.com/en/market/product/88650 Details of how it works in the video.
Скальпинговый индикатор , для любой валютной пары и любого таймфрейма. Индикатор показывает стрелками вероятные точки разворота цены, основываясь на законах рыночной закономерности. Индикатор не перерисовывает свои сигналы. При появлении стрелки, индикатор может отправлять трейдеру сигнал на мобильный телефон, а так же на email. Индикатор очень прост в настройки. Имеет всего один параметр для настройки сигналов "Period". Изменяя этот параметр, Вы будете менять точность сигналов индикатора и коли
this indicator functions to read buffers from other custom indicators, and combine 2 signals from each indicator Instructions 1. you have to know the buffer up or down of the indicator you want to use 2. if the indicator is in the same folder, you just need to enter the name of the indicator in the indicator name column if the custom indicator is in a separate folder, you can type it in the format folder1/folder2/name indicator
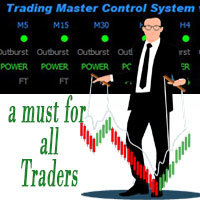
Характеристики системы управления Trading Master
TMCS — это инструмент, который показывает вам с одного взгляда статус актива. TMCS показывает вам все временные рамки, показывает тренд, торговую силу и рассчитывает на основе предупреждений о торговой силе для торговых сигналов. Индикатор рассчитывает прорывы полос Боллинджера. Кроме того, и это очень ВАЖНО, он показывает вам, что когда таймфрейм плоский, это означает, что реальная торговая сила отсутствует. Подробнее смотрите на скриншотах

This indicator helps to identify market sessions, It's High/Low, Open Range (OR), range of the sessions in pips and percentage of previous day (change%) under OHLC.
It is also editable for any brokerage market watch time. For traders who use session trading strategies such as Mark B. Fisher ACD it can be super effective, where they can edit OR from the settings to either line or box. We tried to make the settings easier to edit, for traders' use on different markets, charts and brokerage time.
DESCRIPTION:
Account Information Panel v1.1 is a MT4 (MetaTrader 4) indicator, and it is an excellent tool to track and analyze your investments monthly under an investor's view to help investors/traders understand their investment/trading quickly without spending hours to do manual calculation. FEATURES:
Display a basic information Balance Equity Margin Free margin Margin level Leverage Swap (long/short) Spead Current DD (drawdown) Active positions (long/short, lot, profit/loss) Display we

Версия MT5 | Как установить? | FAQ Индикатор Owl Smart Levels – это полноценная торговая система внутри одного индикатора, которая включает в себя такие популярные инструменты анализа рынка как усовершенствованные фракталы Билла Вильямса , Valable ZigZag, который строит правильную волновую структуру рынка, а также уровни Фибоначчи, которые отмечают точные уровни входа в рынок и места взятия прибыли. Подробное описание стратегии Инструкция по работе с индикатором Советник-помошник
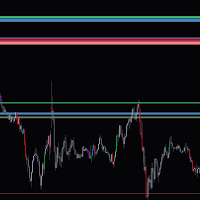
This indicator shows zones based on daily candles in the chart , Make sure you have enough daily bars in the chart before loading the indicator to the chart, These zones can act as both supply and demand zones. The zones are not subjected to repaint. If you have less zones or no zones for current prizes under the default inputs, try increasing the past days input and the zone sizes values gradually. If you have more zones than you need in chart try decreasing the past days and the zone size val
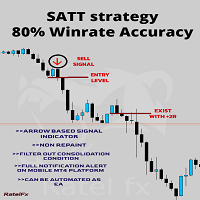
Стратегия SATT ( Техника торговли системным подходом ) Это революционно новый способ торговли на финансовом рынке.
Это система верхних индикаторов, которая обеспечивает наиболее точные торговые сигналы как для входов, так и для выходов.
Этот алгоритм системного индикатора обеспечивает наиболее точный и точный сигнал только во время очень импульсивной фазы рынка.
Этот системный индикатор хорошо работает в течение периода большого объема, который является только первыми тремя часами конкрет
Realtime Stop Hunting Background What Is Stop Hunting? I refer to the definition of Stop Hunting from Investopedia, Stop hunting is a strategy that attempts to force some market participants out of their positions by driving the price of an asset to a level where many individuals have chosen to set stop-loss orders. The triggering of many stop losses at once typically creates high volatility and can present a unique opportunity for investors who seek to trade in this environment. Setting up the

The Qv² Histogram - Indicator developed for traders with advanced experience. This indicator has two purposes: 1-) Identify price normality patterns (green color) 2-) Identify abnormal price patterns “outliers” (red color) ====================================================================================================================================== Interpretation for trades in start trend: Histogram (Green color) crossing the zero line upside - uptrend. Histogram (Green color) crossing th
Современный индикатор паттернов PPR по торговой стратегии RAIT. Работает по тренду и без него. Имеет настройки таймфрейма для отображения. Можно настроить количество баров для отображения индикатора на графике. Используется несколько паттернов PPR. Индикатор предпочтительно использовать на часовом таймфрейме и выше, но работает и ниже . Паттерны: PPR, PinPPR, OutPPR. Отображаются одной стрелкой.

Индикатор целей покупки и продажи Он состоит из трех строк: первый зеленый цвет обозначает цели покупки, второй красный цвет — цели продажи, а третий синий цвет — среднюю цену. Есть два способа войти - Метод 1: Точка входа, когда средняя цена пробита длинной свечой снизу и остается выше синей линии с зеленой свечой, считается покупкой. Когда средняя цена пробивает вершину красной свечой, это считается продажей. Второй способ: путем достижения целей, например, при до

ICT Core Content Concepts turned into indicator plus all previous tools known from the Position Smart Indicator . This makes it the Full PSI Private Version ( read more ) restricted up to now but available only after the Mentorship Core Content was made public on YouTube. You will find many price action study tools like: Central Bank Dealing Range - CBDR Asian Range FLOUT Profiles and SD targets on the CBRD, Asian Range and Flout both on the wicks and on the bodies Seek & Destroy Profil

Бары средней цены (APB) представляют собой модифицированные свечи типа Heikin-Ashi. Хейкин-аши — это японский термин, который переводится как «средний бар»; отсюда и название — бары средней цены. Бары средней цены обеспечивают лучшее отображение текущего рынка, устраняя или уменьшая колебания номинальной цены, часто называемые «изменчивостью» текущей цены High, Low и Close.

Hi! Between the given time range. Adds profit and lot. This can be written on the charter in English and Hungarian. The name of the symbol must be entered exactly. Good used for it. :)
Szia! A meg adott idősáv között Összeadja a profitot és lot-ot. Ezt ki írathatjuk Angolul és Magyarul a chartra. Pontosan kell beírni a szimbólum nevét. Jó használatott hozzá. :)
Best Solution for any Newbie or Expert Trader!
Forex Support Resistance is a unique, high quality and affordable trading tool because we have incorporated a number of proprietary features. it calculate highest high and lowest low of Previous X bars with possibility to select timeframe as desired . also it display the values of highest high and lowest low of Previous bar as a comment at the main chart . Imagine how your trading will improve because you are able to pinpoint the exact trigger po

ZigZagSpeed indicator measures the rate of formation of zig and zag over time calculated by the known zig zag indicator. The calculation system is simply calculated by dividing the difference in pips by the number of bars elapsed in the selected time frame. The speed measurements that occurred in the past period will also be displayed on the graph together with the date of occurrence. Velocity numbers are located above or below each zig and zag formation in white. The number shown in yellow rep
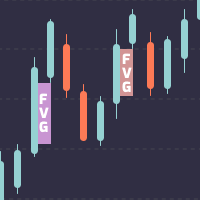
Индикатор разрыва справедливой стоимости для MetaTrader 4.
Разрыв справедливой стоимости — это модель ценового действия с тремя свечами, которой научил известный трейдер с умными деньгами, трейдер внутреннего круга, также известный как ICT. По сути, это гэп, остающийся открытым на графике, когда цена движется слишком быстро. Это область тела средней свечи, на которую не накладываются тики левой свечи и правой свечи рядом с ней. Когда цена оставляет гэп на графике, мы должны помнить о двух вещ

Индикатор для скальпинга 2 в 1. Покупая этот индикатор, Вы получаете в подарок автоматического робота! Автоматическая система поиска точек разворота цены. Индикатор точками на графике валютной пары показывает вероятноные точки разворота движения цены. Красная точка указывает на разворота движения внизу, а синяя точка указывает на разворот движения цены вверх. Индикатор отлично подходит для торговли внутри дня по стратегии скальпинга. Идеально сочетается с канальными индикаторами. Когда канальны

Easy to use indicator that will help you place your pending and market orders with great accuracy. The indicator plots the order blocks based on how price reacts to current market structure. These key levels represent supply and demand zones and the Smart Blocks Trading System indicator uses price to assess whether an asset is being accumulated or distributed. It can be used on any financial instrument, and on any given time frame.
BoS stands for Break of (market) Structure. The blue and red
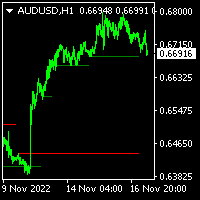
This indicator is intended to help traders to see today's daily range compared to the average daily range. You can change the number of days for the average daily range otherwise you can use 20 as the default. The % Reach will give info about the progress today's range toward the average daily range. Breakout traders, or pullback traders normally will look at base area, in which they might want to know the average daily range as comparison.
The indicator has color code green and red, where th

This indicator is developed based on the multiple session trading to aid in analysis for all the day traders. The indicator supports all currency pairs as well as other trading instruments like indicies, commodities, metals ,etc. The way the indicator work is by making analysis on your behalf. During asian session that's when the indicator does the calculations and provided trading plans in form of areas on the chart for the current day. And this process happens everyday which allows for hands f

This indicator easily calculates the reward to risk ratio and indicates the stop out level and take profit limit with graphical boxes. Also shows the reward steps with fibonacci levels without changing the fibonacci default levels, this is a lot useful for people who use fibonacci retracement. Very user friendly interface and easily to use with graphical buttons.

** All Symbols x All Time frames scan just by pressing scanner button ** *** Contact me to send you instruction and add you in "Order Block group" for sharing or seeing experiences with other users. Introduction: The central banks and financial institutions mainly drive the market, Order block is considered a market behavior that indicates accumulation of orders from banks and institutions, then the market tends to make a sharp move(Imbalance) on either side once the order block is completed. O
A simple and precise Indicator to identify potential supply and demand zones for price reversals. It was first described in Jason Pearl's Book, " Demark Indicators", published in 2008. It can be used both as Support and Resistance, and can be traded as a Breakout or as a Fakeout, depending on your trading style, and depending on how the candle was closed in proximity to TDST.

Анализ нескольких таймфреймов валютной пары в одном окне может вас запутать.
Для анализа нескольких таймфреймов вам нужны надежные индикаторы.
Один из них использует кривую 9TF MACD.
Я работал день и ночь, чтобы создать простой, но надежный код, покрывающий все девять таймфреймов всего в одном индикаторе.
Давайте рассмотрим некоторые преимущества этого индикатора:
Красочная гистограмма. Цвет кривой на каждом таймфрейме отличается друг от друга. Стрелки, указывающие на пересечение осно
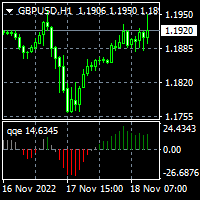
To download MT5 version please click here . - This is the exact conversion from TradingView: "QQE mod" By "Mihkel00". - It can be used to detect trend direction and trend strength. - Gray bars represent weak trends. You can set thresholds to achieve better accuracy in detecting trend strength. - There is buffer index 15,16,17 to use in EA for optimization purposes. - The indicator is loaded light and non-repaint. - You can message in private chat for further changes you need.

A Gap often occurs when the price moves with "strength" in a given direction (either up or down). This Gap is formed when, in looking at 3 consecutive candles, the wicks of the 1st and 3rd candles do not overlap. When this happens, the indicator creates a rectangle where the Gap is located. It identifies a zone where the price could potentially go back to (mitigation). The Gap/rectangle is mitigated when the price returns and completely covers the rectangle. Note that the indicator also show

To download MT5 version please click here . This is the exact conversion from TradingView: "WaveTrend [LazyBear]" By "zeusuk3". One of the coolest indicators out there to detect overbought and oversold zones. It can be used as a part of more complicated strategy and for confirming a potential trade setup. There are buffers to use in EAs also. The indicator is loaded light and non-repaint. - You can message in private chat for further changes you need. Thanks for downloading
** All Symbols x All Timeframes scan just by pressing scanner button ** *** Contact me to send you instruction and add you in "Channel Scanner group" for sharing or seeing experiences with other users. Introduction: The Channel pattern is described as the area located between two trend lines. This area is used for a measure of a trading range. In this case, the upper trend line connects price highs while the lower trend line connects price lows. Also when it comes to breakout points, it helps t

Emini Signal Bar
Price - Promotion: $100 - Normal Price: $200
Symbol Recommended - S&P 500 Index / US500
Timeframe - 5 minutes Buffer Information - Buy Trade Buffer = 2 - Sell Trade Buffer = 3 Main features - Show Buy Signal Bar and Sell Signal Bar on Live Chart. - Get Alert from signal bar. - The precision of the Alert is superior to dots. (Alert is active at that time) - Dots will be recalculated after reset the properties. After the Alert is displayed, kindly make your decisions to tra

ЕСЛИ ВЫ ПРИОБРЕЛИ ИНДИКАТОР -> Отправьте мне сообщение о параметрах настройки бонуса, которые РАБОТАЮТ! и TACTICAL TREND EA бесплатно! ТАКТИЧЕСКИЙ ИНДИКАТОР ТРЕНДА — лучший индикатор тренда на рынке; он работает на всех таймфреймах и активах и был создан после 6-летнего опыта работы на валютном и других рынках. Многие трендовые индикаторы в Интернете неполные, бесполезные и с ними сложно торговать, но индикатор TACTICAL TREND отличается; он показывает сигнал на покупку или продажу, а для подтве
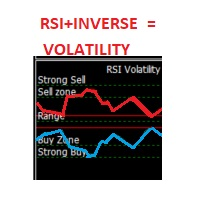
This indicator is an oscillator that shows the RSI (Relative Strength Index) in red and its inverse graph in a light green. Together this shows the volatility of the market (in its default setting). You can also change it to show only the RSI graph. It also gives you the possibility to change its Period. The oscillators zones (80,70,50,30,20) are marked by Strong Sell, Sell Zone, Range, Buy Zone, and Strong Buy respectively.

Благодаря данному индикатору вы сможете проанализировать торговлю всех ваших советников с одного счёта.
Вам не придётся заводить для каждого советника отдельный терминал, чтобы оценить конкретно его работу.
Индикатор умеет анализировать историю счёта по магическим номерам и вы сможете увидеть какая настройка с присвоенной ей магическим номером дала какие результаты.
более того вы сможете проанализировать отдельно сделки на Buy и на Sell , это недооцененный момент многих трейдеров поскольку
KFX Dashboard monitors Price Action using Candle Direction + Moving Average on Multiple currency pairs (selectable by you) and on Multiple Timeframes (selectable by you). The dashboard also reveals Currency Strength of pairs based on your Moving Average selection.
FEATURES
- Price Action: Candle Direction + Moving Averages(3x shown on chart). - Multiple Symbols and Multiple Timeframes. - Currency Strength Analysis. - Monitors Open Trades: Currency Amount + Pips. - Symbol button(click) chang
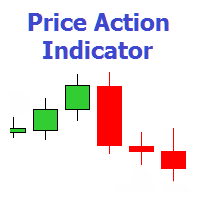
Индикатор показывает 7 паттернов торговой системы Price Action, а также максимальную и минимальную ценовые линии за день. Таймфрейм: H1, H4, D1. Pin Bar - пин-бар. Outside Vertical Bar (OVB) - внешний бар (поглощение) . Pivot Point Reversal (PPR) - опорные точки разворота. Closing Price Reversal (CPR) - разворот на закрытии. Double Extremums (DMax/DMin) - равные экстремумы High или Low двух баров. Wide Range Bar (WRB) - самый длинный бар из ближайших. Inside Bar (IB) - внутренний бар. Настройки

Volume Champion — индикатор, который анализирует объем рынка и отображает данные в виде гистограммы. Вам не нужно углубляться в теорию анализа рынка. Вы можете просто следить за показаниями индикатора. Столбцы индикатора показывают потенциальное направление движения цены на основе анализа структуры объема рынка. Индикатор может использоваться на любом тайм фрейме. Наибольшая точность достигается на старших тайм фреймах. СИГНАЛЫ НЕ ПЕРЕРИСОВЫВАЮТСЯ! Технически индикатор можно использовать и с др

Trend TD – индикатор трендовый. Благодаря алгоритму данного индикатора, сигнал никогда не будет идти против тренда. Благодаря двум линиям формирующих узкий канал алгоритм анализа точек входа, алгоритм контролирует моменты разворота в тот момент когда верхняя линия канала развернулась и можно визуально нарисовать линию пересекающую верхнюю линию с самой собой в прошлом, при этом пересечив в одной точке нижнюю линию. Если данное правило будет зафиксировано, тогда будет четко указан сигнал на граф
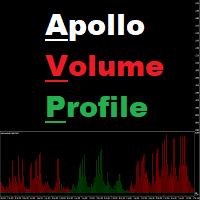
Apollo Volume Profile - это индикатор, который определяет направление движения рынка, используя анализ по объемам. Индикатор очень прост в применении. Данный индикатор наглядно показывает соотношение продавцов и покупателей на рынке, в зависимости от используемого тайм фрейма. Индикатор может использоваться в качестве основы для любой торговой системы. Индикатор не перерисовывает свои сигналы. Данный индикатор можно использовать для торговли любыми финансовыми инструментами, такими как валюты, м

Индикатор построен на не стандартном Zig Zag ,он отрисовывает накопления после чего если цена выходит с этой зоны и происходит тест этой зоны,то подаётся звуковой сигнал и появляется стрелка- после закрытия тестовой свечи.Индикатор не перерисовывает свои сигналы,очень прост в использовании,всего три настройки 1- это параметр zig zag 2- это минимальный выход цены из зоны 3- это максимальный выход цены из зоны.Чем ниже параметр для Zig Zag,тем больше ложного сигнала,но и также чаще точек входа(р
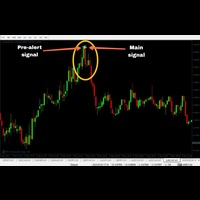
'Zoro PRO' is a reversal strategy based MT4 indicator with advance pre-alert system. Its an 100% non repaint indicator with an average accuracy of about 70-95% in any kind of market. (EXCEPT BAD MARKET AND NEWS TIME)
MT5 version: https://www.mql5.com/en/market/product/90934 (MT5 version not recommended)
Recommended Broker: Alpari, Amarkets, tickmill. Recommended pairs for M1:
EURUSD
AUDJPY
GBPUSD
EURJPY
NZDJPY
CADJPY
EURGBP
USDCAD
GBPCHF
GBPCAD
EURNZD
AUDNZD
---------
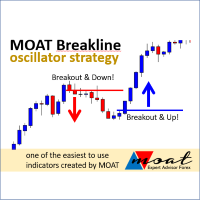
The indicator will provide a breakout line or price stop guide, we recommend M5 or H1 timeframes. Trade signal: Buy Signal: if the closed price (according to the timeframe) breaks the blue line and is already above it or if the lowest price stops above the red line. Sell Signal : if the closing price (according to the timeframe) breaks the red line and is already below it or if the highest price stops below the blue line. Feature: You will get time (hours) and price values for the lines
Nepsetms45 - форекс индикатор для скальпинга, который показывает трейдеру точки разворота цены и текущее направление тренда. Точность сигналов индикаторов в среднем 87%. Это говорит о том, что если на графике индикатор нарисовал стрелку, то с вероятностью 87%, цена в ближайшее время пойдет в направлении стрелки как минимум на 20 пунктов или более. Так же индикатор с помощью линий на графике показывает направление тренда и силы движения. Nepsetms45 - это готовая торговая система для скальпинга вн
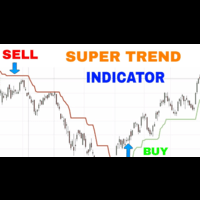
The SuperTrend Non Repaint Indicator is particularly stable and has a few advantages.
1.Magnified Market Price added for instant check of current market price
2.It uses a moving (statistical) median of the arithmetic mean (High + Low)/2 of the bars instead of a moving average. The (statistical) median is known to be more robust than any average.
3.It calculates both the Median and the ATR (average true range) 1 bar ago, whereas the original SuperTrend indicator takes the ATR and moving aver

Looking for an indicator that identifies high-probability price action patterns? Love counter-trend trading? The Kangaroo Tailz indicator might be just for you. This indicator is meant to be used as a reversal detector. I personally would rather enter a position at the beginning of a trend rather than catch the last couple of moves. This indicator does a good job of alerting when price may reverse by identifying price action patterns that occur frequently in markets. Even though this indicator i

Анализ нескольких таймфреймов валютной пары в одном окне может вас запутать.
Для анализа нескольких таймфреймов вам нужны надежные индикаторы.
Один из них использует 9TF STOCH RSI.
Я работал день и ночь, чтобы создать простой, но надежный код, покрывающий все девять таймфреймов всего в одном индикаторе.
Давайте рассмотрим некоторые преимущества этого индикатора:
Красочная гистограмма. Цвет кривой на каждом таймфрейме отличается друг от друга. Стрелки, указывающие на пересечение основн

Pivot Point Indicator (Poivt)
ClassicMode indicator calculation formula (ClassicMode):
pp=(High+Low+Close)/3.0
s1=2*pp-High
s2=pp-(High-Low)
s3=Low-2*(High-pp)
r1=2*pp-Low
r2=pp+(High-Low)
r3=High+2*(pp-Low)
Woodie Mode indicator calculation formula (WoodieMode):
pp=(High+Low+2*Close)/4.0
s1=2*pp-High
s2=pp-(High-Low)
s3=Low-2*(High-pp)
r1=2*pp-Low
r2=pp+(High-Low)
r3=H
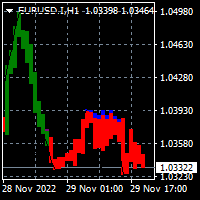
To download the MT5 version of Donchian Trend Ribbon please click here . This is inspired by TradingView: "Donchian Trend Ribbon" By "LonesomeTheBlue". As MT4 does not support HISTOGRAM bars to be customized I decided to adjust the donchian ribbon on candle chart. The result is one of the coolest indicators out there to detect trend direction and strength. The indicator is loaded light and non-repaint. Note: Please adjust candle width via input tab depending on your choice of chart zoom. Thanks
СИГНАЛ ОТКРЫТИЯ OSW
(МЕТАТРЕЙДЕР 4)
Вы хотите работать, ломая взлеты и падения? это идеальный индикатор для получения сигналов от входа такого типа.
Как только индикатор запустится, он не покажет вам никакого сигнала, но по мере роста цены он будет читать рынок, пока не найдет идеальный паттерн для прорыва.
Индикатор для чтения максимумов и минимумов имеет специальную настройку для Зигзага, что позволяет брать только самые подходящие.
Как и любой индикатор, он не дает идеальных входов
DepthTrendView is an indicator that is used to see the direction of the market very clearly compared to the indicators that are commonly used by many people.
What is interesting about this indicator is that you can see the direction of the trend and also know that the market is at the end or that the market wants to start a new trend.
How to Use: 1- To see the earliest BUY direction you need to see previous candle below Aqua Line before green arrow appear.
2- To see the earliest SELL dire

MA Revolution is upgraded version of standard Moving A verage. With the current upgrade moving average line got more sensitive with different market conditions. It gets more flexible by decreasing default period step by step while market is sharp and incrasing period back to default period step by step while market is normal again. testing of the ide a shows th at this upgr aded version gives much more acur acy for detecting m arket direction, ch anges in direction are shown much e arly th an
Разместите индикатор на графике, желательно с таймфреймом H1 или H4. Если вы торгуете в дневном диапазоне или, наоборот, на младших таймфреймах — вам нужно будет соответствующим образом настроить уровни RSI и ATR. Синие стрелки индикатора будут сигналом к открытию длинной позиции, красные стрелки — сигналом к открытию короткой позиции: 1) Синяя стрелка для лонгов (рост) и красная стрелка - для шортов (спад). 2) Две горизонтальных линии для текущих позиций (одна для входа и одна для стопа). 3)
This indicator is very useful for those who trade with investor techniques. That's why I named it InvestorTool. Why investors? Isn't this a tool for trading? This indicator is basically to help investors to identify which pairs are very close to their All-Time-Low or All-Time-High. So that the investor will quickly spot which instruments are "relatively" at its low cost, and telling the minimum equity required.
If the pair is close to All-Time-Low then investor can put a buy position. Whe
Индикатор Market Structure MTF – это успешная попытка формализации структуры движения цены по уникальному алгоритму. Он безошибочно раскладывает любое движение цены на составляющие элементы и позволяет не упустить ни одной интересной точки входа или выхода. Важной особенностью индикатора Market Structure MTF является визуализация структуры движения цены сразу на двух таймфреймах – на текущем и на любом старшем по выбору пользователя. Не смотря на внешнюю схожесть с различными Зигзагами, данны

Analyzing multiple time frames of a currency pair in one window can make you confused. To analyze multiple time frames, you need reliable indicators. One of them is using 9TF RSI MA . I've been working day and night to create code that is simple but reliable and covers all nine time frames in just one indicator . Let's look at some of the advantages of this indicator: Colorful histogram . The color of the curve in each timeframe is different from one another. Arrows indicating the crossing of

KT Know Sure thing is a momentum oscillator based on the smoothed rate of change over four different timescales and was developed by Martin Pring. In 1992, Pring published the initial description of the indicator in Stocks & Commodities magazine's "Summed Rate of Change (KST)" article. KST creates a momentum oscillator by combining the price momentum measurements from four different price cycles. Traders can utilize KST to search for bullish or bearish divergences, signal line crossovers, and ce

KT Forex Line can be described as an improved version of the moving average indicator. The indicator is embedded in the main trading chart and features a line that switches between blue and white depending on the prevailing direction or mood of the market.
Utilizing the indicator is simple. You do not need to understand complex graphs and intricate lines. Recognize the indicator line's color and trade accordingly.
Key Features
The indicator has customizable colors, with the blue and red b

The KT Market Speed is a unique and straightforward oscillator-based technical analysis tool that helps traders visualize the speed at which the price of an instrument changes based on the preset length. The Market Speed representation helps correctly map the price momentum: is it moving fast, slowing down, or trapped in a range? These are the questions the indicator answers, giving traders more bandwidth to execute better-informed trade positions.
Formula
It's a simple technical analysis t

KT Forex Super Scalper is created to identify market trends and plot trade signals based on the direction of the predetermined trend. It functions very similarly to moving averages but reacts quickly to changes in price actions and can signal right away once a valid trend is confirmed. The quick reactionary feature makes it a valuable tool for scalpers. However, anyone familiar with moving averages can use it for actual trading because of its signaling process and chart demonstration simplicity

The double top bottom pattern is arguably one of the technical analysis's most popular chart patterns. These patterns are used to capitalize on recurring patterns and identify trend reversal patterns, thereby creating well-placed entry and exit levels. The KT Double Top Bottom is based on these patterns and fine-tunes the trade signal development process for traders.
Features
It's based on one of the most reliable trading patterns and brings some fine-tuning and automation to the process. A
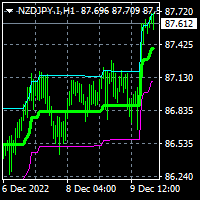
To dowload MT5 version please click here . This is the exact conversion from TradingView: "Range Filter 5min" By "guikroth". - This indicator implements Alerts as well as the visualizations. - Unlike the MT5 version it does not support HeikenAshi and candle colors. - This indicator lets you read the buffers for all data on the window. For details on buffers please message me. - This is a non-repaint and light processing load indicator. - You can message in private chat for further changes you ne

PLEASE LEAVE US A 5-STAR REVIEW LDS Scalper User Manual+ Extra LDS CSDIF INDICATOR + Training Videos ABOUT LDS SCALPER INDICATOR STRATEGY Built on 15+ years of trading experience. LDS Scalper is a very powerful trading indicator for scalping strategy, returns very high accuracy rate in forex, futures, cryptocurrencies, stocks and indices. This indicator displays arrow signals based on price action information with high accuracy. The LDS Scalper Indicator strategy when applied can turn a ne
MetaTrader Маркет - торговые роботы и технические индикаторы для трейдеров, доступные прямо в терминале.
Платежная система MQL5.community разработана для сервисов платформы MetaTrader и автоматически доступна всем зарегистрированным пользователям сайта MQL5.com. Ввод и вывод денежных средств возможен с помощью WebMoney, PayPal и банковских карт.
Вы упускаете торговые возможности:
- Бесплатные приложения для трейдинга
- 8 000+ сигналов для копирования
- Экономические новости для анализа финансовых рынков
Регистрация
Вход
Если у вас нет учетной записи, зарегистрируйтесь
Для авторизации и пользования сайтом MQL5.com необходимо разрешить использование файлов Сookie.
Пожалуйста, включите в вашем браузере данную настройку, иначе вы не сможете авторизоваться.