Смотри обучающее видео по маркету на YouTube
Как купить торгового робота или индикатор
Запусти робота на
виртуальном хостинге
виртуальном хостинге
Протестируй индикатор/робота перед покупкой
Хочешь зарабатывать в Маркете?
Как подать продукт, чтобы его покупали
Технические индикаторы для MetaTrader 4 - 127

Индикатор визуализирует результат работы скрипта CalculateScientificTradePeriod (который, конечно, также нужно скачать), который, во-первых , оценивает в течении скольких Mx баров активного графика будет наиболее вероятно продолжаться будущий тренд и каково его качество, и, во-вторых , вычисляет тот оптимальный период усреднения (что также равен Mx ) индикатора ScientificTrade , который дает максимальную прибыль по крайне эффективной стратегии ScientificTrade . Для работы

Scalping Entry Points - ручная торговая система, которая может подстраиваться под движения цены и давать сигналы для открытия сделок без перерисовки. Направление тренда индикатор определяет центральным уровнем поддержки и сопротивления. Точечный индикатор предоставляет сигналы для входов и выходов. Подходит для ручной торговли внутри дня, скальпинга и бинарных опционов. Работает на всех тайм-фреймах и торговых инструментах.
Индикатор дает несколько типов оповещений.
Как использовать продукт
Си

Jerk Trend это новый продукт, который позволяет идентифицировать текущую рыночную фазу (восходящий тренд, нисходящий тренд или флет). Представляет собой типичную стратегию инвесторов, которая обычно указывает на изменение тренда от медвежьего к бычьему. Инструмент, который позволяет определить направление и силу тренда. В отличие от большинства индикаторов Jerk Trend находит более длительные тренды и дает меньше ложных сигналов.
Данный индикатор отображает стрелки разных цветов в зависимости о
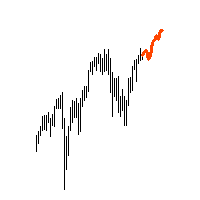
"AV Forecast" is a preview or forecast indicator for MetaTrader 4, which draws forecast future price changes on the chart from historical data. To do this, it primarily uses the everyday rhythm and the seasonality of the year. For timeframes below H1 closer dates can be selected. The lines for calculation can be made visible.
Settings:
- Draw line for x candles: draw x candles in the future
- Show all lines: yes/no
- Look back years or mixed (> H1 same): one year back or less beneath H1
Scr

Представляем вам индикатор самолета F-16, передовой инструмент MT4, разработанный для революционизации вашего торгового опыта. Вдохновленный беспрецедентной скоростью и точностью истребителя F-16, этот индикатор объединяет передовые алгоритмы и передовую технологию, чтобы обеспечить беспрецедентную производительность на финансовых рынках. С индикатором самолета F-16 вы будете парить над конкурентами, так как он обеспечивает анализ в реальном времени и генерирует высокоточные торговые сигналы. Ег

Готовая торговая стратегия на сигналах индикатора "Myforexfunds":
1. Точка входа на рынок: Когда индикатор рисует синюю линию, открываем крышку на покупку (длинную). Когда индикатор рисует красную линию, открываем крышку на продажу (короткую). Входить на рынок можно при закрытии бара, когда образуется новый сигнал.
2. Точка выхода с рынка: Установить-стоп-лосс (стоп-лосс) на старое расстояние от входной точки, исключающие потенциальные потери в случае неправильного направления рынка. Например

Индикатор тренда Shock Trend, показывает моменты для входа в рынок стрелками. Это гибридный индикатор, так как основывается на сигналах нескольких двух достаточно известных продуктов - индикатор среднего истинного диапазона, который определяет диапазон минимальных и максимальных ценовых колебаний, а также цен закрытия. В результате - указывает текущую рыночную волатильность. Также индикатор семейства осцилляторов. Индикатор помогает рассчитать уровни перепроданности и перекупленности торгового

Love Trend индикатор, показывающий области покупок и продаж. Индикатор следует за движением цены вокруг цены открытия. Он также отображает информацию о тренде, следующем за пробоем минимума и максимума. У индикатора очень простая, но эффективная графика: выше цены открытия отображается оранжевая точка цвет, ниже цены открытия - синяя. Индикатор включает также звуковое оповещение и всплывающее окно, оповещающие о закрытии свечи в этих важных уровнях. Индикатор позволит всегда быть в курсе тренда

The ICT Concepts indicator regroups core concepts highlighted by trader and educator "The Inner Circle Trader" (ICT) into an all-in-one toolkit. Features include Market Structure (MSS & BOS), Order Blocks, Imbalances, Buyside/Sellside Liquidity, Displacements, ICT Killzones, and New Week/Day Opening Gaps. It’s one kind of Smart money concepts. USAGE: Please read this document ! DETAILS Market Structure Market structure labels are constructed from price breaking a prior extreme
Скринер рынка: Цена, Спрэд и Своп для выбранных символов (Наблюдение за рынком) Вы можете настроить список: задайте только те символы (валютные пары), которые необходимы. Количество символов не ограничено. Список можно сортировать по возрастанию или убыванию (название символа). Панель можно переместить в любое место на графике. Вы также можете свернуть панель. Есть опция уведомления о увеличении размера спрэда по сравнению с средним значением. Многофункциональная утилита : более

TrendXplorer indicator is designed to provide valuable insights into market trends, helping you navigate the dynamic world of trading with confidence. Key Features: Accurate Trend Analysis: TrendXplorer utilizes a special algorithm to analyze trends combined with price action. This enables easier trend detection and is less prone to change during price manipulation. Built-in Risk Calculator: Take control of your risk management with TrendXplorer's built-in risk calculator. This feature assesses

Professional Histogram ( PH ) is a highly efficient and reliable tool for trading Forex, CFDs and binary options. PH is easy to use and configure both for beginners and experienced traders. Unlike most indicators, Professional Histogram finds longer trends and gives fewer false signals. When a buy or a sell signal appears, an alert is triggered allowing you to open a position in a timely manner and avoid sitting at your PC all the time. Professional Histogram for the MetaTrader 5 terminal :

The indicator is like a mother-in-law, who talks often, talks a lot and often inappropriately.
The indicator, in addition to giving us an entry signal on parameters which I will then list, monitors the trend of the hourly timeframe, OSMA to understand the entry direction, RSI to sense any overbought or oversold conditions from which to abstain, ATR for the volatility and ADX for the trend.
Indicator not recommended for newbies.
Only the human judgment of these parameters, combined with the entr

Индикатор Structural Trend помогает анализировать рынок на выбранном временном интервале. Он определяет господствующую тенденцию. Прост в настройке и работает на всех парах и всех временных интервалах. Индикаторы тренда дают возможность классифицировать направление ценового движения, определив его силу.
Structural Trend решение для торговли по трендам и фильтрации со всеми важными функциями инструмента тренда, встроенными в один инструмент! Индикатор Structural Trend является разработкой для т

"Dragon's Tail" представляет собой интегрированную торговую систему, а не просто индикатор. Эта система анализирует каждую свечу по минутам, что особенно эффективно в условиях высокой волатильности рынка. Система "Dragon's Tail" определяет ключевые моменты на рынке, обозначенные как "сражения быков и медведей". Основываясь на этих "сражениях", система дает рекомендации по направлению сделки. В случае появления стрелки на графике, это сигнализирует о возможности открытия двух сделок в указанном н

TruRange is a Next-Level trend and range detection created from algorithms based on price action. No other indicator apart from ATR is used in the computing of the main line indicator
It separates Trending and Ranging market conditions without any lag. It's good to separate mean reverting strategies from trending/breakout strategies.
Settings : Bars : number of bars to compute Sensitivity : a lower value will have longer range periods while a higer value will have more smaller ranging period
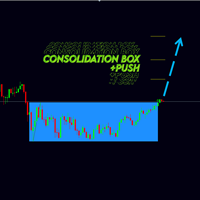
Новая версия индикатора консолидаций Consolidation box Generator. Предыдущая версия тут . Примеры настроек на индикатор тут . На данный момент этот инструмент анализа рынка уже нельзя назвать просто индикатором. Потому как это торговая стратегия. Наше ноу-хау заключается в том, что данный индикатор не требует огромного количества тестов в тестере стратегий. В индикаторе реализован блок статистики - при нанесении на график вам сразу будет видна результативность работы стратегии. Вы можете настро
The Relative Currency Strength Indicator is a tool designed to analyze and compare the strength of a quote currency against four different currency pairs on a selected timeframe. It provides a visual representation of the relative strength of currencies, helping traders identify potential trading opportunities. Key Features: Customizable quote currency: Select a specific currency to measure its strength against multiple currency pairs. Multi-timeframe analysis: Choose the desired timeframe to ev
Уважаемый Форекс Трейдер,
Мы все знаем, что наши валютные продукты остаются в центре внимания рынка форекс с момента его создания. Спасибо нашим подписчикам, которые присылают нам результаты своей торговой истории в удобном для просмотра формате. Вы также видели сумасшедшие стабильные пипсы, которые эти подписчики генерируют ежедневно. Все сводится к тому, готовы ли вы изменить свою торговлю к лучшему в этом году. Почему бы не включить какой-либо из наших торговых пакетов в свой инвестиционный

Омега-поддержка и сопротивление Уникальный индикатор для стратегий «купи дешево, продай дорого». Входы разворотного типа: когда цена поднимается до полной линии, ожидайте, что цена развернется/качается/развернется. Можно торговать на 1-5-минутных графиках с 4-часовыми для междневных настроек или m15 и выше с дневными, 1-часовыми с еженедельными для долгосрочных настроек. Высокоточный прогноз будущих цен для максимума или минимума любого продукта на недельных, дневных, 4-часовых и даже 1-часовых

XP Speed Meter the best indicator that measures the price/tick’s currency speed for you. It will give you the ability to know when the pair moving fast or slow . So, you can trade or not trade. It’s very important tool for scalper traders – news traders. Even for trend traders it will be useful to know if the market is trending fast or slow . XP Speed Meter is better than the volume type indicators of course. Because it shows the currency speed on the run-time without any lacking like what the v

Представляем удивительный форекс-индикатор "Miraculous": раскройте силу точного трейдинга Вы устали от бесконечного поиска лучшего форекс-индикатора, который действительно доставляет исключительные результаты на всех таймфреймах? Не ищите дальше! Представляем вам форекс-индикатор "Miraculous", который пришел, чтобы изменить ваш опыт трейдинга и поднять ваши прибыли на новый уровень. Основанный на передовых технологиях и годам тщательной разработки, форекс-индикатор "Miraculous" является вершиной

Dear traders I am happy to introduce to you my new tool called "Brilliant Oscillator" Indicator. This is one of the indicators that can be used as a stand alone indicator. WHAT I LIKE ABOUT THIS TOOL IS Fast and reliable signals Purpose The purpose of this tool is to assist both newbie and Advanced traders to analyze the market with high level of accuracy in both bearish and bullish market trends. The inputs In the input section you will be able to change colors of the indicator only. Currency p

Dear Traders here is my another tool called the "Sell Index". My goal is to come up with different tools to help you trade successfully. No matter the strategy and trading style you use but what matters most at the end is "making money out of the market". Go with a strategy that works for you and it should be the one you find easy to use. The philosophy behind this tool is "Focus only on sell signals" meaning that if the market is currently bearish why should you focus on buy signals?. Sometime

Dear Traders here is my another tool called the "Buy Index". My goal is to come up with different tools to help you trade successfully. No matter the strategy and trading style you use but what matters most at the end is "making money out of the market". Go with a strategy that works for you and it must be the one you find easy to use. The philosophy behind this tool is "Focus only on buy signals" meaning that if the market is currently bullish why should you focus on sell signals?. Someti
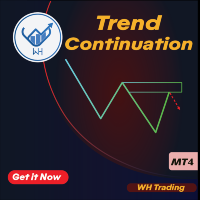
Вы устали упускать выгодные рыночные тренды? Вы хотели бы иметь надежный инструмент, который мог бы точно и точно определять продолжение тренда?
Не смотрите дальше! Наш индикатор продолжения тренда призван усилить вашу торговую стратегию и помочь вам опережать конкурентов.
Индикатор продолжения тренда — это мощный инструмент, специально созданный для помощи трейдерам в выявлении и подтверждении паттернов продолжения тренда на различных финансовых рынках.
Независимо от того, торгуете ли вы ак
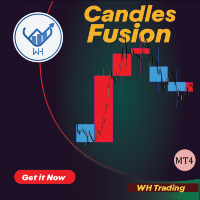
Candles Fusion is a powerful MT4 indicator that enhances your trading analysis by displaying higher timeframe candles on the current timeframe.
This unique feature provides traders with a comprehensive view of price action across different timeframes, enabling them to make more informed trading decisions.
Features:
Multi-Timeframe Overlay. Customizable Timeframe Selection. Clear Visualization and color candle selection . Real-Time Updates. User-Friendly Interface.
Candles Fusion is a mu

Индикатор тренда Riko Trend - революционное решение для торговли по трендам и фильтрации со всеми важными функциями инструмента тренда, встроенными в один инструмент! Индикатор Riko Trend хорош для любого трейдера, подойдет любому трейдеру как для форекс так и для бинарных опционов. Ничего настраивать не нужно все отточено времинем и опытом, отлично работает на во время флета та и в тренде.
Индикатор тренда Riko Trend это инструмент технического анализа финансовых рынков, отражающий текущие от

ForceX Trend - трендовый индикатор который позволяет эффективно определять направление текущего тренда, а также выявлять потенциальные точки его разворота. Индикатор дает возможность классифицировать направление ценового движения, определив его силу. Решение этой проблемы помогает вовремя войти в рынок и получить желаемый результат.
Начнем с преимуществ.
Позволяет определить текущий тренд. Вы можете достаточно быстро понять, какая именно тенденция в данный момент развивается на рынке; Может и
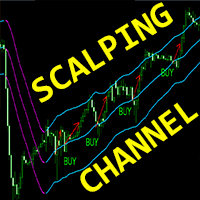
Индикатор Crypto_Forex "Scalping_Channel" для MT4.
- Scalping Channel имеет границы волатильности на основе ATR. - Отлично подходит для скальпинговой торговли: - Входите в сделки, размещая отложенный лимитный ордер на средней линии. - Рассматривайте бычьи входы, когда имеет место зеленый устойчивый восходящий канал и хотя бы 1 свеча закрылась выше верхней границы (см. рисунки). - Рассматривайте медвежьи входы, когда имеет место красный устойчивый нисходящий канал и хотя бы 1 свеча закрылась ни
The FCPI indicator or Forex Currency Power Index indicator for MT4 is a multi currency pairs indicator that displays 28 pairs on 1 chart, which consists of 8 Major Pairs and 20 Cross pairs. 8 Major Pairs and 20 Cross pairs: EURUSD,GBPUSD,AUDUSD,NZDUSD,USDCAD,USDCHF,USDJPY,EURGBP,EURAUD,EURNZD,EURCAD,EURCHF,EURJPY,GBPAUD, GBPNZD,GBPCAD,GBPCHF,GBPJPY,AUDNZD,AUDCAD,AUDCHF,AUDJPY,NZDCAD,NZDCHF,NZDJPY,CADCHF,CADJPY,CHFJPY. Automatically detects symbols that have a symbol prefix and/or a symbol suffi
[ MT5 Version ] Are you tired of spending months on demo or live accounts to test your trading strategies? The Backtesting Simulator is the ultimate tool designed to elevate your backtesting experience to new heights. Utilizing Metatrader historical symbol information, it offers an unparalleled simulation of real market conditions. Take control of your testing speed, test ideas quickly or at a slower pace, and witness remarkable improvements in your testing performance. Forget about wasting time
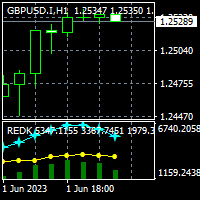
To get access to MT5 version please click here . This is the exact conversion from TradingView: "RedK_Supply/Demand Volume Viewer v3.0" by "RedKTrader" This is a light-load processing and non-repaint indicator. All input options are available. Buffers are available for processing in EAs. You can message in private chat for further changes you need. Thanks for downloading
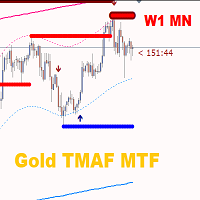
Gold TMAF MTF – это хороший биржевой технический индикатор. Алгоритм индикатора анализирует движение цены актива и отражает волатильность и потенциальные зоны для входа. Самые лучшие сигналы индикатора: Для SELL = красная верхняя граница TMA2 выше красной верхней границы TMA1 + красный указатель фрактала сверху + желтая сигнальная стрелка SR в этом же направлении. Для BUY = синяя нижняя граница TMA2 ниже синей нижней границы TMA1 + синий указатель фрактала снизу + аква сигнальная стрелка SR в эт

Fractals indicator on Steroids. It has many options to customize and display Fractals from Multi Time Frames. The fractals on their own is a technical analysis tool used in trading to identify key turning points in price trends. Fractals, in the context of trading, refer to recurring patterns that occur within price charts. These patterns consist of five consecutive bars, with the middle bar having the highest high or lowest low, surrounded by two lower highs and two higher lows. The Fractals in

Индикатор указывает наиболее подходящие точки входа и выхода из сделок. Также отображаются статистические данные по всем сигналам для лучшего анализа торговли.
С помощью этого индикатора вы сможете лучше понимать рынок. Как только сила тренда начнет слабеть (это будет показано на панели), линия тренда будет тяготеть к горизонтальному положению - это сигнал на выход из сделки. Либо можно выходить при достижении уровня среднего/медианного профита.
Индикатор стал результатом моего торгового опыта с

Стрелочный индикатор представляет собой индикатор, который выводит стрелки на графике для указания направления движения рынка. Красная стрелка указывает на предполагаемое движение вниз, а синяя стрелка указывает на предполагаемое движение вверх. Индикатор работает на всех таймфреймах и всех валютных парах. Торговая стратегия на основе стрелочного индикатора: Вход в позицию: Когда появляется красная стрелка, открываем позицию на продажу (шорт). Когда появляется синяя стрелка, открываем позицию н
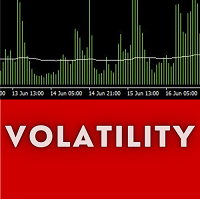
Holy Trinity Volatility Indicator This indicator reflects the peak time of the day wherein there's is expected to be sharp price actions. It also presents the markets as just waking up from the dull and less volatile Asian (and or London) trading sessions into a bustling time of highly liquid price flows. NOTE: This indicator informs the trader ahead of peak price movements - one bar just before the real actions starts. Enter when the volatility line falls below the Tripple Exponential Moving Av

Раскройте всю мощь прибыльной торговли бинарными опционами с индикатором "Eagle Eye" для MT4 Готовьтесь отправиться в уникальное путешествие в мире торговли бинарными опционами с впечатляющим индикатором "Eagle Eye" для MetaTrader 4 (MT4). Этот революционный инструмент готов изменить ваш опыт торговли, наполнив его максимальной точностью и непревзойденной прибыльностью. Войдите в мир, где границы потенциала рушатся, а прибыль максимизируется благодаря непревзойденной точности и надежности индика

Это многоцелевая система, которая подходит как ручным трейдерам Форекс, так и скальперской системе или стратегии для получения очень сильного импульса, трейдерам бинарных опционов или для использования универсальными советниками в автоматической торговле.
Jeslyn — это стратегия, основанная на многолетних исследованиях и ориентированная на конкретную стратегию ценового действия. Он может выглядеть как простой стрелочный индикатор, но имеет сложные и логичные алгоритмы. Он не использует в свои
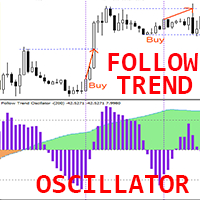
«Follow Trend Oscillator» — это продвинутый пользовательский индикатор Crypto_Forex, эффективный торговый инструмент!
- Удобный индикатор предоставляет возможности для скальпинга в направлении основного тренда. - Плавный и настраиваемый осциллятор с сигнальной гистограммой. - Зеленый цвет осциллятора для восходящих трендов, коричневый цвет — для нисходящих трендов. - Значения перепроданности: ниже -30; Значения перекупленности: выше 30. - С этим индикатором есть множество возможностей для моде

Это простой индикатор, основанный на тренде и разрыве структуры, поэтому я объединил скользящую среднюю и комбинацию стохастиков для получения лучших результатов, которые он будет сигнализировать на основе тренда (MA) для резких входов. Преимущества Системы. Чисто трендовая стратегия. BOS (прорыв структуры на стороне тренда подтверждает сигнал). Минимальное соотношение 1:2 может быть легко достигнуто.

Renko Bollinger Bands are Bollinger bands based on Renko boxes. You can see the free enhanced Renko indicator here . This indicator can be useful to get a better aspect of the price and deviation since it is based on Renko bars. Also the Main line of Bollinger Band is the SMA of Renko bars based on the Period in the inputs.
Inputs:
Box Size: Renko box size based on market Points.
Period: Bollinger Bands Period
Deviation: Bollinger Bands Deviation.

Индикатор ценового канала и генератора отбойных точек внутри него. Он дает представление положения цены относительно периода использования.
Содержит сглаженные трендовые отбойные линии, строящиеся по границам канала и отбойные точки определяющие моменты входа и выхода.
Работает на различных торговых инструментах, и тайм-фреймах.
Как работать с индикатором
Следовать за отбойной линией канала, голубая линия - входные сигналы вверх, розовая линия - входные сигналы вниз.
Входные точки генерируютс

MACD индикатор отображающий информацию одновременно с разных периодов в одном подокне графика.
Параметры Fast EMA — период быстрой средней. Slow EMA — период медленной средней. MACD SMA — период усреднения разности. Type of price — используемая цена. Timeframes for MACD — перечень периодов, через пробел или запятую или точку с запятой. Number of bars for each period — количество отображаемых баров для каждого периода. Sort periods — сортировать периоды если они указаны в перемешку. Current peri

Готовая торговая система " Mr. Scalp " показывает трейдеру уже готовые сигналы, когда нужно открывать сделки на продажу или покупку. Система показывает когда нужно открывать ордер и в каком направлении. Работает на всех валютных парах и всех таймфреймах. Визуально этот индикатор показывает красными и синими точками на графике моменты, когда рынок с большой вероятностью будет разворачиваться для движения в противиположенном направлении. Также система показывает с помощью линий канала текущее нап

Знаете ли вы спрэды по которым открываются / будут открываться ваши сделки.
Как хорошо вы знаете о спрэдах по которым открываются / будут открываться ваши сделки.
Главная задача индикатора. Помочь пользователю / трейдеру, изучить спрэды в торговом терминале.
Получить информацию о минимальном и максимальном спрэде на каждой свече, от М1 и выше.
Эта информация поможет в следующих случаях:
- Максимальный спрэд торгового EA
--- Если ваш брокер имеет меньшие спрэды или средне статистически выше и

This indicator will help you identify the key zones needed for The Silver Bullet Strategy which are: The three time-windows the ICT mentioned in the strategy Window 1: 3 AM and 4 AM New York time Window 2: 10 AM and 11 AM New York Time Window 3: 2 PM to 3 PM New York Time Bullish and bearish supply and demand zones which will help you identify FVG inside those time windows T he previous day's high and low, draw on liquidity The indicator does not plot the FVGs to avoid cluttering the chart Exi

Smart Currency Strength is a powerful yet simple indicator that measures the strength of individual currencies.
It features a graphic panel that lists the main currencies and their strength in each timeframe, ranging from 0 (most oversold) to 100 (most overbought). The strength for all currencies in the current timeframe is also shown in a separate window as a multi-line graph, where each currency is represented with a different color, this allows you to monitor the evolution of strength tre

"Scalping and dethatching" - сигнальный форекс индикатор для скальпинга, который показывает визуально на графике направление текущего тренда. Данный индикатор позволяет за 3 секунды после добавления на график определить направление текущего тренда с точностью до 90%. Универсальность индикатора заключается в том, что он работает на всех валютных парах. Все валютные пары подчиняются одним и тем же фундаментальным законам рынка, по этому индикатор "Scalping and dethatching" работает на всех валютны

С помощью алгоритма форекс индикатора Fine Market, вы можете достаточно быстро понять, какая именно тенденция в данный момент развивается на рынке. Fine Market это комбинированный индикатор на основе нескольких инструментов. В основе Fine Market лежат классические базовые технические индикаторы - МА, RSI, MACD, Полосы Боллинджера, стохастик. Трейдеру нет необходимости накладывать на графики Форекс несколько линий и настраивать каждый индикатор в отдельности. Fine Market уже удачно скомбинирован
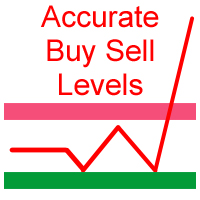
Accurate Buy sell Levels are the fully automated and purely work's on the basis of the Daily Opening weekly Opening and the Monthly Opening Prices. we don't want to do any analysis and other planning for Intraday or Swing we need to focus only when price approaches near the levels we can add other price action confluence's (Inside Bar's , Bullish / Bearish Engulfing pattern's , SND , Order Blocks ... and so on ) for strong Buy or Sell Confirmation's. Very simple and Easy to Follow system. We c

This indicator gives you the Moving Average based on Renko chart. A Renko chart is a type of chart that is built using price movement rather than both price and standardized time intervals like most charts are. A Moving Average based on Renko chart is considered less noisy since it is not based on the time and only based on price change. You can see my free enhanced Renko indicator here .
Inputs: Box Size: Renko box size based on market Points.
Period: Moving Average Period
Method: Moving

Этот индикатор отлично подходит для торгов на паре и еще много остальных. Сам индикатор использует математические стратегии дополненной точности, но пока они оптимизированы под некоторые валютные пары. Множество настроек можно настраивать на рабочей панеле .Имееться две панели на графике, для визуализации и настроек. Свое решение он отображает на графике в ввиде значков. Значки бывают только двух видов.В тестере работает отлично по умолчанию в настройках. Вторая панель для подсчета результатов

Индикатор, позволяет быстро определять места ценовых разворотов Своевременно реагирует на ценовые импульсы и показывает начало разворота цены Гистограмма показывает направленность движения и указывает на благоприятные моменты для открытия позиций. Рекомендован к использованию при свинг трейдинге Можно использовать на любых валютных парах, металлах и криптовалюте Подходит для работы с бинарными опционами
Отличительные особенности Быстро определяет изменение локального тренда; Работает на всех та

Fast Scalping это новый продукт, который позволяет идентифицировать текущую рыночную фазу (восходящий тренд, нисходящий тренд или флет). Представляет собой типичную стратегию инвесторов, которая обычно указывает на изменение тренда от медвежьего к бычьему. Инструмент, который позволяет определить направление и силу тренда. В отличие от большинства индикаторов Fast Scalping находит более длительные тренды и дает меньше ложных сигналов.
Данный индикатор отображает стрелки разных цветов в зависим

Title: Best Reversal Indicator - A Custom MQL4 Indicator for Trend Reversals Description: The "Best Reversal Indicator" is a custom MetaQuotes Language 4 (MQL4) indicator designed to identify potential trend reversals in financial markets. This indicator is intended to be used on MetaTrader 4 (MT4) trading platforms. Key Features: Non Repaint: Best Reversal Indicator is a non repaint indicator means It does not remove its signal after moving forward. Trend Reversal Detection: The indicator scan

The Game-Changing Engulfing Candle Hunter - Your Guide to Profitable Trend Trading
Step into the realm of trading possibilities with our revolutionary product - The Engulfing Hunter. Designed by traders for traders, this dynamic indicator combines the potency of engulfing candlestick patterns and the versatility of proprietary trend detection system, offering a trading edge unlike any other. Engulfing candlestick patterns have always been a revered tool in the arsenal of seasoned traders. Acting
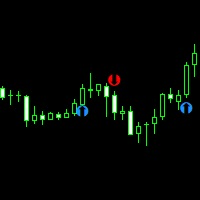
**Features:**
1. **Innovative Trend Tracking:** The UT BOT Simple Indicator leverages the power of the Average True Range (ATR), a renowned volatility measure, to calculate precise trailing stop values, providing unparalleled insights into market trends.
2. **Customizable Settings:** Flexibility is paramount in any trading strategy. With this in mind, our indicator allows you to adjust the ATR periods and other key parameters to tailor the tool to your trading style and strategy.
3. **Real-t

Introducing the Kangaroo Hunter - Your Ultimate Edge in Forex Trading ATTENTION Forex Traders! Are you in constant pursuit of high-probability trade setups? Or maybe you're a novice trader struggling to pinpoint precise entry and exit points? Our solution, the Kangaroo Hunter, is about to revolutionize your trading journey. This meticulously designed indicator simplifies and refines the art of identifying the often elusive Kangaroo Tail patterns in the Forex market, pushing your trading strateg
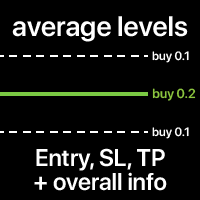
Средние уровни входа, SL и TP для всех сделок по символу Уровни могут быть рассчитаны вместе или отдельно для покупок и продаж. Вы можете опционально отображать дополнительную информацию: цена уровня, общий объем лота, плавающая прибыль/убыток. Стили и цвета уровней настраиваемы. Многофункциональная утилита : содержит более 66 функций | Свяжитесь со мной если у вас есть вопросы | Версия для MT5 В настройках индикатора можно настроить: Средний уровень входа: вкл/выкл; Средний уровень SL:

Этот индикатор использует несколько индикаторов для создания прибыльных сигнальных сделок.
Улучшенные оповещения и сигналы в V3
Live Testing
Индикатор TrendArrowsAlerts для Metatrader 4 — это полная торговая система FX, которая печатает на графике точные стрелки покупки и продажи.
Индикатор отображается в главном окне графика MT4 в виде зеленых и красных стрелок.
Использование сигналов, генерируемых одним индикатором, может быть рискованным при торговле. Это связано с тем, что использован

The Strong Volume Trend MT4 indicator is a powerful tool designed to help traders identify and capitalize on significant volume trends in the financial markets. With its advanced algorithm, this indicator accurately detects the strength and direction of volume movements, allowing traders to make informed trading decisions. Features: Volume Strength Analysis: The indicator analyzes the volume data and identifies strong volume trends, helping traders spot potential market reversals, breakouts, or

Introducing the "Amusing Entry Arrows" signal indicator, a powerful tool designed to enhance your trading experience on the H1 chart. With its advanced features and customizable arrow settings, this indicator provides valuable insights and timely alerts to help you make informed trading decisions. Key Features: H1 Chart Compatibility: The "Amusing Entry Arrows" indicator is specifically designed to operate on the H1 timeframe, allowing you to analyze price movements effectively within this timef

Визуализация торгового объёма, распределённого по ценовым уровням. Вы можете установить любой период для расчётов: между двумя вертикальными линиями или задать фиксированный временной интервал. Уровни гистограммы относительны: более широкая полоса означает больший объём торгов. Экстремумы распределения могут использоваться как уровни поддержки и сопротивления.
Все стили, размеры и цвета настраиваемы. Многофункциональная утилита : содержит более 66 функций | Свяжитесь со мной если у вас ест

Candle Binary Scalper - продукт технического анализа для форекс и бинарных опционов. Включает в себя нескольно технических индикаторов объединенных в торговую систему.
Подходит для ручной торговли внутри тренда, для скальпинга и бинарных опционов. Работает на всех тайм-фреймах и торговых инструментах. Рекомендуемые Тайм-фреймы для торговли M15, M30, H1 и H4, M5 и M1 использовать при высокой волатильности. Имеется несколько типов оповещений.
Как использовать продукт
Оптимальные настройки уже по

Trusty Super Signal Indicator
The Trusty Super Signal Indicator is a powerful technical analysis tool designed to assist traders in making informed trading decisions in the financial markets. With its advanced algorithm and user-friendly interface, this indicator provides accurate and timely signals to help identify potential trading opportunities.
Features: 1. Reliable Signal Generation: The Trusty Super Signal Indicator uses a sophisticated algorithm to generate high-quality trading signal

Meet the Tweezer Hunter, an essential tool for every Forex trader looking to make accurate, trend-following trades. This powerful, intuitive indicator helps traders spot potential trend reversals before they happen, providing a significant advantage in the fast-paced world of Forex trading. The Tweezer Hunter is more than your average tweezer candle indicator; it's designed with a built-in trend identification feature that accurately detects whether the market is bearish or bullish. By integrat

Candle confirmer is the indicator you need when you're waiting for the last candle to confirm to make an excellent order, this indicator will alert you if the current candle has had a higher or lower price compared to the previous candle. Stop trying to guess and start focusing on what really matters. You can activate or deactivate the alerts, chose the time-frame and even change the size, color and position of the indicator. Don't forget to leave your review and comments, it helps us improve

Не секрет, что движения валютных пар определённую часть времени происходят в некотором ценовом коридоре, который называют каналом. Нижнюю границу считают уровнем поддержки, верхнюю – сопротивления. Не путайте с горизонтальными уровнями поддержки и сопротивления! Расстояние между уровнем поддержки и сопротивления канала называют диапазоном или шириной канала. Ключевое отличие индикатора Channel Mirosh от других канальных индикаторов (например, от того же Боллинджера) состоит в том, что Channel M
MetaTrader Маркет - лучшее место для продажи торговых роботов и технических индикаторов.
Вам необходимо только написать востребованную программу для платформы MetaTrader, красиво оформить и добавить хорошее описание. Мы поможем вам опубликовать продукт в сервисе Маркет, где его могут купить миллионы пользователей MetaTrader. Так что занимайтесь только непосредственно своим делом - пишите программы для автотрейдинга.
Вы упускаете торговые возможности:
- Бесплатные приложения для трейдинга
- 8 000+ сигналов для копирования
- Экономические новости для анализа финансовых рынков
Регистрация
Вход
Если у вас нет учетной записи, зарегистрируйтесь
Для авторизации и пользования сайтом MQL5.com необходимо разрешить использование файлов Сookie.
Пожалуйста, включите в вашем браузере данную настройку, иначе вы не сможете авторизоваться.