Смотри обучающее видео по маркету на YouTube
Как купить торгового робота или индикатор
Запусти робота на
виртуальном хостинге
виртуальном хостинге
Протестируй индикатор/робота перед покупкой
Хочешь зарабатывать в Маркете?
Как подать продукт, чтобы его покупали
Бесплатные технические индикаторы для MetaTrader 4 - 16

Представленный индикатор позволяет определить точки потенциального входа в рынок и установить защитные приказы на обоснованных уровнях. Данный продукт может быть полезен как новичкам так и опытным трейдерам. Индикатор основан на методах расчета проверенных временем и практикующими трейдерами.
Индикатор рассчитывается в два этапа: На первом этапе определяется линейная регрессия (LR) выбранного типа цены за заданное количество периодов графика. На втором этапе полученные данные обрабатываются ме
FREE

Индикатор Candle GAP является важным инструментом для трейдеров, использующих стратегии Gap Trading , поскольку он автоматически определяет свечные разрывы для каждого дня недели. Гэп относится к разнице ценовых уровней между закрытием и открытием двух последовательных дней. Этот индикатор распознает четыре типа гэп-паттернов: обычный, прорыв, продолжение и истощение. Включив этот индикатор в любой график, трейдеры могут проверять свои сигналы и улучшать свои торговые решения. Одной из
FREE

Necessary for traders: tools and indicators Waves automatically calculate indicators, channel trend trading Perfect trend-wave automatic calculation channel calculation , MT4 Perfect trend-wave automatic calculation channel calculation , MT5 Local Trading copying Easy And Fast Copy , MT4 Easy And Fast Copy , MT5 Local Trading copying For DEMO Easy And Fast Copy , MT4 DEMO Easy And Fast Copy , MT5 DEMO Fibo: from KTrade 1. Automatically calculate and analyze the band. -> Get the desired band 2.
FREE

Targets is an indicator to determine potential turning points , targets are calculated to determine levels in which the sentiment of the market could change from "bullish" to "bearish." This indicator can be used in any timeframe and any currency pair: IN CASE YOU DON'T SEE THE INDICATOR WHEN YOU ADD IT TO YOUR CHARTS JUST OPEN THE INDICATOR MENU AND CLOSE THE MENU AGAIN PLEASE TAKE NOTICE: For best results use this indicator as an extra tools after you have completed your regular analysis an
FREE
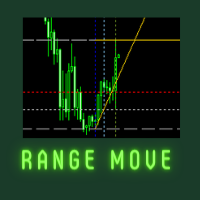
Welcome to Range Move Indicator page This indicator is suitable for Multitime frame and working with any pair including gold and silver pattern also. Very simple and profitable indicator forever. Buy open: when the candle break above the break line 100% sure buy call has open and buy tp line formed in yellow color. Sell open: when the candle break below the break line 100% sure sell call has open and sell tp line formed in yellow color.
FREE
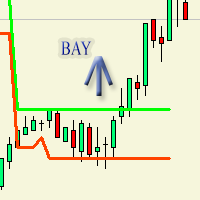
Индикатор изначально предназначался для торгового робота который в дальнейшем опубликуется. Рисует на графике флет. То-есть покой тренда. Очень отчетливо выражает флет по параметрам по умолчанию. flateWigth - допустимая ширина или разница между барами по которому индикатор будет засчитывать флет. Индикатор работает в реальном времени. Для наглядного просмотра работы можно запустить в тестере.
FREE

Welcome to the world of trading and technical analysis. In today's fast-paced markets, understanding market sentiment and identifying potential entry and exit points is crucial for
successful trading.
One essential tool in a trader's arsenal is the Relative Strength Index, or RSI. And now, we introduce the Free RSI Heat Map, a powerful visualization tool that brings RSI data to life.
RSI Heat Map offers a comprehensive overview of the RSI values across multiple instruments, allowing trade
FREE
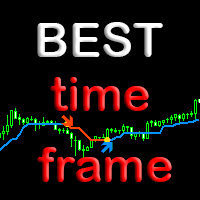
Индикатор BestTF поможет быстро выбрать самый лучший для торговли таймфрейм валютной пары или криптовалюты. Индикатор BestTF рассчитает и покажет в таблице крутизну графика (волатильность) для всех существующих таймфреймов текущего торгового инструмента. Почему важно правильно выбрать таймфрейм
Выбор таймфрейма является ключевым аспектом при торговле на валютном рынке по нескольким причинам:
Торговые стратегии: Различные торговые стратегии эффективны на разных таймфреймах. Например, краткоср
FREE
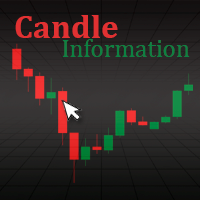
Tool for candle information. It allows to show the user information related to the candle when hovering the mouse over it. It has a simple interface. The user can modify its style by changing the colors in the input parameters.
Show data like: Candle date and time Open price of candle Close price of candle Highest candle price Lowest candle price Candle volume
FREE

Search for an entry with low risk for trading by Lisek Waves Indicator. Using Lisek Waves Indicator can improve your trading performance. In it’s simplest form, this trading tool make it easy to s earch for an entry with low risk and to manage your trade and risk. Lisek Wave analysis is based on the notion that markets follow specific patterns called waves which are the result of a natural rhythm of crowd psychology that exists in all markets. You can avoid the loss from taking trades that are
FREE

Вы бы хотели мгновенно узнавать, какой сейчас тренд? Как насчет качества этого тренда? Поиск тренда на графике может быть субъективным. Индикатор Fractal Trend Finder анализирует график и определяет текущий тренд на основе объективных критериев. При помощи Fractal Trend Finder вы сможете легко понять, торгуете ли вы по тренду или против него. Он также обозначает время, когда на рынке отсутствует тренд. Теоретически, вы можете торговать по тренду при наличии сильного тренда, и торговать против тр
FREE

(Перевод с Google)
смысл Индикатор SuPrEs указывает расстояние до следующей горизонтальной линии, имя которой начинается с настроенного префикса (см. Параметры).
использование Нарисуйте сопротивления и опоры на графике и позвольте индикатору предупредить вас, как только настроенное расстояние окажется ниже. Используйте префикс для предоставления линий сигнализации для других линий, а также для стандартных линий (см. Скриншот с индикатором поворота).
Отображение индикатора Индикатор отображ
FREE

Я создал этот простой индикатор, когда изучал TheStrat Роба Смита, и он оказался настолько полезным, что я решил поделиться им с вами. Если вы сочтете это полезным, посмотрите другие индикаторы, которые я опубликовал на MQL5. Индикатор просто рисует на графике одну линию, показывающую выбранный вами уровень цены на более высоком таймфрейме. Используя настройки, вы имеете полный контроль над отображаемым таймфреймом, но по умолчанию он сам рассчитывает более высокий таймфрейм, просто перемещаяс
FREE

Описание индикатора. Индикатор « Alligator Analysis » ( AA ) строит разные по типам усреднения и по масштабам « Аллигаторы» и их комбинации, что позволяет тонко анализировать состояния рынка. Классический « Аллигатор» Билла Уильямса строится на основе скользящих средних и чисел Фибоначчи , что делает его одним из самых лучших индикаторов. Классический « Аллигатор» представляет собой комбинацию из трех сглаженных скользящих средних SМMA (примененных к цене Median price = ( high
FREE
This Dashboard is free to download but is dependent on you owning the Flag Trend Pro MT4 indicator. Down load the indicator: Flag Trend Pro
The Dashboard will show you on a single chart all the timeframes (M1 to Monthly) with their own status for the indicator: Gold Pro MT4
all time frame and all symbol: smart algorithm detects the trend, filters out market noise and gives entry signals!!!
How to understand the status: symbol - Fill All the Pair what you want. M1, M5, M1
FREE

Trendy Stock is a price following indicator that uses Stochastic to show when the price is out of the oversold or overbought areas. The algorithm allows you to stay longer in a trend where the bulls or bears are in control. The indicator changes color immediately the price exits oversold/overbought state. In short, the downtrend [red] bars start to paint when the buying pressure decreases while the uptrend [green] bars form as the buy pressure kicks in. For MT5 version, follow :: https://w
FREE

The Price Volume Trend Oscillator (PVTO) is a powerful technical analysis tool designed to provide insights into the relationship between price movements and trading volumes. This indicator offers a unique perspective on market trends, helping traders identify potential buying and selling opportunities. Parameters: EMA Short Period: Defines the short EMA period for calculating the PVTO. Default 3 EMA Long Period: Specifies the long EMA period for PVTO calculation. Default 10 EMA Signal Period: S
FREE

QuantumAlert CCI Navigator is a free indicator available for MT4/MT5 platforms, its work is to provide "alerts" when the market is inside "overbought and oversold" regions in the form of "buy or sell" signals. This indicator comes with many customization options mentioned in the parameter section below, user can customise these parameters as needful. Join our MQL5 group , where we share important news and updates. You are also welcome to join our private channel as well, contact me for the pri
FREE

Sends price alerts conveniently to your Android/IOS device. Make sure push notifications are enabled in Metatrader settings and the PC/VPS is online 24/7. Price levels are updated automatically, but you can modify them in global variables, if needed. Suitable for any market instrument, but if notifications are too frequent, increase point value of the indicator parameter.
FREE

This indicator resolves an unrecognised defect in the Commodity Channel Index Oscillator (CCI). The CCI is based on a high pass filter calculated by subtracting the p-period simple moving average of a price signal (usually typical value) from the price signal itself. Then, the result is divided by the absolute mean deviation of the same period. The frequency response of a signal minus its simple moving average is shown in the first screen shot (in Blue). (see my free indicator : Q n D Frequency
FREE

IceFX TickInfo - это уникальный индикатор для тиковых графиков для платформы MetaTrader 4. Индикатор графически отображает последние 100 тиков, а также дополнительно показывает текущий спред, цены bid/ask и значение времени на элегантной панели IceFX. Индикатор является эффективным инструментом для трейдеров, торгующих на таймфрейме M5 или даже M1.
Параметры индикатора: Corner - угол привязки панели; CornerXOffset - отступ от угла по горизонтали; CornerYOffset - отступ от угла по вертикали; Ch
FREE

*This is tradingview indicator converted to mql4*
The CM Slingshot System Indicator is a trading tool that aims to identify potential trade setups based on market volatility and price action. It is designed to help traders spot entry and exit points in trending markets. The CM Slingshot System Indicator combines multiple indicators and techniques to generate trading signals. Here are the key features and components of the indicator: Bollinger Bands: The indicator incorporates Bollinger Bands,
FREE

Модифицированный Parabolic SAR : Ваш надежный помощник на рынке Эта улучшенная версия индикатора Параболический Сар отлично отображает направление тренда и может стать прекрасным дополнением к вашей торговой стратегии. Преимущества: Отражение направления тренда: Индикатор хорошо показывает направление тренда на рынке, помогая вам принимать осознанные торговые решения. Фильтрация сигналов: Это может быть отличным фильтром, который дополнит вашу стратегию, помогая исключить ложные сигналы и сдел
FREE

Property of Vertical Capital Edition: Gugol_Quants About USA INDEXES QUANT_INDICATOR: This is a indicator created by math modulation to be used as a trading tool, which was developed in MQL. (MT4) This indicator is for use only with US500(S&P500), NAS100(Nasdaq Composite) and US30(Dow Jones). Signals are activated on "Open" Candle. It’s based on Intraday/Swing Trades whose main timeframe is H1, H2, H3 and H4. However you can use it with other assets by testing with the appropriate settings. *
FREE

We Trade Live Trend Candle Stick can help identify potential trend in the market when trading, spot market trends and predict future prices. We Trade Live Trend Candle Stick has a smoother look, as it is essentially taking an average of the movement. candles will stay RED during a downtrend and Green during an uptrend . We believe It's useful for making candlestick charts more readable and trends easier to analyse. As a breakout trader you are looking for trades that are ‘breaking out’ of
FREE

Version History Date Version Changes 07/08/2022 1.00 Initial Release Description The Aroon indicator is a technical indicator that is used to identify trend changes in the price of an asset, as well as the strength of that trend. In essence, the indicator measures the time between highs and the time between lows over a time period. The idea is that strong uptrends will regularly see new highs, and strong downtrends will regularly see new lows. The indicator signals when this is happening, and
FREE
LEADING AND LAGGING INDICATORS DASHBOARD https://www.mql5.com/en/users/earobotkk/seller#products P/S: If you like this indicator, please rate it with 5 stars in the review section, this will increase its popularity so that other users will be benefited from using it.
This dashboard scans all time frames(M1,M5,M15,M30,H1,H4,D1,W1,MN1) and shows up trend and down trend for MACD, PSAR, RSI, STOCHASTIC, MOVING AVERAGE, BOLLINGER BANDS by changing the colours of the relevant boxes. It also shows c
FREE

FREE FOR A LIMITED TIME ONLY!!! The Ultimate Indicator For Trading Trend This indicator clearly shows you the strength of the market in one direction or the other, which means that you can trade knowing you are either with or against the market. When used in conjunction with the +3R principles you are sure to have some serious results. The +3R Principles Routine - This is when you trade and how often Rules - This is the rule you follow Risk:Reward - This is the percentage amount of your accoun
FREE

Based on the trend-following principle of CCI, it has been improved to become an indicator that can identify the reversal of the trend and its development direction, that is, it can identify the top and bottom attenuation of the oscillating trend in the trend market. feature The red and green columns represent the trend of bullish or bearish development under the current cycle. The blue line shows the position and attenuation of the current price trend in the current cycle. The upper and lower r
FREE
The product helps to find the highest peak and the lowest low. Help investors optimize profits. With a win rate of up to 80%. You do not need to adjust any parameters. We have optimized the best product. Your job just need to see and trade. Products with technological breakthroughs. Contact other products: https://www.mql5.com/en/users/hncnguyen/news.
FREE

The Awesome ATR Indicator is a technical analysis tool developed for the MetaTrader 4 (MT4) platform. This indicator is designed to assist traders in determining stop loss and take profit levels based on the average value of the Average True Range (ATR). By leveraging the market volatility data provided by ATR, this indicator offers more accurate and dynamic guidance in setting these crucial trading levels. Key Features: Dynamic Stop Loss Determination: Calculates stop loss levels based on the A
FREE

We stopped creatin small tools for MT4. Our focus are on MT5. Only very useful tools maybe we will develop to MT5. New Candle Alert is a simple indicator that notify you when a new candle is formed.
You can modify the notification message that will appear for you. The alarm sound is default by meta trader program.
MT5 version: https://www.mql5.com/pt/market/product/37986
Hope you enjoy it. Any doubt or suggestions please notify on private or by comments.
See ya.
FREE

Donchian通道(唐奇安通道指标)是用于交易突破的最古老、最简单的技术指标之一。 一般来说,唐奇安通道的宽度越宽,市场波动就越大,而唐奇安通道越窄,市场波动性也就越小 。此外,价格走势可以穿过布林带,但你看不到唐奇安通道的这种特征,因为其波段正在测量特定时期的最高价和最低价。 交易实用必备工具指标 波浪自动计算指标,通道趋势交易 完美的趋势-波浪自动计算通道计算 , MT4版本 完美的趋势-波浪自动计算通道计算 , MT5版本 本地跟单复制交易 Easy And Fast Copy , MT4版本 Easy And Fast Copy , MT5版本 本地跟单复制交易 模拟试用 Easy And Fast Copy , MT4 模拟账号运行 Easy And Fast Copy , MT5 模拟账号运行 唐奇安通道指标计算: 唐奇安上阻力线 - 由过去N天的当日最高价的最大值形成。 唐奇安下支撑线 - 由过去N天的当日最低价的最小值形成。 中心线 - (上线 + 下线)/ 2 唐奇安通道信号 唐奇安通道常用作突破指标。它提供了两种主要类型的突破信号,一个是上阻力线或下支撑线
FREE

This indicator graphically displays profit ($),risk/reward and % of risk according SL&TP Open orders on Current Symbol. when you open orders on current symbol and set StoplLoss and TakeProfit this indicator automatically calculate Risk/Reward and calculate %risk Of Equity Account that your order get stop Loss. If you trade on several symbols at the same time, you can install the indicator on each one separately and see the relevant calculations on each one.
FREE
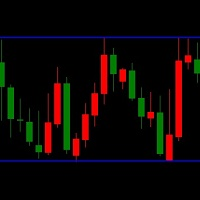
LT Triple Support Resistance Screen Method is a kind of levels indicator that consist of three SR lines. It is built by MQL4 programming language and can be used to MT4 platform. A free version indicator to determine the support and resistance levels easily This indicator works based on the screen method to calculate the most appropriate value for each buffer. A complex algorithm based on long research is applied to this free custom indicator. But this indicator has limited features and simpler
FREE

Precision Pivot Points Yuri Congia Description: Precision Pivot Points is a sophisticated indicator designed to identify potential market reversal points with accuracy and precision. Utilizing advanced algorithms, this indicator automatically calculates key support and resistance levels based on pivot point analysis. Pivot points are essential tools used by traders worldwide to make informed trading decisions and optimize their trading strategies. Join me in the exciting world of financial trad
FREE

this indicator Construction on Gann angles and it,s very effective .you can use it as (Support and resistance)
it,s very successful and easy to use.if candle Cross through level thats mean price is going ti next level
but with on condition. The price cames from a previous level
There is a variable of angles for frames the best is 1h frame and stander variable.........
FREE

green up = buy red down = sell with alerts! that's how easy it is. --this indicator follows trend --based on moving averages and rsi and macd and pivot points --good for scalping and intraday trading and daytrading --works for swing --recommended time frame is 15m or 5m contact me after purchase to receive a trading strategy with the indicator with another bonus indicator!
FREE
Данный индикатор представляет собой скользящую среднюю построенную по методу предложенному Alan Hull. Индикатор входит в серию индикаторов - Hull Line AM, Hull Momentum AM, Hull Candles AM, Hull Signal AM . Индикатор имеет минимальное запаздывание и позволяет эффективно следовать за направлением тренда. На полностью сформированных барах индикатор не перерисовывается. Индикатор дополнен сигналами и уведомлениями на терминал и электронную почту.
Применение индикатора идентично применению станда
FREE

Triple Exponential Moving Average Technical Indicator (TEMA) was developed by Patrick Mulloy and published in the "Technical Analysis of Stocks & Commodities" magazine. It works as the same as EMA. However, it provides smaller lags, even compared to Double EMA. Input Description: period: MA's period. Must be higher than 1. applied_price: Define the price to be applied. Use 1 of these integers. 0 -> applied_price is Close price 1 Open price 2 High price 3 Low price 4 Median price 5 Typical price
FREE
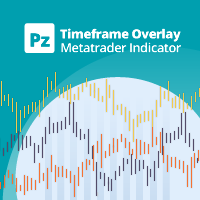
Индикатор Timeframe Overlay показывает ценовое действие (price action) на нескольких таймфреймах на одном графике, позволяя быстро оценить обстановку на разных таймфреймах. Больше не нужно переключаться между таймфреймами! До четырех таймфреймов на одном графике
Адаптируется к размеру графика, масштабу и таймфрейму Настраиваемый размер графика
Автоматический расчет ценового уровня Настраиваемая плотность ценового уровня
Настраиваемые цвета и размеры
Входные параметры
Symbol Settings - введ
FREE
This indicator uses a formula based on bollinger bands to determine if the market is in Range or not. It can be used to filter entries and not operate in a sideways market.
It has a minimum value of 0.2 from which it could be operated, although you can modify it in the options to adjust it to your trading style or the market you use.
If the histogram below is red, the market is in range, if it is green, volatility is higher.
FREE

Индикатор использует скользящее среднее для обнаружения трендов. Очень полезный инструмент для ручной торговли. Если линия окрашена цветом Midnight Blue (полуночно-синий), индикатор распознал растущий тренд. Если линия темно-фиолетовая (Dark Violet), индикатор распознал нисходящий тренд. Показатели индикатора очень понятны и просты в использовании. Лучше всего индикатор работает на таймфрейме H1. Индикатор можно использовать с дополнительной линией FollowLine для получения более точных сигналов.
FREE

LOOK AT THE FOLLOWING STRATEGY WITH THIS INDICATOR. Triple RSI is a tool that uses the classic Relative Strength Indicator, but in several timeframes to find market reversals. 1. ️ Idea behind the indicator and its strategy: In Trading, be it Forex or any other asset, the ideal is to keep it simple, the simpler the better . The triple RSI strategy is one of the simple strategies that seek market returns. In our experience, where there is more money to always be won, i
FREE

This indicator shows us the trend or direction of the market and a possible stop loss
This indicator works with two parameters, period and multiplier. Buy and sell signals are generated when the indicator crosses the closing price and it changes color.
This indicator is used in all types of markets such as stocks, futures, forex, cryptos, additionally it can be used in different time periods: hours, daily, weekly, etc.
It is recommended not to use it while the market is sideways, this can
FREE

This indicator helps you to scan symbols which are in the Market Watch window and filter out a trend according to RSI.
The relative strength index (RSI) is a technical indicator used in the analysis of financial markets. It is intended to chart the current and historical strength or weakness of a stock or market based on the closing prices of a recent trading period. The indicator should not be confused with relative strength. The RSI is classified as a momentum oscillator, measuring the veloc
FREE

Daily Weeky Info
it shows you Daily open and weekly open and daily trend open (ie) daily open > previous day open and weekly trend open (ie) weekly open > previous week open Day high low and weekly low high and previous week high and low it will help you to decide your trade no need to check higher timeframe when you trade intraday,
dont trade against the daily trend and daily open level
FREE

Индикатор для синхронизации и позиционировании графиков на одном и более терминалах одновременно. Выполняет ряд часто необходимых при анализе графиков функций: 1. Синхронизация графиков локально - в пределах одного терминала при прокрутке, изменении масштаба, переключении периодов графиков, все графики делают это одновременно. 2. Синхронизация графиков глобально - тоже самое, но на двух и более терминалах, как МТ4, так и МТ5. 3. Позиционирование графика на заданном месте при переключении периодо
FREE

Индикатор для Скальпинга на Рынке Форекс и Торговли Бинарными Опционами Этот индикатор разработан для скальпинга на рынке Форекс и торговли бинарными опционами. Сигнал появляется при открытии новой свечи. Рекомендации по применению: Для Бинарных Опционов : Рекомендуется открывать сделки при появлении сигнала на 1 свечу. Сигнал на покупку появляется, когда синий икс сменяет красный, а сигнал на продажу - когда красный икс сменяет синий, как показано на скриншотах. Для Рынка Форекс: Вход в сделку
FREE

FusionAlert StochRSI Master is an indicator available for MT4/MT5 platforms, it is a combination of RSI & Stochastic indicator which provide "alerts" when the market is inside "overbought and oversold" regions combined for both indicators, results in more precise and accurate signals to be used as a wonderful tool, in the form of "buy or sell" signals. This indicator comes with many customization options mentioned in the parameter section below, user can customise these parameters as needful. Jo
FREE

The M.O.D.E stands for " Multiple Oscillator Divergence Exit ". It is an indicator which signals a divergence between the price, and multiple oscillators. It is initially an exit indicator because it signals the weakening of a trend, but it could be used as an entry signal if used analytically Key Features: Check many divergences at once Non repainting Sends Alerts and Push Notifications You could load the M.O.D.E onto a single chart, and be able to see the divergences happening on multiple os
FREE

The "Trend Edges" indicator determines whether the trend is rising or falling. It is suitable for any time frame (tested on DAX).
The indicator should be treated like Bollinger Bands, meaning that if it breaks out upwards, you can buy with a stop loss below the lower edge.
Find a trending pair, index or CFD. Additionally :
-Sound alert on trend change.
-Alert Notification
-Alert Notification on your mobile phone Check my other indicator "Trend Edges histogram"
FREE
Moving average cross over notification !
How to use Add NotifyMaCross indicator into the chart. Set Moving average line one and two. Wait the notification when moving average cross over Support for development : https://www.buymeacoffee.com/itwetrade
Check out all indicator and expert advisor here https://www.mql5.com/en/users/thanksmybot/seller ------------------------------------- Como usar
Adicione o indicador NotifyMaCross ao gráfico.
Defina a linha média móvel um e dois.
FREE

Данный индикатор включает в себя различные виды скользящих средних. Индикатор содержит в себе следующий набор скользящих средних: CA (Кумулятивная скользящая средняя) MIN (Минимум за период) MAX (Максимум за период) SMA (Простая скользящая средняя) EMA (Экспоненциальные скользящее среднее) DMA (Двойное (двукратное) экспоненциальное скользящее среднее) TMA (Тройное (трёхкратное) экспоненциальное скользящее среднее) LWMA (Взвешенное скользящее среднее) SMM (Простая скользящая медиана) SMMA (Сглаже
FREE

После 7 лет я решил выпустить некоторые свои индикаторы и советники бесплатно.
Если вы находите их полезными, пожалуйста, поддержите меня пятизвёздочным рейтингом! Ваш отзыв помогает продолжать выпуск бесплатных инструментов! Также смотрите мои другие бесплатные инструменты здесь
_________________________________ Индикатор Среднего Объёма Движения (Volume MA) для Продвинутого Анализа Рынка Форекс Представляем индикатор Среднего Объёма Движения (Volume MA), разработанный с особы
FREE

T-Explorer – оптимизируемый в реальном времени инструмент для MetaTrader 4, предоставляющий данные для торговли на десяти наиболее популярных и надежных технических индикаторах на нескольких таймфреймах. Наши модели машинного обучения рассчитывают оптимальные переводы и настройки каждого индикатора для генерации надежных сигналов. Пользователи могут выбрать нужные таймфреймы и режим ( FAST, MEDIUM, SLOW ) для используемых индикаторов. T-Explorer объединяет и оптимально сочетает результаты всех и
FREE

Highly configurable CCI indicator. Features: Highly customizable alert functions (at levels, crosses, direction changes via email, push, sound, popup) Multi timeframe ability Color customization (at levels, crosses, direction changes) Linear interpolation and histogram mode options Works on strategy tester in multi timeframe mode (at weekend without ticks also) Adjustable Levels Parameters:
CCI Timeframe: You can set the current or a higher timeframes for CCI . CCI Bar Shift: you can se
FREE

This indicator identifies pinbar candlesticks on the chart and displays an arrow as a trade signal based on the candlestick pattern. It offers user-friendly features, including push notifications and other types of alerts. It is most effective for identifying entry points or potential reversals at premium or discount prices. Additionally, it works on any time frame.
FREE
Одним из стандартных способов определить направление движения цены в конкретный момент является расчет линейной регрессии для значений такой цены за определенный период времени. Данный индикатор отображает на графике цены линию построенную по значениям линейной регрессии выбранной цены за выбранный период времени.
Индикатор максимально прост и может использоваться в рамках любой стратегии торговли.
На полностью сформированных барах индикатор не перерисовывается.
Настройки: Ind_Period - Пер
FREE

Индикатор WindFlow HTF хорошо использовать в сочетании с другим моим индикатором WindFlow. Индикатор дает общее представление о тренде на более крупном таймфрейме. В сочетании с индикатором WindFlow представляет собой почти полное торговое решение. Необходим лишь анализ уровней поддержки/сопротивления и немного внимания.
"Танец ветра" Крупные и мелкие таймфреймы взаимосвязаны. Мы знаем, что сигналы на крупных таймфреймах обычно запаздывают по сравнению с сигналами на более мелких. Однако если
FREE
Highly configurable Rate of Change (ROC) indicator. Features: Highly customizable alert functions (at levels, crosses, direction changes via email, push, sound, popup) Multi timeframe ability Color customization (at levels, crosses, direction changes) Linear interpolation and histogram mode options Works on strategy tester in multi timeframe mode (at weekend without ticks also) Adjustable Levels Parameters:
ROC Timeframe: You can set the current or a higher timeframes for ROC. ROC Bar Shift:
FREE
Идет подготовка EA версии. Можете отправить личное сообщение "оповестите о EA версии". EA будет универсален с множеством настроек для торговли по различным индикаторам.
Новый EA позволит так же торговать по данному индикатору.
К примеру разрешая сигналы после Х сигналов/баров до Х сигналов/баров в одном направлении, до смены направления.
Если Break Out произошёл до/после сигнала другого индикатора.
Набирать прибыль на каждом следующем сигнале выше/ниже предыдущего. Отправьте личное
FREE

please leave 5 stars to me A support level is a level where the price tends to find support as it falls. This means that the price is more likely to "bounce" off this level rather than break through it. However, once the price has breached this level, by an amount exceeding some noise, it is likely to continue falling until meeting another support level. A resistance level is the opposite of a support level. It is where the price tends to find resistance as it rises. Again, this means t
FREE
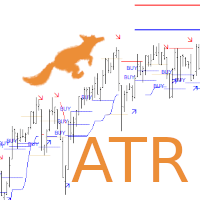
Are you looking for ATR Levels, ATR Trend, ATR Support and Resistance Indicators ? Now you have all in one !!! Info on your chart is showing you: where current price and levels are, what is current trend and signals. Search for an entry with low risk for trading by Lisek ATR Indicator. There are many ways to trade with Lisek ATR Indicator: Trade Support and Resistance Levels. Trade pullbacks (Range trading). Trade breakouts. Trade reversals. Take profit or set stop-loss based on ATR Levels.
FREE

Индикатор измеряет объемы на разных графиках и инструментах. Основным преимуществом этого индикатора является то, что вы можете сравнить отдельных брокеров. Чем меньше Middle Volume и Tick / Second, тем надежней этот брокер. В левом верхнем углу есть комментарий Пояснение комментария: Tick/Second — это количество тиков в секунду за выбранный инструмент Middle Volume — это средние объемы в предпоследнем баре С помощью этого индикатора вы можете отслеживать относительную активность рынка для разны
FREE

This automated AK Edge Scalping Indicator can be employed to oversee trades and identify optimal entry points for all time frames and both buying and selling when the price starts trending upwards or downwards. It is designed to recognize zones for Sell/Buy trades by utilizing the Moving Average and the MACD. Additionally, it incorporates the Average True Value to fine-tune the Stop Loss and the Take Profit. It can be effectively used in conjunction with other strategies to facilitate prompt en
FREE

Индикатор показывает на ценовом графике пересечение Accelerator Oscillator (AC) нулевого уровня в виде точек. В настройках индикатора можно указать количество баров на истории для отображения сигналов, а также сдвиг точек относительно бара. Параметры Bars — количество баров на истории для отображения сигналов индикатора; Shift — сдвиг точек относительно баров.
FREE

This indicator allows to hide Ichimoku Kinko Hyo (on all MT4 timeframes) from a date define by the user, with a vertical line (Alone) or a panel (with "Hidden Candles"). Indicator Inputs: Tenkan-sen Kijun-sen Senkou Span B Information on "Ichimoku Kinko Hyo" indicator is available here: https://www.metatrader4.com/en/trading-platform/help/analytics/tech_indicators/ichimoku ************************************************************* Hey traders!! Give me your feeds! We are a community here
FREE

Индикатор анализирует изменение минимальных и максимальных цен предыдущих баров фиксируя вход больших игроков. В случае роста изменения (дельты) на график выводится сигнал в виде стрелки. При этом осуществляется виртуальная торговля на истории. В бесплатной версии виртуальная торговля осуществляется без доливок в случае повторения сигнала. Результаты виртуальной торговли в виде потерь/убытков, прибыльности, просадки и линий сделок выводятся на график цены и в поле комментария.
Параметры Индика
FREE
Трендовый индикатор Strong and weak Pairs призван помочь вам в выборе пар для торговли, основываясь на оценках валют. Strong and weak Pairs сравнивает положение валют со скользящей средней для всех основных пар, а затем отображает оценки от нуля (0) до семи (7) при помощи двух линий на графике. 7 - самая сильная валюта, а 0 - самая слабая. Кроме того, имеется информационная панель, которая отображает все оценки валют для выбора пары для торговли. Индикатор Strong and Weak строит 2 линии для кажд
FREE
А знаете ли вы, почему MetaTrader Market - лучшее место для продажи торговых стратегий и технических индикаторов? Разработчику у нас не нужно тратить время и силы на рекламу, защиту программ и расчеты с покупателями. Всё это уже сделано.
Вы упускаете торговые возможности:
- Бесплатные приложения для трейдинга
- 8 000+ сигналов для копирования
- Экономические новости для анализа финансовых рынков
Регистрация
Вход
Если у вас нет учетной записи, зарегистрируйтесь
Для авторизации и пользования сайтом MQL5.com необходимо разрешить использование файлов Сookie.
Пожалуйста, включите в вашем браузере данную настройку, иначе вы не сможете авторизоваться.