Смотри обучающее видео по маркету на YouTube
Как купить торгового робота или индикатор
Запусти робота на
виртуальном хостинге
виртуальном хостинге
Протестируй индикатор/робота перед покупкой
Хочешь зарабатывать в Маркете?
Как подать продукт, чтобы его покупали
Бесплатные технические индикаторы для MetaTrader 4 - 5

Данный индикатор - это авторский взгляд на объемы. Как известно, объемы показывают количество продавцов и покупателей за определенный отрезок времени. Как отрезок времени используется свеча. Объемы по High свечи показывают покупателей. Объемы по Low свечи показывают продавцов. По Open свечи показывается Delta. Delta - показывает, кто преобладал на данной свече, покупатели или продавцы.
Входные параметры Distance - расстояние текста объемов от High и Low. Font size - размер шрифта текста. В инд
FREE
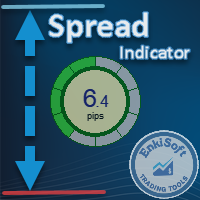
Custom Spread Indicator *Please write a review, thanks!
Also MT5 version is available
Spread Indicator show the current spread in pips with color codes. Handle 3 levels, Low, Medium, High. You can set levels and colors for each level (eg. Low: Green, Medium: Orange, High: Red), and can choose display position on the chart.
There is two spread calculation mode: -> Server spread value -> Ask - Bid value
Can set opacity, for better customization. When spread jump bigger, then display do
FREE

Индикатор профиля рынка, способный предоставить "рентгеновское видение" деятельности рынка, выделяющий наиболее важные ценовые уровни, области значений и контрольное значение дневной торговой сессии. Просто в понимании и использовании Понимает динамику рынка с легкостью Автоматический выбор таймфрейма Определяет зоны торгового значения и отбрасывает другие Полезен в любых рыночных условиях Эффективен для любой торговой стратегии Включает две цветовые схемы
Параметры Параметр "Sessions to count
FREE

Have you ever wanted to be able to catch a trend just as it is beginning? This indicator attempts to find the tops and bottoms of a trend. It uses in-built indicators and studies their reversal patterns. It cannot be used on its own it requires Stochastic(14) to confirm signal. Red for sell, Blue for buy. There are no parameters required just attach to a chart and it is ready to go. Check out other great products from https://www.mql5.com/en/users/augustinekamatu/seller A Winning Trading Stra
FREE

This indicator analyzes price action patterns and helps you to make positive equity decisions in the binary options market. [ Installation Guide | Update Guide | Troubleshooting | FAQ | All Products ] Easy to trade Trade both call and put options No crystal ball and no predictions The indicator is non-repainting The only strategy suitable for binary options is applying a mathematical approach, like professional gamblers do. It is based on the following principles: Every binary option represents
FREE

Устали от ручной установки уровней и расширений Фибоначчи? Индикатор самостоятельно рассчитывает уровни и расширения Фибоначчи из двух разных ценовых точек и автоматически отображает их. Прост в использовании Ручная привязка не требуется Идеально подходит для отслеживания пересечения с ценой Индикатор оценивает, нужны ли уровни или расширения После отображения привязку можно менять вручную Адаптриуется к размеру графика и масштабу: Уменьшите масштаб, чтобы получить общую картину Увеличьте масшта
FREE

This comprehensive technical indicator calculates and plots up to 3 moving averages with 3 different periods. By employing three moving averages of distinct lookback periods, the trader can confirm whether the market has indeed experienced a change in trend or whether it is merely pausing momentarily before resuming its prior state. SX Golden MA Pack for MT5 is available here . The shorter the moving average period, the more closely it tracks the price curve. When a security initiates an upt
FREE

**Introducing Supply Demand Zones Indicator for MT4**
Hello, esteemed traders in the financial markets! Today, we are pleased to introduce to you a powerful tool called the "Supply Demand Zones Indicator" - a valuable utility designed for the MetaTrader 4 (MT4) platform, aimed at helping you identify key supply and demand areas on your trading charts.
**Brief Introduction:** The Supply Demand Zones Indicator is a unique technical analysis tool that assists in pinpointing significant price l
FREE

This automated DOJI BAR FINDER INDICATOR can be utilized to manage trades and identify potential areas of support and resistance for both buying and selling. It is designed to identify zones for Sell/Buy trades and can be effectively used in conjunction with other indicators, such as order block indicators, and more. Currently designed for MT4, it will later be adapted to function on MT5. We also offer the opportunity to customize the robot according to your trading strategy. https://t.me/FXTSPr
FREE

Индикатор "BIG FIGURE INDICATOR" автоматически идентифицирует и рисует горизонтальные линии на графиках цен на определенных уровнях, таких как целые числа или половинные числа (например, 1,0000 или 1,5000 в валютной торговле). Эти уровни считаются психологически значимыми, поскольку они представляют собой округленные цифры, на которые могут сосредоточиться крупные трейдеры и инвесторы, что может привести к потенциальным уровням поддержки или сопротивления. Этот индикатор может помочь трейдерам
FREE

Метр точности Введение:
Accuracy Meter - это мощный инструмент для определения% выигрышных стратегий, чтобы показать вам все точки входа и выхода из сделок, такие как этот мета-тестер стратегий, вы можете иметь простой тестер стратегий в качестве индикатора на графике, прикрепить его к разным парам и таймфреймам и выяснить процент точности вашей стратегии, измените стоп-лосс и риск на коэффициент вознаграждения и посмотрите, как он может повлиять на вашу идею торговли Accuracy Meter - это ваш
FREE
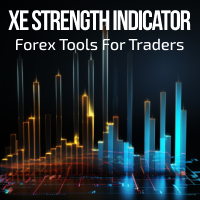
XE Forex Strengh Indicator MT4 displays visual information about direction and strength of a signal for current pair and chosen timeframes (M5, M15, M30 and H1). Calculations are based on multiple factors and results are shown as a colored panel with scale bar, numerical values and arrows. There are also displayed values of current price and spread on the pair. There can be activated an alert (as a mail or pop-up window with sound) for each available timeframes which send a message when the dir
FREE

This indicator identifies swing highs and swing lows in the price chart by comparing the Highs and lows of each candle to a specified number of candle before and after it. Once it has identified the swing highs and swing lows, it can use them to determine potential support and resistance levels. A support level is formed when the price drops and bounces back up from a swing low, indicating that there is buying pressure at that level. A resistance level is formed when the price rises and reve
FREE

Индикатор, отображающий время основных торговых рынков мира. Он также показывает текущую сессию. Очень прост в применении. Не занимает много места на графике. Можно использовать вместе с советниками и другими панелями, такими как VirtualTradePad . Версия с аналоговым отображением часов на графике. Дорогие друзья и пользователи наших советников, добавляйте Ваши оценки в разделе Отзывы Все обновления наших программ для форекс - бесплатны ! Это бесплатная торговая утилита! Другие характеристики
FREE
As every ZigZag Indicator this Indicator Repaints . So use this only combining with other indicators or strategy.
CyberZingFx ZigZag Arrow MT4 Indicator, is one of the best tool for traders looking to identify trend reversals in the markets. This powerful indicator uses the ZigZag method to help you identify key support and resistance levels, making it easier to spot significant changes in price and filter out short-term fluctuations. With CyberZingFx ZigZag Arrow, you can quickly and easi
FREE

ZigZag Fibo Retracement Indicator Optimize Your Trading Strategy! Are you seeking to optimize your trading strategy in the financial markets? Explore the unique features of the ZigZag Fibo Retracement Indicator, a powerful tool designed to help you identify potential support and resistance levels based on the combination of ZigZag patterns and Fibonacci ratios. Integration of ZigZag Patterns and Fibonacci: The ZigZag Fibo Retracement Indicator combines the effectiveness of ZigZag patterns, helpi
FREE

The Indicator show Daily Pivot Points. It is possible to specify the number of days to display. For forex it doesn't consider the sunday session data. It is possibile to modify the color, style and width for every level.It is better to use this indicator with timeframe not higher than Н1. 4 Levels of support and resistance with also Intermediate Levels that is possible to hide.
FREE

Индикатор ищет консолидацию(флэт) на рынке в определенное время, строит коробку-канал и отмечает уровни с отступом от него на пробой. После пересечения одного из уровней индикатор отмечает зону для тейкпрофита и считает соответствующий профит или убыток в направлении данного входа на панели. Таким образом, индикатор, подстраиваясь под рынок, находит флэтовый участок с началом трендового движения для входа в него. Версия для МТ5: https://www.mql5.com/ru/market/product/58380
Преимущества:
уник
FREE

Necessary for traders: tools and indicators Waves automatically calculate indicators, channel trend trading Perfect trend-wave automatic calculation channel calculation , MT4 Perfect trend-wave automatic calculation channel calculation , MT5 Local Trading copying Easy And Fast Copy , MT4 Easy And Fast Copy , MT5 Local Trading copying For DEMO Easy And Fast Copy , MT4 DEMO Easy And Fast Copy , MT5 DEMO Расширенные полосы Боллинджера:
1. Рельс Боллинджера изменит цвет в зависимости от направлен
FREE

What is Ikoku Kairi Band?
It is an oscillator indicator that combines Kairi Relative Index with Bollinger Band and displays signals with possible position entry points. It is meant to be used to trade against the trend, so it is perfect for scalping in a range market. It shouldn’t be used in a trend market. It will display arrow signals at possible entry points for buy and sell position. You can be notified when they appear with, push, alert or email notifications. You can customise the indica
FREE
Highly configurable Macd indicator.
Features: Highly customizable alert functions (at levels, crosses, direction changes via email, push, sound, popup) Multi timeframe ability Color customization (at levels, crosses, direction changes) Linear interpolation and histogram mode options Works on strategy tester in multi timeframe mode (at weekend without ticks also) Adjustable Levels Parameters:
Macd Timeframe: You can set the lower/higher timeframes for Macd. Macd Bar Shift: you can set the
FREE

Double top and bottom indicator is a pattern scanning indicator which scans the tops and bottoms using zig zag pattern. When it find price bouncing back from the same point twice after a long trend then it generate arrow signals whenever the last resistance points is broken for double bottom and last support price broken for double top. Unlike other top bottom scanner it does not give only 1 signal. it alerts user when ever the last support /resistance is broker from double top/bottom pattern un
FREE

Current indicator shows the trading sessions for the major financial centres: London New York Tokyo Sydney There are available two types of displaying zones: in sub window below the chart and on the chart. When the subwindow is selected, the sessions are shown in the form of bars. If the sessions are shown on the main chart, they are displayed in the form of lines at the open price of the session that may also act as a support and resistance for further price action during the trading day. The
FREE

Introduction This indicator detects volume spread patterns for buy and sell opportunity. The patterns include demand and supply patterns. You might use each pattern for trading. However, these patterns are best used to detect the demand zone (=accumulation area) and supply zone (=distribution area). Demand pattern indicates generally potential buying opportunity. Supply pattern indicates generally potential selling opportunity. These are the underlying patterns rather than direct price action. T
FREE

IceFX SpreadMonitor - специальный индикатор, фиксирующий значение спреда. Он показывает текущий, минимальный/максимальный и средний спред. Эти значения остаются видимыми даже после перезагрузки. Также SpreadMonitor может сохранять необходимые значения спреда в CSV файл для последующего анализа.
Параметры индикатора: SpreadLowLevel - низкий уровень спреда (зеленый цвет) SpreadHighLevel - высокий уровень спреда (красный цвет) BGColor - фон панели SpreadNormalColor - цвет при нормальном спреде Sp
FREE

Преимущество, которого вам не хватает, чтобы стать профессионалом. Следуйте за пошаговой системой, которая обнаруживает самые мощные движения!
Изучите рыночные модели, которые дают возможность получить значительную прибыль на основе проверенной и протестированной стратегии. Воспользуйтесь своим важным преимуществом У вас есть доступ к уникальному в своем роде индикатору, который выведет вас на новый уровень! Пишите по всем вопросам в личные сообщения! Преимущества, которые вы получаете Уникаль
FREE

This Dashboard is free to download but is dependent on you owning the Gold Pro MT4 indicator. Get the indicator here: https://www.mql5.com/en/market/product/60430
The Dashboard will show you on a single chart all the timeframes (M1 to Monthly) with their own status for the indicator: Gold Pro MT4
all time frame and all symbol: smart algorithm detects the trend, filters out market noise and gives entry signals!!!
How to understand the status: Dashboard Show "Buy" - Buy Signa
FREE

How the Indicator Works:
This is a Multi-timeframe MA multimeter indicator which studies if price is above or below a particular EMA range and shows Red/Green/Yellow signals. Red: Price Below EMA range Green: Price above range Yellow: Price within range
Indicator Properties:
EMA Settings: - Default Period is 200. You can change all MA Settings like Period, MA Method (SMA, EMA, etc) or MA Applied Price (Close, Open, etc).
- EMA Range list is a comma separated value list for different timefr
FREE

See RSI values turned into colored candles
This indicator provides both colored candles and a colored moving average. 6 drawaing styles are provided to allow customization of the color coding.
Applying coding to the chart may help in conceptualizing price trend and impulse movements defined through RSI values.
Features - optional colored candles - optional colored ma - 6 draw styles; RSI slope RSI above/below overbought/oversold levels RSI above/below level 50 RSI above/below it's moving aver
FREE

Вы торгуете по гармоническим паттернам? Паттерн "Три движения" (Three Drives) представляет собой шеститочечный паттерн разворота, состоящий из серии повышающихся максимумов или понижающихся минимумов, завершающейся на уровнях Фибоначчи 127% или 161.8%. Он сигнализирует о том, что движение слабеет и высока вероятность разворота. Паттерн легко обнаруживается Позволяет изучить основы гармонических паттернов Полезен при поиске дешевых и дорогих зон Бычьи откаты отображаются синим цветом Медвежьи отк
FREE
Эта программа сделает анализ нескольких таймфреймов более удобным.
Это поможет синхронизировать все графики на разных графиках синхронизации таймфреймов, чтобы отображать один и тот же символ, тот же определенный период времени и синхронизация объектов чертежа Показать на всех диаграммах одновременно
Поддержка синхронизации объектов: вертикальная/горизонтальная линия, линия тренда, прямоугольник, стрелка, коррекция Фибоначчи
Дополнительная функция: оповещение о линии тренда
Как им польз
FREE

Гармонические паттерны наилучшим образом используются для прогнозирования точек разворота рынка. Они обеспечивают высокую вероятность успешных сделок и множество возможностей для торговли в течение одного торгового дня. Наш индикатор идентифицирует наиболее популярные гармонические паттерны, основываясь на книгах о Гармоническом трейдинге. ВАЖНЫЕ ЗАМЕЧАНИЯ: Индикатор не перерисовывается, не отстает (он обнаруживает паттерн в точке D) и не изменяется (паттерн либо действителен, либо отменен). КАК
FREE

Recommended on M15 and higher timeframes
Sends alerts and notifications when the zone is create
Sends alerts and notifications if zones are retested
You will see the trading zones and identify the most profitable points to open positions. The indicator marks the supply and demand zones.
With this show you will now make profitable trades that will set the trends.
Shows all support and resistance zones.
Can work in all time zones.
No need to mess with complicated settings, all setti
FREE

Этот советник не совершает никаких сделок, но он сканирует все символы в ваших обзорах рынка и сканирует каждую акцию одну за другой в разных таймфреймах, и в конце он показывает вам, какой символ в каком таймфрейме имеет мощную поглощающую свечу. Кроме того, вы можете определить период MA и верхний и нижний пределы RSI, и он показывает вам, какие символы, на каком таймфрейме, будут пересекать скорректированную скользящую среднюю, и какой символ, на каком таймфрейме, будет пересекать верхний или
FREE
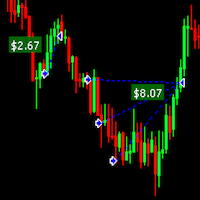
Draw Profit indicator can efficiently help those traders who want to see on the chart all closed positions output: profit or loss. If set DrawProfit on your chart managed by an Expert Advisor (EA) you will see clearly it’s performance by its profits & losses. My other products: https://www.mql5.com/en/users/hoangvudb/seller
Input parameters: Show Profit Labels : show profit of orders with a label (true/false). Profit Mode : available options: Show in currency. Show in pips. Show in currency
FREE

The MACD Signal Candle indicator changes color according to the MACD trends. Colored Candles, based on MACD.
HOW IT WORKS
For a Buy: -If the indicator is above zero, the market is bullish. -If the market is bullish, you can take a stand with green candle signals. For a Sell: -If the indicator is below zero, the market is bearish. -If the market is bearish, you can take a stand with the red candles.
FREE
Индикатор Macd 2 линии с торговыми стрелками.
Включает :
Сигнал MACD и линия MACD 2-цветная гистограмма 0 уровень возможные торговые стрелки Как читать :
Индикатор покажет вам стрелку после того, как произошло пересечение, и быстрая линия пройдет выше или ниже нулевой линии! Используйте надлежащее управление рисками и не торгуйте на новостях о высокой волатильности!
ПОСМОТРЕТЬ ДРУГИЕ ПРОДУКТЫ: https://www.mql5.com/en/users/gabedk/seller
FREE
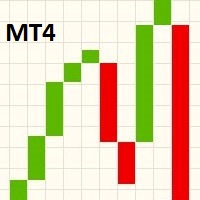
Данный индикатор отображает график линейного прорыва в главном окне графика. Чтобы посмотреть график линейного прорыва отдельно, переключите вид основного графика на показ в виде линии, а затем измените цвет линии на "None" (отсутствует) в свойствах графика, которые открываются нажатием клавиши F8. При скроллинге, увеличении/уменьшении масштаба или изменении символа/таймфрейма графика индикатор изменит размер блоков на следующем тике, чтобы они вписались в область просмотра основного графика. Гр
FREE

Индикатор определяет направление движения цены, обсчитывает по внутренней формуле возможность входа в рынок и отображает сигнал входа на пробой. Сигналы индикатора появляются как при начале трендовых движений, так и в обратном направлении, что позволяет максимально эффективно открывать и закрывать ордера в любом из состояний рынка. Версия для MT5: https://www.mql5.com/ru/market/product/58980 Преимущества: уникальная формула расчета сигнала; высокая точность сигнала; не перерисовывается, не запаз
FREE

The principle of this indicator is very simple: detecting the candlestick pattern in H1 timeframe, then monitoring the return point of graph by using the pullback of High-Low of H1 Candlestick and finally predicting BUY and SELL signal with arrows, alerts and notifications. The parameters are fixed and automatically calculated on each time frame. Example:
If you install indicator on XAUUSD, timeframe H1: the indicator will detect the reversal, pullback, price action on this timeframe (for exa
FREE

This is one of the most popular and highly rated volatility index (VIX) indicators on the market. It provides the same readings as the VIX does for stock indexes. However, this indicator works across all asset classes. VIX Fix Finds Market Bottoms. This indicator is not for inexperienced traders. Use it for day and swing trading. MT5 Version - https://www.mql5.com/en/market/product/112284
Bernard Baruch summed it out best: "Markets fluctuate." The Chicago Board Options Exchange (CBOE) Vola
FREE
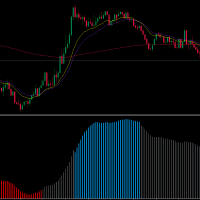
Welcome traders, MA SLOPE SCALPER is a really powerfoul tool to boost up your scalping! Have you been struggling with your scalping Strategies? Have you tried price action? Well, it does not work. Have you tried Rsi - Reversal Strategies? Well it'is not a clever idea. MA SLPOPE SCALPER IS A TREND FOLLOWER SYSTEM MA SLOPE SCALPER is based upon 3 different Exponential Moving averages that have bees studied and selected in order to maximize the precision of the signals! Ma SLOPE SCALPER has an
FREE

A combined indicator of two famous indicators: RSI , Bollinger Bands Can be used in all currency pairs Can be used in all time frames with many signals Very simple and fast to use
Description:
This indicator is made from the combination of RSI and Bollinger Bands indicators
As you can see, it shows good signals and is worth using and testing
We hope you are satisfied with this indicator
Settings: show past show candle: Displays the number of candles that the indicator calculates.
For
FREE

Gorilla Channel VZ – это канальный индикатор, доработанный на основе многолетних наблюдений . Сигнальный торговый индикатор можно использовать как в качестве индикатора, отображающего трендовый канал, так и в качестве одного из источника сигналов на вход, при условии дополнительной фильтрации. При должном подходе минимум 80% успешных сделок. Основные характеристики Gorilla Channel VZ : Аналитические функции Может использоваться на любых валютных парах и тайм-фреймах; Индикатор не пер
FREE

MP Candle Countdown indicator with a progress bar is a tool used in technical analysis that displays the time remaining until the current candlestick on a chart closes, along with a progress bar that shows visually the amount of time that has elapsed since the candlestick opened. This indicator can be helpful for traders who use candlestick charting to make trading decisions, as it provides both a visual representation of the time left until a candlestick closes and an indication of how much ti
FREE

This indicator is a simple trend line indicator.
The upper trend line is the highest price of 60 past candlesticks, the highest price of 30 past candlesticks,
The bottom line is the trend line that connects the lowest price of 60 past candlesticks and the lowest price of 30 past candlesticks.
*The color of the trend line is white.
Notes
This indicator is created with the above configuration, so if the highest and lowest prices of the past 60 candlesticks and 30 candlesticks are the s
FREE

Check my p a id tools they work perfect please r ate Here is an Upgraded version with Bonus Ea in case of purchase it costs 30$ only and you get Ea as Bonus: https://www.mql5.com/en/market/product/96835 This indicator is experimetal, it shows TMA channel arrows with Volatility filter built in to avoid lagging. Try to experiment with it, search for better conditions of use. It is possible to adjust different timeframes for TMA and for Volatility filter Same time on the current chart, so it ma
FREE
The principle of this indicator is very simple: detecting the candlestick pattern in M5 timeframe, then monitoring the return point of graph by using the pullback of High-Low of M5 Candlestick and finally predicting BUY and SELL signal with arrows, alerts and notifications. The parameters are fixed and automatically calculated on each time frame. Example:
If you install indicator on XAUUSD, timeframe M5: the indicator will detect the reversal, pullback, price action on this timeframe (for exa
FREE

Update: For those who want to manually backtest this indicator, check this tool https://www.mql5.com/en/market/product/59248
The indicator will help make your calculation of stop loss easier as it will be visually aiding you in choosing where to put your stoploss level on the chart by calculating the current value of ATR indicator. For those who are unfamiliar with ATR, it is a useful indicator to calculate stoploss for trend following strategy. If volatility is high, ATR stoploss level will b
FREE

*This is TradingView indicator converted to mql4*
The SuperTrend V indicator is a popular technical analysis tool used to identify trends and potential trend reversals in financial markets. It is based on the concept of the SuperTrend indicator but incorporates additional features and variations. The SuperTrend V indicator uses a combination of price action and volatility to determine the trend direction and generate trading signals. Here are the key components and features of the indicator:
FREE

MT5 Version Fibonacci Bollinger Bands MT4 Fibonacci Bollinger Bands is a highly customizable indicator that shows areas of support and resistance. This indicator combines the logic for the Bollinger Bands with the Fibonacci level. Fibonacci Bollinger Bands is the first indicator in the market that allows the user to 100% customize up to 12 Fibonacci levels, the Moving Average type and the price data source to use for the calculations. This flexibility makes the Fibonacci Bollinger Bands easi
FREE
Time your Entry and Exits with Average True Range (ATR) Trailing Stops ATR Trailing Stops are primarily used to protect capital and lock in profits on individual trades but they can also be used, in conjunction with a trend filter, to signal entries. The indicator will help make your calculation of stop loss easier as it will be visually aiding you in choosing where to put your stoploss level on the chart by calculating the current value of ATR indicator. For those who are unfamiliar with ATR, i
FREE

DONCHIAN CHANNEL DC Это индикатор тренда, разработанный “ Richard Donchian”, состоящий из 3 слоев: верхнего канала, нижнего канала и среднего канала. Он создается на канале Donchian путем нанесения на ценовой график самой высокой и самой низкой цены, достигнутой за прошедший период. Он также используется для измерения волатильности рынка, поскольку это расширяющийся/сокращающийся канал в зависимости от увеличения/уменьшения волатильности цен. Method 0; Чертеж индикатора канала Donchian. BUY/SELL
FREE
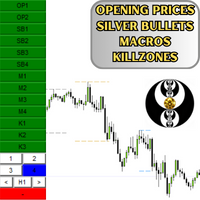
This is an Indicator that plots Time & Price . This is a good ICT Starter Indicator especially if you're new. This also has 4 Silver Bullets and 4 Macros. If you liked this one, you can purchase the updated version of this which has CBDR and Asian Range . Updated Version: https://www.mql5.com/en/market/product/109904 Please leave a review about your experience with this Indicator
FREE

Two Period RSI сравнивает долгосрочные и краткосрочные линии RSI и запоняет цветом область между ними для лучшей визуализации. Цвет зависит от тренда – восходящего (краткосрочный RSI выше долгосрочного) или нисходящего (краткосрочный RSI ниже долгосрочного). Пересечение линий RSI является сильным подтверждающим сигналом. Это небольшой инструмент для визуализации и подтверждения трендов RSI. Надеемся, он будет вам полезен! Ищете RSI-алерты? Загрузите наш индикатор Two Period RSI + Alerts , включа
FREE

Bouncing Bollinger tells the trader when the market is about to reverse using 3 candlestick formations as well as the Directional Movement Index Indicator.
When the previous candle has dipped into the upper or lower Bollinger Band and a candle signal appears along with DMI showing un-volatile a signal occurs showing possible reversal ahead. Features :
A practical way of recognising when a new reversal is about to occur. Choose your favourite signal color. Send alerts to either your PC,
FREE
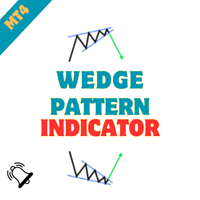
Wedge Chart Pattern Indicator - Unleash the Power of Wedge Patterns in Your Trading Embark on a journey of precision trading with the "Wedge Chart Pattern Indicator." Crafted for MetaTrader, this advanced tool is your ultimate companion for identifying wedge chart patterns, empowering you to make informed and strategic trading decisions. Whether you're a seasoned trader or just starting, this indicator simplifies the process of spotting wedge patterns, providing you with a valuable edge in the m
FREE

MT4 Candlestick Pattern Alert Indicator: Stay Ahead of Trading Opportunities Overview The MT4 Candlestick Pattern Alert Indicator is a robust tool designed to empower traders by detecting candlestick patterns and delivering timely alerts through notifications, emails, and pop-up alerts. This invaluable tool saves traders precious time, allowing focused analysis on patterns and potential profitable trades. Importance of Candlestick Patterns Candlestick patterns are pivotal in technical analysis,
FREE
This indicator has a lot of numerology analyzing methods that can support your analyzes or can work as custom strategy by it self ..we will start to explain them one by one : this the trial version of this product to have this product here is the link : https://www.mql5.com/en/market/product/118782 1- Range channel that draws the limits of daily movements to detect places of buy and places of sell .
2- Angler will detect Dynamic numeral levels that result of time and price squaring with cus
FREE

CyberZingFx Trend Reversal Indicator - your go-to solution for accurate and reliable trend reversal signals. With its unique trading strategy, the indicator offers you Buy and Sell Arrow signals that do not repaint, making it a reliable tool for catching Swing Highs and Swing Lows.
SCROLL DOWN TO VIEW SCREENSHOTS AND WATCH VIDEO ________________________________________________________________ Trading using CyberZingFx Trend Reversal is Simple Using the CyberZingFx Trend Reversal Indicator is e
FREE

RSI With Alert
Relative strength index (RSI) indicator is a popular technical indicator in the family of oscillators.
RSI oscillates between 0 and 100 and traders use it to spot overbought and oversold states in the market.
Typically, a value above 70 means that the instrument is overbought and due to a retracement. A value below 30 means that the trading instrument is oversold.
RSI indicator strategies
This indicator allows you to get notifications when some conditions trigger. You c
FREE

Это усредненный указатель класса, основанный на пользовательском алгоритме алгоритма, в соответствии с диапазоном цветов, помеченных вверх и вниз, может быть открыт или закрыт, чтобы подсказать, что в настоящее время следует повесить покупку или продажу.
описание списка параметров:
Extern int Price = 0; / / indicator начальный расчет средней цены
Extern int Length = 20; / / indicator вычисляет средний период, эквивалентный среднему периоду MA.
Extern int Displace = 0;
FREE

I made this RSI Indicator into multi time frame monitoring to monitor the occurrence of OverBuy and OverSell in real time on one monitor screen. My hope is that this indicator can help friends in the analysis process and also take trading moments with the system that friends have If this indicator is useful, friends can help me by giving likes to my channel and 5 stars on this indicator
Indicator RSI ini saya buat menjadi multi time frame monitoring untuk memantau terjadi nya OverBuy dan
FREE
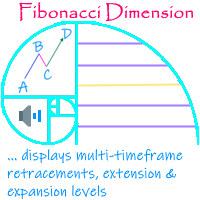
'Fibonacci Dimension' indicator allows display of preset or user-defined multi-timeframe Fibonacci levels. It automatically takes the previous high and low for two user-defined timeframes and calculates their Fibonacci retracement levels. It also considers the retraced level to draw the expansions on every change of price. A complete visual dimension in multiple timeframes allows deriving profitable strategies for execution. The functionalities included are: Provides an option to consider a pres
FREE

Ищете качественный индикатор точек разворота? Значит, PZ Pivot Points - это то, что вам нужно! Он строит уровни не только за текущий день. Он строит исторические уровни для проведения тестирования на истории Вы сами выбираете таймфрейм Цвета и размеры настраиваются
Что такое "точки разворота"? Анализ точек разворота зачастую применяется совместно с расчетом уровней поддержки и сопротивления, как и в случае с анализом трендовых линий. При анализе точек разворота первые уровни поддержки и сопрот
FREE
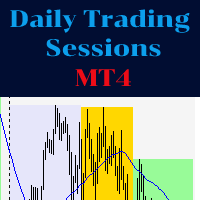
The indicator represents the session boxes for the Asian, European and American sessions. It is possible to change the time of each session, such as color. It is also possible to disable the display of each session. You will find in input parameters variables to modify time sessions in format hh:mm and the color of boxes of each sessions. If you need some implementations please contact me.
FREE

Heikin Ashi is Japanese for "average bar", and may make it easier for you to identify trends. Our version of this popular indicator adjusts the size of the candles based on the zoom level of your chart, making it appear more naturally just like the traditional candlesticks. The colors are selected based on the color scheme you use on your charts, but can be customized anyway you would like. You may also choose whether to display only the Heikin Ashi candles, or show the other selected chart as w
FREE

Whether trading stocks, futures, options, or FX, traders confront the single most important question: to trade trend or range? This tool helps you identify ranges to either trade within, or, wait for breakouts signaling trend onset.
Free download for a limited time! We hope you enjoy, with our very best wishes during this pandemic!
The issue with identifying ranges is some ranges and patterns are easy to miss, and subject to human error when calculated on the fly. The Automatic Range Identi
FREE
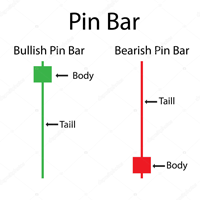
Pin bar pattern is characterized by a long upper or lower wick with a small body relative to the size of the wick with little to no lower or upper shadows. Pin bars are not to be traded in isolation , but need to be considered within the larger context of the chart analysis. A pin bar entry signal, in a trending market, can offer a very high-probability entry and a good risk to reward scenario.
Inputs MinimumTailPips- Minimum size of Tail in pips; TailBodyCandle- means how many times Tail gre
FREE

Оживите свои торговые графики с помощью нашего инновационного конструктора тем для Metatrader!
Наш Конструктор тем позволяет создать торговую среду, которая соответствует вашему личному стилю и предпочтениям. Благодаря простому в использовании интерфейсу и полной интеграции в Metatrader, вы теперь можете полностью контролировать внешний вид и восприятие ваших графиков / Бесплатная версия MT5 .
Особенности Полная настройка: Легко изменяйте цвет свечей и фон графика, чтобы отразить ваш уник
FREE
MetaTrader Маркет - уникальная площадка по продаже роботов и технических индикаторов, не имеющая аналогов.
Памятка пользователя MQL5.community расскажет вам и о других возможностях, доступных трейдерам только у нас: копирование торговых сигналов, заказ программ для фрилансеров, автоматические расчеты через платежную систему, аренда вычислительных мощностей в MQL5 Cloud Network.
Вы упускаете торговые возможности:
- Бесплатные приложения для трейдинга
- 8 000+ сигналов для копирования
- Экономические новости для анализа финансовых рынков
Регистрация
Вход
Если у вас нет учетной записи, зарегистрируйтесь
Для авторизации и пользования сайтом MQL5.com необходимо разрешить использование файлов Сookie.
Пожалуйста, включите в вашем браузере данную настройку, иначе вы не сможете авторизоваться.