Смотри обучающее видео по маркету на YouTube
Как купить торгового робота или индикатор
Запусти робота на
виртуальном хостинге
виртуальном хостинге
Протестируй индикатор/робота перед покупкой
Хочешь зарабатывать в Маркете?
Как подать продукт, чтобы его покупали
Бесплатные технические индикаторы для MetaTrader 4 - 22
Introduction and Description The commodity channel index (CCI) is an oscillator originally introduced by Donald Lambert in 1980. Since its introduction, the indicator has grown in popularity and is now a very common tool for traders in identifying cyclical trends not only in commodities but also equities and currencies. The CCI can be adjusted to the timeframe of the market traded on by changing the averaging period. CCI indicator with different colors at levels 0, 100 and -100. The cross is a
FREE

Active Price Lines
Indicator gives you full custom control over the Bid and Ask price lines, both color and style. Color control is also customizable based on increased or decreased price by the tick.
Options include: Show both the Bid line and the Ask line Set unique color for each Set unique line style for each Set unique color for increased price (by the tick) Show only Bid line Show only Ask line
Rider Capital Group
FREE

Risklimiter
Limit your risk with this dynamic stop loss indicator. It will show you exactly where to place your initial stop & subsequent stops as the price goes in your favour. Works on any time frame as well as any symbol. It is not restricted in any way nor does it need optimisation. Simply drag and drop on to a chart for it to display a stop loss. You may find at times, it shows a stop on the other side of your trade, this will change as soon as price closes above/below it.
DOES NOT RE
FREE

In a departure from the conventional approach, traders can leverage the bearish engulfing candlestick pattern as a buy signal for short-term mean reversion trades. Here's how this alternative strategy unfolds: The bearish engulfing pattern, (typically signaling a reversal of bullish momentum) , is interpreted differently in this context. Instead of viewing it as a precursor to further downward movement, we perceive it as an indication of a potential short-term bounce or mean reversion in prices.
FREE

Binary options tester Торговая панель для тестирования своих стратегий по правилам бинарных опционов. Возможности: Выставлять время экспирации в секундах. Задавать размер ставки. Задавать размер депозита. Задавать процент прибыли с сделки. Заключать несколько сделок подряд. Отслеживать время до закрытия опциона. График тиков с уровнями сделок дублируется на дополнительное окно для точности. Позволяет работать как в режиме тестирования так и в режиме реальных котировок. Программа дает представлен
FREE
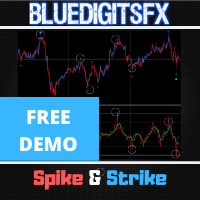
NOTE : This Free version only works for the EURUSD & AUDUSD Symbol !
MT4 Version Available Here: https://www.mql5.com/en/market/product/43438
MT5 Version Available Here: https://www.mql5.com/en/market/product/50255
Telegram Channel & Group : https://t.me/bluedigitsfx
V.I.P Group Access: Send Payment Proof to our Inbox
Recommended Broker: https://eb4.app/BDFXOsprey
* Breakthrough Solution For Reversal Trading And Filtering With All Important Features Built Inside One Tool!
FREE

Free version of https://www.mql5.com/en/market/product/44606 Simple indicator to calculate profit on fibonacci retracement levels with fixed lot size, or calculate lot size on fibonacci levels with fixed profit. Add to chart and move trend line to set the fibonacci retracement levels. Works similar as default fibonacci retracement line study in Metatrader. Inputs Fixed - select what value will be fix, lot or profit (available in full version, lot is set on free version) Fixed value - value t
FREE

Current Pips and Money Profit This indicator displays the results of the currently open position on the graph. Result in pips and in the invoice currency. Thanks to this, you can enlarge the chart to the entire screen and have control over the result of trading without opening a terminal window which takes a space of a screen. The display positions of this data can be adjusted at the user's discretion and colors also.
FREE

Forex trading support timer: - This is an indicator that supports a trader's trading process. - Before placing a BUY or SELL order, it is advisable to observe what the current time is like, to get the best position when trading. Function of indicator: - Display information about candle closing time of different timeframes (M1,M5,M15,H1), best used when Scalping. - Show market spreads. - Show TimeZone Trading. - Displays the remaining time of a session.
FREE

It's a simple but useful tool for creating a grid based on Bollinger Bands .
Only 2 parameters can be set: 1) "Period" - the period of all visible Bollinger Bands (i.e. 4) and 1 Moving Average (axis of all Bollinger Bands), 2) "Deviations Distance" - the distance between Bollinger Bands.
Naturally, the colors of all 9 lines can be changed as desired. It works with everything that is available in your Market Watch.
Good luck!
FREE
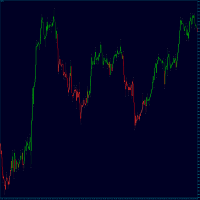
TrendFinder RSI are Colored candlesticks showing the trend based on The Relative Strength Index (RSI) This indicator will give you the color change on the next bar on the confirmation candle and will never repaint TrendFinder RSI is optimize to trade on any market and to be used trending and None trending markets. For best results use this indicator as an extra tools after you have completed your regular analysis and use it for alerts based on such analysis.
FREE

Набирается блок баров при условии конвергенции . Если условия конвергенции не соблюдаются, блок удаляется. Более точнее, условием является переход блока баров из состояния конвергенции в состояние дивергенции . Блоки формируются выборочно с пропусками. Пропуски характеризуются состоянием дивергенции баров. Перед тем как блок удалится, находятся экстремальные значения баров внутри блока ( min , max ). Линия соединяет экстремальные бары. Линия прорисовывается только перед тем как блок уд
FREE

Velvet RSI is intended for use with the Velvet advanced ordering layer. It is a modified version of the RSI indicator provided by Metaquotes and all of the data it displays is accurate and verified, when it is detected by the ordering layer. In order to place orders with the Velvet RSI indicator, the ordering layer must be installed and running. Ordering from the Velvet RSI indicator requires that "Velvet Ordering Layer" ( found here ), version 1.0 or higher, be installed and running. When de
FREE

Introducing RSI Jurik—an innovative indicator designed to revolutionize your forex trading strategy by combining custom moving averages based on the Relative Strength Index (RSI) with the MetaTrader 4 indicator, RSI.
Jurik moving averages are renowned for their accuracy and reliability in analyzing price movements in the forex market. They provide traders with smoother representations of price action, reducing noise and offering clearer signals for identifying trends and potential reversals.
FREE

This is a very simple multiple moving average indicator.
It can display 12 moving averages. The time axis of the moving averages can be changed in the input field of the indicator. The process is faster than the 12 moving averages included with MT4.
We also have a buffer set up so you can access it from an Expert Advisor. *For advanced users.
If you have any questions or requests, please message me.
Thank you. MT5 Version: https://www.mql5.com/en/market/product/124997
FREE

Индикатор в виде гистограммы показывает восходящий и нисходящий тренды. Данный инструмент рекомендуется использовать в качестве фильтра. Основываясь на его показаниях можно отследить начало, окончание и продолжение тренда. Этот дополнительный инструмент подойдет для любой торговой системы. Параметры Period — период индикатора; Bars — количество баров для отображения на истории.
FREE

This indicator works on this way: Trader should provided the n period "Number of Candle" ( the default period is 6) Then the indicator will calculate the number of pips in the last n period (not the current candle) And that is display on the chart With that the should confirmed his up trend or down trend analyse according to the number of pips in the last n candles( bullish or bearish) he has provided
FREE

Non-proprietary study of Joe Dinapoli used for trend analysis. The indicator gives trend signals when the fast line penetrates the slow line. These signals remain intact until another penetration occurs. The signal is confirmed at the close of the period. It is applicable for all timeframes. Inputs lnpPeriod: Period of moving average. lnpSmoothK: %K period. lnpSmoothD: %D period. *****************************************************************************
FREE

Покупайте и продавайте сигналы с помощью Гистограммы MACD. Интерфейс прост и прост для понимания. Вы можете перзонализировать индикатор несколькими способами в соответствии с его визуальным стилем или, что еще более важно, его настройкой параметров для обнаружения рыночных сигналов. Используя опцию Мультипликатора в меню, можно увеличить период индикатора, хотя рекомендуется использовать настройки по умолчанию.
FREE

The indicator detects market efficiencies and inefficiencies by studying price movements and marks candles where the best efficiencies occurred. The most 'efficient' candles are indicated with a vertical bar histogram. Taller bars represent these candles. The highs and lows of these candles are supply and demand areas, important levels that will be retested in the future. It can be used on all time frames with the same settings.
FREE

CCI Trend Finder indicator with different colors at levels 0, 100 and -100. The cross is a signal for "123 Exit" as presented by MPlay and used in Woodies CCI system. This exit signal is effective especially in short-term breakout trades, because it prevents early exiting at small corrections. This indicator is great for having it as an extra tool for your analysis.
FREE

The Hurricane Cave Indicator shows different trade areas based on price action. It looks in the past and works out patterns that can enforce support and resistance as targets. When price breaks out of a trade area you can target just inside the next trade area. If you can't see the target just go to a slower time frame, it means the price hasn't been there for a long time. The Hurricane Cave Indicator is designed to be an add on to The Hurricane Forex Indicator also available in the Meta Trader
FREE

MP Price Change Indicator is a tool to calculate the price movement by percentage. The Value of this indicator can be adjusted to look back of the percent of price change within certain timeframes. This is a powerful tool when used by other indicators as well, such as ATR and ADR, for understanding price fluctuations and tolerance in different strategies. ___________________________________________________________________________________ Disclaimer:
Do NOT trade or invest based upon the analys
FREE
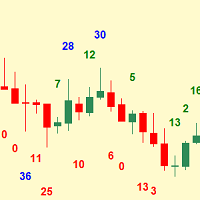
Simplest indicator for bar shadows. Very useful for Kangaroo Tail strategy.
"Shadows" - this is the distance from high and close of the bull bar and low and close of the bear bar. The purpose of the shadow is to show you if the bar is strong or not. Whether it is internal to the trend or is external. It even helps determine if a trend is starting. Input arguments: How many prevoius bars to calculate Value that should be passed to trigger the alarm How many times to repeat the alarm (Put 0 if y
FREE
Standard deviation with levels - модифицированный индикатор Standard deviation, который дополнен уровнями предполагаемых максимумов и минимумов. Построение уровней происходит при помощи индикатора Support and resistance bands , который определяет ближайшие к текущему значению индикатора уровни минимума и максимума на основе исторических значений экстремумов.
Параметры standard deviation period - период индикатора стандартного отклонения. extremum detector period - период детектора экстремумов.
FREE
Индикатор определяет зоны перекупленности и перепроданности на разных временных интервалах. Стрелки обозначают тенденцию рынка на разных тайм сессиях. Если рынок вышел из зоны перепроданности, то стрелка будет сигнализировать о восходящем тренде (стрелка вверх), если рынок вышел из зоны перекупленности, то стрелка будет сигнализировать о нисходящем тренде (стрелка вниз). В правом нижнем окне отображается ситуация на том тайм-фрейме, на котором установлен индикатор. В нем представлена информация
FREE

TPP : Turning Point Pattern The indicator shows the market Turning Point Pattern as arrows. The reversal signals are based on observation of price action and market behavior. It is based on the principles of searching for extremums, volatility, and candlestick pattern. The indicator provides signals on the following principles: Search for the end of the ascending/descending trend Search for the reversal pattern based on candlestick pattern Confirmation of the reversal by the volatility. The in
FREE

Property of Vertical Capital Edition: Gugol_Quants About USA INDEXES QUANT_INDICATOR: This is a indicator created by math modulation to be used as a trading tool, which was developed in MQL. (MT4) This indicator is for use only with US500(S&P500), NAS100(Nasdaq Composite) and US30(Dow Jones). Signals are activated on "Open" Candle. It’s based on Intraday/Swing Trades whose main timeframe is H1, H2, H3 and H4. However you can use it with other assets by testing with the appropriate settings. *
FREE

Данный сканер показывает значения тренда по известному индикатору Parabolic SAR для нескольких инструментов (до 30) и 8 таймфреймов. Уведомляет о смене направления тренда в терминале MetaTrader 4, по email и push-уведомлением. Это бесплатная версия индикатора Advanced Parabolic SAR Scanner Бесплатная версия работает только на EURUSD и GBPUSD!
Важная информация Для максимального использования потенциала сканера прочитайте полное описание (на английском языке): www.mql5.com/en/blogs/post/718074
FREE

The TLR indicator is a market trend identification indicator. The idea behind this indicator is to use 3 linear regression lines, one short-term, one medium-term, and one long-term. The UPTREND will be determined when: The long-term linear regression line and the medium-term linear regression line have an uptrend. The long-term linear regression line has an uptrend, the medium-term linear regression line has a sideway, and the short-term linear regression line has an uptrend. The DOWNTREND will
FREE

The dashboard should help to get a quick overview of the correlations of different assets to each other. For this, the value series are compared according to the Pearson method. The result is the value of the correlation (in percent). With the new single asset mode, you can immediately see which symbols have the highest positive or negative correlation. This prevents you from accidentally taking a risk on your trades with highly correlated symbols. Usage There are different methods for the corre
FREE

После 7 лет работы я решил бесплатно предоставить некоторые из своих собственных индикаторов и экспертных советников (EA).
Если они вам полезны, пожалуйста, поддержите 5-звездочным рейтингом! Ваш отзыв мотивирует меня продолжать предлагать бесплатные инструменты. Ознакомьтесь с моими другими бесплатными инструментами здесь .
_________________________________ Индикатор ATR с полосами для улучшенного анализа волатильности рынка Представляем индикатор ATR с полосами, разработанный в
FREE

Трендовый индикатор, который определяет оптимальные точки входа в направлении тренда, а также объективный стоп-лосс для управления сделкой. Индикатор позволяет поймать тренд на раннем этапе. Индикатор рисует линию сопротивления, когда обнаруживает на графике восходящий тренд , и линию поддержки, когда обнаруживает нисходящий тренд . Пробой этих уровней позволяет определить направление и импульс преобладающего тренда, что позволяет определить оптимальные точки входа в направлении тренда. Индикато
FREE

This indicator calculates average speed of moving average indicator. Here is parameters: BarsToProcess - indicator calculating period; MaPeriod - period of Moving Average indicator; AveragingPeriod - period (MA values) of the basis of which the average value is calculated; MA_Method, MA_Apply_to - using to set MA indicator parameters; Thats all! Good luck.
FREE
CandleCloseCountdown is technically an indicator. Its purpose is to show the time a candle has left on a given timeframe before it closes. All possible time frames of MetaTrader 4 are supported. The way the remaining time is displayed depends on the selected timeframe. For M1 only the seconds are displayed. Above that at all timeframes up to H1 the remaining minutes and seconds are displayed and so on for timeframes above D1.
FREE

As the title says, this is an indicator that shows the current open market (session). It has 4 sessions with customizable schedule : 1. London session, 2. New York session, 3. Sydney session, 4. Tokyo session.
Indicator inputs: - The color of each session. - The open time and close time of the sessions. - The line width.
The objective of the indicator, is to follow each sessions, observe at what times are multiple sessions open, and thus take the chance of the high market movements.
FREE

Индикатор рассчитывает среднюю скорость цены за установленный период времени. Известно, что торговое время течет неравномерно, рывками. Оно то идет быстрее, то замедляется. Этот индикатор подскажет, что торговое время ускорилось и нужно переходить на младшие таймфреймы для поиска торговых сигналов.
Использование Алерт звучит, когда скорость цены превышает заданный порог. Значение порога можно изменять с помощью кнопок на информационной панели. В качестве звукового алерта можно использовать .wa
FREE

The intention of the dashboard is to provide a quick overview of the daily, weekly and monthly range of configured assets. In "single asset mode" the dashboard shows you possible reversal points directly in the chart, thus making statistics directly tradable. If a configured threshold is exceeded, the dashboard can send a screen alert, a notification (to the mobile MT4) or an email. There are various ways of using this information. One approach is that an asset that has completed nearly 100% o
FREE

Адаптивная скользящая средняя (Adaptive Moving Average, AMA) разработана Перри Кауфманом и представляет собой разновидность скользящей средней с низкой чувствительностью к рыночному шуму и волатильности в сочетании с минимальным запаздыванием для обнаружения тренда. Эти характеристики хорошо подходят для определения общего рыночного тренда, поворотных моментов и фильтрации цен. Подробности расчета AMA можно найти в справке по MetaTrader 5 ( https://www.metatrader5.com/ru/terminal/help/indicators
FREE

Netsrac SR Dashboard Free
Примечание. Этот счетчик является бесплатной версией Netsrac SR Dashboard. Эта версия поддерживает только две иконки - никакие тревоги не срабатывают. Вы найдете полную версию ниже https://www.mql5.com/de/market/product/34855
смысл С приборной панелью SR вы получаете мощный инструмент для управления наиболее важной информацией в торговле. Соберите настройку в соответствии со своей стратегией и получите информацию, как только эта настройка вступит в силу. Назначьте
FREE

Chart Time — очень простой индикатор, но он может быть очень важным помощником для контроля времени перед открытием сделки вручную. В индикаторе есть три варианта отображения времени на графике.
Входные параметры Show Time : выбор вариантов отображения времени. Local Time (локальное время компьютера), Server Time (время сервера брокера) или GMT. Рекомендации: Индикатор надо запускать на каждом необходимом графике.
FREE

For traders, monitoring price movements is a constant activity, because each price movement determines the action that must be taken next. This simple indicator will helps traders to display prices more clearly in a larger size. Users can set the font size and choose the color that will be displayed on the chart. There are three color options that can be selected to be displayed on the chart.
FREE

Скорость изменения
На основе формулы, ROC = (Close[n] - Close[n-lookback]) / Close[n-lookback] * 100 для построения графика скорости изменения ценового действия валютной пары за период ретроспективного анализа и предоставляет две глобальные переменные, SYMBOL_ROC и SYMBOL_ROC_LOOKBACK, которые представляют последнее значение скорости изменения и скорость изменения в предыдущем периоде ретроспективного анализа. Вызов индикатора с помощью функции iCustom, iCustom ( "Market/RedeeCash_Rate_of_Cha
FREE

Идите по следу кометы, чтобы знать, как будет развиваться тренд. Индикатор помогает определить развитие цены в зависимости от способа отображения этих астрономических объектов на графике. Когда кажется, что комета останавливается, она значительно раскрывает свои хвосты и предупреждает о возможной смене тренда. Напротив, когда кажется, что она ускоряется (выглядит тонкой, потому что линии хвоста сгруппированы), она показывает безопасность и продолжение тренда. Голова или ядро кометы будет отображ
FREE
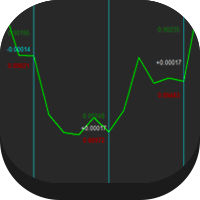
This indicator gives the highest and lowest information of the currency you have selected and the day you selected. It also shows the average. In this way, you can find out the profit / loss probability of your transactions for the same days. Reported: Average points per week Average points per year Lifetime average points Note: It does not provide you with buy / sell signals. Shows average points only
FREE
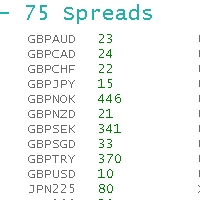
ObiForex 75 Spreads Discover a powerful indicator showcasing instant spreads for 75 currency pairs. Unlock valuable insights for informed trading decisions and optimize your strategies. The indicator features 3 columns, providing a comprehensive view of the spreads. Spread reading can be effectively used with macroeconomic news. Share your strategies! For optimal performance, install the indicator on the USDJPY currency pair. Experience the capabilities of ObiForex 75 Spreads and elevate your tr
FREE
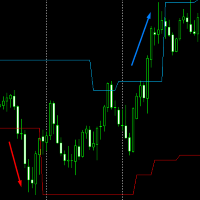
Volatility Channel from JagzFX helps you find breakouts by displaying a channel on the price chart. Volatility Channel is simple to use - there are no parameters - and works on any timeframe. BASIC USE of Volatility Channels The channel can be used as a 'No Trade Zone': you don't trade when the price is inside the channel. However:
When the price breaks above the channel: go Long. When the price breaks below the channel: go Short. The indicator works on all timeframes to suit your trading style
FREE
Track your overall trades! Monitor New Fox is an excellent indicator, which displays your current profits, being them monthly, weekly, and daily, that is, all profits obtained when you opened the mt4. Our brand new Monitor New Fox indicator is able to unlock all advanced features of MetaTrader 4. This indicator can graph with simple data key meta trader account data (Balance, Equity, Free Margin, Current Profit/Loss, Profit/Loss total, amount of open position(s) and size, etc.) and all this in a
FREE

Volume Cross Over is an indicator that measure positive and negative volume flow in a financial instrument, such as a stock, commodity, or index. It is base on the idea of On-Balance Volume developed by Joseph Granville. However instead of trending lines, this indicator shows volume cross over. When the closing price of an asset is higher than the previous closing price, then the Bull volume is greater than zero and Bear volume is negative. It suggests that buying volume is dominating, a
FREE
This indicator allows to hide Bollinger Bands (on all MT4 timeframes) from a date define by the user, with a vertical line (Alone) or a panel (with "Hidden Candles"). Indicator Inputs: Period Deviations Shift Apply To Color Style Width Information on "Bollinger Bands" indicator is available here: https://www.metatrader4.com/en/trading-platform/help/analytics/tech_indicators/bollinger_bands ************************************************************* Hey traders!! Give me your feeds! We are
FREE

Индикатор Price Alert воспроизводит звуковой сигнал при достижении ценой определенного уровня, заданного трейдером. Если вы используете функцию уведомления по e-mail, не забудьте указать параметры вашей почты в настройках платформы MetaTrader. Входные параметры: WhenPriceGoesAbovePIP - если цена понднимется на указанное количество пипсов выше текущего уровня, сработает оповещение. WhenPriceGoesBelowPIP - если цена опустится на указанное количество пипсов ниже текущего уровня, сработает оповеще
FREE

This indicator will show week and monthhigh low, very useful to understand the market sentiment. To trade within the range/ break out. Low- can act as support- can used for pull back or break out High- can act as resistance- can used for pull back or break out Breakout strategy refers to the day trading technique that provides traders with multiple opportunities to go either long or short . The main idea is to identify the trend in its most juicy state followed by a trending move.
FREE

Этот индикатор отображает уровни открытия, максимума, минимума и закрытия предыдущего месяца на нижних таймфреймах текущего месяца.
Эти уровни действуют как хорошие уровни поддержки и сопротивления.
Большую часть времени цена колеблется в пределах уровней.
дождитесь, пока цена достигнет этих уровней и действуйте соответственно.
Обратите особое внимание на слияние уровней.
Согласно моим наблюдениям, если уровень Close (White) находится в слиянии с любыми другими уровнями,
FREE

Здесь все очень просто. Никогда не понимал индикаторы без внешних параметров. И Awesome Oscillator не исключение. Теперь вы можете настраивать этот индикатор под свои потребности и стратегии. Справка: Индикатор Awesome Oscillator показывает расстояние в пунктах между двумя скользящими средними (быстрой и медленной). Индикатор AO_Robex имеет в параметрах изменение периода скользящих средних.
FREE
The LWO is a tool that effectively indicates the end of trends. Being an oscillator, it has values between 0 and 100, defining the areas of hyper-sold and those of hyper-bought. Its effectiveness is due to the weighing of prices at the end of individual periods on a logarithmic scale; this allows you to have a perception of the will of the market.
The parameters
The indicator has only 2 settable values, period and smooth factor.
The period indicates how many bars the weighing is performed,
FREE
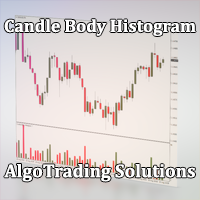
Индикатор Candle Body Histogram отображается в отдельном окне и показывает размер тела каждой свечи в виде гистограммы. В зависимости от того растёт свеча на графике или снижается, гистограмма меняет свой цвет. Свечи "доджи", у которых совпадают цены открытия и закрытия, так же отображаются на гистограмме отдельным цветом. Поскольку индикатор строится от нулевого значения, он позволяет визуально сравнить тела свечей относительно друг друга. На гистограмме можно разместить уровни, чтобы отслежив
FREE

Индикатор "Elvis A" предназначен для очень строгого определения разворота. С авторскими настройками устанавливается на график D1. Он будет пропускать много сигналов и выбирать только самые надёжные. Поэтому лучше установить его на несколько валютных пар. На скриншоте показан пример работы этого индикатора в виде советника на валютной паре с очень большим спредом.
FREE

The Stochastic Basket Currency Strenght brings the Stochastic indicator to a new level. Expanding the boundaries of TimeFrames and mono-currency analysis, the SBCS take the movements of each currency that composes the cross and confront them in the whole basket of 7 crosses. The indicator works with any combination of AUD, CAD, CHF, EUR, GBP, JPY, NZD, USD pairs and with full automation takes in account every stochastic value (main line) for the selected Time Frame. After that, the indica
FREE
Introduction: Welcome to the world of advanced trading tools! Introducing the CCI Multicurrency Scanner, an exceptional MT4 indicator designed to revolutionize your trading experience. With its powerful features and comprehensive insights, this tool will empower you to make informed decisions and maximize your profitability. Features: Efficient Multicurrency Scanning: Our CCI Multicurrency Scanner swiftly scans multiple currencies based on your inputs. Receive instant alerts when specific condit
FREE

Non-proprietary study of Joe Dinapoli used for trend analysis. The indicator gives trend signals when the fast line penetrates the slow line. These signals remain intact until another penetration occurs. The signal is confirmed at the close of the period. It is applicable for all timeframes. Parameters Fast EMA: period of the fast moving average. Slow EMA: period of the slow moving average. Signal EMA: period of the signal line. ************************************
FREE

Индикатор RSI с сигнальными линиями, при пересечении которых будет выдаваться соответствующее уведомление, которое может быть в виде обычного алерта, либо в виде воспроизведения пользовательского звукового файла. Также индикатор имеет функцию отправки push-уведомлений и уведомлений на Email при пересечении этих уровней. Значения уровней можно задавать самостоятельно в настройках индикатора, а также при желании их можно изменять и настраивать непосредственно в окне индикатора. Данный продукт - де
FREE

Индикатор на основе (Williams` Percent Range) анализирует касания сигнальной линии по стенкам канала и формирует зоны для принятия решения о направлении хода цены. Для удобства встроена функция оповещения. Также можно включать и отключать искомые зоны. На одном графике можно использовать несколько индикаторов с разными настройками. Это поможет подобрать оптимальную стратегию.
FREE
Данный индикатор представляет собой отображение элементов торговой системы, описанной Биллом Вильямсом. Индикатор использует идею открытия сделок на продажу в период одновременного падения значений MACD и OsMA (в книгах Билла Вильямса для этих индикаторов используются названия АО и АС) или наоборот, открытие сделок на покупку в период одновременного роста значений таких индикаторов. Толстая и тонкая цветные гистограммы соответствуют значениям MACD и OsMA. Если гистограмма больше 0, значение инди
FREE
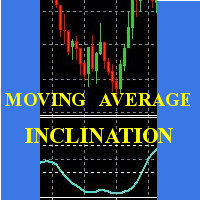
Scalp using the behavior of a short moving average, the indicator gives the slope and identifies the "hyper" moments.
Operational advice:
Use M1 chart. Period 20 : open buy after two rising lows; sell after two max downhill; avoid countertrend openings; when the line goes flat put a stop at the opening price. Avoid actions in low volatility timeslots. When the curve that draws the min / max is very flat, it is better to postpone at least 15'.
Period 50 : matches the trend, when it is at t
FREE

Classical Keltner Channel Indicator, Extended version. Works on any instruments. It shows Keltner Bands under these parameters: * periodMa - Period of Moving Average * periodAtr - Period of ATR (Average True Range) * atrMultiplier - ATR Multiplier, multiplies range, calculated by PeriodATR parameter * modeMA - modes of moving average (MA) calculations (Simple, Exponential, Smoothed, Linear Weighted) * modePrice - modes of Price calculations for MA (Close, Open, High, Low, Median, Weighted) T
FREE
This indicator allows to hide Volume (on all MT4 timeframes) from a date define by the user with a vertical line (Alone) or a panel (with "Hidden Candles"). The color of each bar depends if this one is higher or lower of the previous bar. Indicator Inputs: No inputs for this indicator Information on "Volume" indicator is available in this post: https://www.mql5.com/en/forum/134260 ************************************************************* Hey traders!! Give me your feeds! We are a commun
FREE

Индикатор отображает на графике сигналы согласно стратегии Билла Вильямса. Демо версия индикатора имеет такие же функции, как и платная, за исключением того, что может работать только на демо-счете. Сигнал "Первый мудрец" формируется, когда появляется разворотный бар с ангуляцией. Бычий разворотный бар - у которого более низкий минимум и цена закрытия в верхней его половине. Медвежий разворотный бар - более высокий максимум и цена закрытия в нижней его половине. Ангуляция образуется, когда все
FREE

The indicator is based on the concept of price channels, which are formed by plotting the highest high and lowest low prices over a specified period of time. The Donchian Channel Indicator consists of three lines: an upper channel line, a lower channel line, and a middle channel line. The upper channel line represents the highest high over a specified period, while the lower channel line represents the lowest low. The middle channel line is the average of the two and can be used as a reference f
FREE

Tool converted from tradingview. A simple indicator that plots difference between 2 moving averages and depicts convergance/divergance in color coded format.
Anything <= 0 is red and shows a bearish trend whereas > 0 is green and shows bullish trend.
Adjust the input parameters as following for your preferred time frame :
4-Hr: Exponential, 15, 30
Daily: Exponential, 10, 20
Weekly: Exponential, 5, 10
FREE

ON Trade Pivots is A technical indicator that Draws all Pivot levels depending on time frame that defined in settings.
Notes It will be good tool for all traders who use pivot levels in their trades. Let me inform you that this indicator draw this level as buffers not as objects then you can connect it easily to EA. This indicator allow you to find pivots levels for any time frame not only daily you are free to choose time frame from settings.
Parameters Use_System_Visuals - Enable /Disable
FREE
MetaTrader Маркет - единственный магазин, где можно скачать демоверсию торгового робота и подвергнуть его проверке и даже оптимизации на исторических данных.
Прочитайте описание и отзывы других покупателей на заинтересовавший вас продукт, скачайте его прямо в терминал и узнайте, как протестировать торгового робота перед покупкой. Только у нас вы можете получить представление о программе, не заплатив за неё.
Вы упускаете торговые возможности:
- Бесплатные приложения для трейдинга
- 8 000+ сигналов для копирования
- Экономические новости для анализа финансовых рынков
Регистрация
Вход
Если у вас нет учетной записи, зарегистрируйтесь
Для авторизации и пользования сайтом MQL5.com необходимо разрешить использование файлов Сookie.
Пожалуйста, включите в вашем браузере данную настройку, иначе вы не сможете авторизоваться.