Guarda i video tutorial del Market su YouTube
Come acquistare un Robot di Trading o un indicatore
Esegui il tuo EA
hosting virtuale
hosting virtuale
Prova un indicatore/robot di trading prima di acquistarlo
Vuoi guadagnare nel Market?
Come presentare un prodotto per venderlo con successo
Indicatori tecnici gratuiti per MetaTrader 4 - 16

FREE FOR A LIMITED TIME ONLY!!! The Ultimate Indicator For Trading Trend This indicator clearly shows you the strength of the market in one direction or the other, which means that you can trade knowing you are either with or against the market. When used in conjunction with the +3R principles you are sure to have some serious results. The +3R Principles Routine - This is when you trade and how often Rules - This is the rule you follow Risk:Reward - This is the percentage amount of your accoun
FREE

Bigger chart labels would allow the user to be entirely aware of which chart he/she is on. Each chart window is unique, containing different patterns and economic motives so acknowledging the chart window would be absolutely essential! There are well known Economic Time Zones included in clear view, by choice! Simple does it! Use your computing mouse scroller, clicking with the right finger on the label, in order to customize the label properties. From there, choose your preferred color, fon
FREE

The purpose of this new version of the MT4 standard indicator provided in your platform is to display in a sub-window multiple timeframes of the same indicator. See the example shown in the picture below. But the display isn’t like a simple MTF indicator. This is the real display of the indicator on its timeframe. Here's the options available in the FFx indicator: Select the timeframes to be displayed (M1 to Monthly) Define the width (number of bars) for each timeframe box Alert pop up/sound/ema
FREE

This indicator provides trading signals based on the polarity of the dynamical parameters of two digital signals. The dynamical parameters (momentum-acceleration) are derived by applying a high quality momentum oscillator, MTEMA LPD ( see Top Gun Oscillators ) to two digital signals. The MTEMA momentum oscillator is first applied to the price itself. Then, a rectification procedure is applied to the price based on the signals from the momentum oscillator yielding a rectified price signal. This s
FREE

Highly configurable CCI indicator. Features: Highly customizable alert functions (at levels, crosses, direction changes via email, push, sound, popup) Multi timeframe ability Color customization (at levels, crosses, direction changes) Linear interpolation and histogram mode options Works on strategy tester in multi timeframe mode (at weekend without ticks also) Adjustable Levels Parameters:
CCI Timeframe: You can set the current or a higher timeframes for CCI . CCI Bar Shift: you can se
FREE

Indicador de Bandas de Fibonacci para Metatrader 4 . Este indicador funciona de forma similar a las conocidas Bandas de Bollinger clásicas, pero en lugar de usar la desviación estándar para trazar las bandas usa números de Fibonacci y el ATR (Average True Range). Puede usarse para trazar niveles de soporte y resistencia que pueden emplearse en sistemas de scalping de corto plazo y swing trading. Las bandas del indicador son calculadas de la siguiente forma: Línea central : Media móvil de n peri
FREE

Candle Counter This product counts the candles and shows the result according to the configuration defined by the user. Professional traders use it to emphasize a specific candlestick.
Settings Position - Choose whether the numbers will be displayed above or below the candle Distance - The distance that the number will have from the candle, referring to the minimum or maximum Font Size - Font Size Color - Font Color
FREE

We stopped creatin small tools for MT4. Our focus are on MT5. Only very useful tools maybe we will develop to MT5. New Candle Alert is a simple indicator that notify you when a new candle is formed.
You can modify the notification message that will appear for you. The alarm sound is default by meta trader program.
MT5 version: https://www.mql5.com/pt/market/product/37986
Hope you enjoy it. Any doubt or suggestions please notify on private or by comments.
See ya.
FREE

This version of the indicator works only in the tick data stream. In this way, we only see the current situation from the moment of launch. I recommend using the classic version Real-Time Currency Valuation . The indicator calculates currency strength of eight major and also can calculate strength of any other currency, metal or CFD.
Main Features It is able to display only the currencies that are currently necessary, thus not overloading you with unnecessary information and notifications. It
FREE

TradingInfo shows you detailed Information about your Account. It also shows you your Profit, Trades, Ratio and the Spread of current Chart. With integrated function "Draw Profit" you will get all your Orders drawn with Profit on the Chart. You can use it on any Chart and any Timeframe, also for manual Trading or an EA. With this powerful Tool you have a great overview of your Account.
TradingInfo Inputs Menu Background color - the color of menu Manu Label color - the color of the font Menu in
FREE

Indicator overview Trend indicator usage Moving averages. Highest quality alerts that need no introduction. It is completely loyal to the original algorithm and uses other useful features.
Easy to trade Carry out all kinds of notifications It's not a new paint and it's not a back paint. Setting Indicator SMA50 in Time frame H1 for any pair currency and Gold Spot. EMA200 in Time frame H1 for any pair currency and more than EMA250 for Gold spot. Using it for maximum benefit Set up notificatio
FREE

Fisher Yur4ik Indicator is a momentum indicator originated by Yuri Prokiev (Russian). I combined the Fisher Test indicator with other indicators to sieve/filter signals. It is not used as a standalone indicator but in combination to filter out Price Action signals. I have uploaded this indicator (Fisher test) for download alongside the 3Bar_Play signal indicator for signals to appear. It is free.
FREE

The indicator analyzes ADX and ATR data to define the current trend and allow traders to gain maximum profit from strong price movements. The indicator is intuitively clear: line direction change - trend direction change. Change of the line color warns of a coming direction change. Extended version of this indicator - Line on Osc . Customized parameters: Ind_Period (>1) - ADX calculation period; Sensitivity (>1) - ATR sensitivity. Alerts - show a dialog box containing user data; Send_Mail - send
FREE

Key Features: Type of Indicator: Line Break Chart Indicator Usage: Identifying trend reversals and potential market turning points. Input Parameters: The primary input parameter is 'Lines_Break,' which represents the number of lines the price needs to move to create a new line in the opposite direction. How it works: The indicator draws green and red histogram bars to represent the line break chart. Green bars indicate an upward trend, and red bars indicate a downward trend. The indicator calcul
FREE

BinaryWizardMT4 is a powerful indicator for trading short-term binary options. In fact, this is a ready-made trading system. The indicator calculates the reference point and a short-term support and resistance levels. After the current price crosses the resistance level, a sell signal is formed (SIGNAL: SELL). Similarly, after the price crosses the support line, a buy signal is activated (SIGNAL: BUY).
Parameters x1, y1 - binding coordinates of the indicator window to the upper left chart corn
FREE

Concept
Market arranges in Time upcoming Phases according to the present Results of its Interest. Directing Modulations are an Interaction of immanent Periods, which show in Reference to Time cyclic Activity and to Price leveling Activity. SensorMap is a reflecting Volume Mask of this Concept of Time and Price and apportioning developed Price Movements in an equalized 100 % - Range: how far moved ? indicating their Status by marking special Events: when which Action ? setting the Situation in
FREE

VR Ticks è un indicatore speciale per strategie basate sullo scalping. Grazie a questo indicatore il trader può vedere il grafico tick direttamente sul grafico principale dello strumento finanziario. Un grafico tick ti consente di inserire una posizione nel mercato o chiudere una posizione nel mercato nel modo più accurato possibile. VR Ticks traccia i dati dei tick sotto forma di linee che cambiano colore a seconda della direzione: ciò consente di comprendere e valutare visivamente la situazion
FREE

Time to Trade Trading timing indicator is based on market volatility through 2 ATR indicators to determine the timing of a transaction. The indicator determines the times when the market has strong volatility in trend. When histogram is greater than 0 (blue) is a strong market, when histogram is less than 0 (yellow) is a weak market. Should only trade within histograms greater than 0. Based on the histogram chart, the first histogram value is greater than 0 and the second histogram appears, this
FREE

Having to check constantly if your Stochastic has reached a specific level can be tedious and draining at times, especially if you have to monitor different asset classes at a time. The Alert Stochastics indicator will assist in this task, ensuring that you get the most with little effort. When the Stochastic values get to a specified level, the alerts will go off, on the chart, on the MT4 phone app or via email (You can receive text messages to your phone if you activate texts on your Gmail acc
FREE

An indicator for visualizing time ranges of key trading sessions: Asian, European, and American. The indicator features functionality for setting the start and end times of each trading session, as well as an adjustable timezone of the trading server. The main advantages of the indicator include the ability to operate with minimal CPU load and memory usage. Moreover, it offers the option to specify the number of displayed historical days, providing the user with flexible market dynamics analysis
FREE
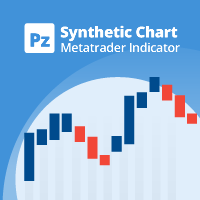
This indicator creates synthetic charts. It creates a candlestick chart plotting the price of one instrument measured against another, helping you to find hidden opportunities in the market crossing relationships between different instruments. [ Installation Guide | Update Guide | Troubleshooting | FAQ | All Products ] Find hidden trading opportunities Get a broader sense of the price of commodities Commodities range against each other and are easier to trade Correlated Indices can be traded ag
FREE
Enhance your trading strategy with this indicator from tr1cky.com . When the indicator turns red - Hold off When the indicator turns green - Proceed with the trade in the direction indicated by the indicator This indicator provides insights into the market’s momentum and the optimal trading direction. Derived from its successful Expert Advisor counterpart, the RSIMFI100 go indicator is now available to all. Happy trading!
FREE

Vertical time lines. A simple indicator that draws on the graph vertical lines of time. 1,3,5,10,12,15,20,30,60 minutes. You can change the line color, line style, select a time period from 1 to 60 minutes. Applies to any chart, timeframe. Incoming parameters: Minute_Num = 20; // step 3,5,12,10,20,15,30,60 minutes color Line_Color = clrYellow; // color line Line_Dash = 2; //0,1,2,3,4... solid, dash, dot, dash dot,dash dot dot
FREE

This is the countdown of the last candle Indicator. How much time remains in the current candle of your chart CTime display exactly how many hours, minutes and seconds remain before the current candle closes, and a new one opens. This allows you to be on the ball as soon as the next candle appears It could be useful for a trader who trades with candles as the main attention Available option to change the text color to suit the chart background. This Indicator is related to the system here .
FREE

Pip Show - MultiStrategy Trading The indicator is for free and you have to install it before you can use the Pip Show - MultiStrategy Trading EA. The use of the indicator is very simple, on green open buy positions and on red open sell positions. Its based on a MA calculation. Check out my fully automatic trading robot multistrategy-trading.com It has four parameters: Period, Divisor ("speed"), Price and TimeFrame Period - how many candles , backwards, are calculating Divisor - how "quick" is
FREE

This is Fibo Expansion. You can use it, as profit target at any level... It use price Highs and Lows and price between... It is simple and easy to use... No Input menu, just drag it on your chart and it ready to use... The blue and red dot color indicate it direction... It also use as the same as fractal high and low price as the points to construct the levels... No more analysis to choose the points..
FREE

You've probably heard about the Dow trend Theory, where higher highs and lows indicate an uptrend, and lower highs and lows indicate a downtrend. This indicator determines this trend based on the Dow Theory. You just need to enter a number representing the number of candles between extremes. The optimal solution is the number 3, unless you want to have the trend from M5 but you're on M1, then you need to multiply this number by 5. Check various combinations to trade with the trend. In the scree
FREE

The BuySellAlert free arrow indicator is developed based on the use of HMA, Laguerre, CCI, and ATR. The BuySellAlert free arrow indicator: generates possible entry points for BUY and SELL ; displays current profit ; displays current spread. The profitability of the indicator is shown in the screenshot on the example of the GBPUSD pair Does not redraw and works on opening bar. Timeframes - M1-H1. Recommended TimeFrame-M15. The BuySellAlert free works only with AUDUSD . Version without restric
FREE

Rua Pinbar This is an indicator to help you quickly identify pinbar candles in the chart. Can be used on any currency pair and any time frame you want. This indicator is often used to determine entry points. You can refer to the product here: https://www.mql5.com/en/users/phamruacoder/seller
A product of Ruacoder Get code indicator and robot (EA) as required.
FREE
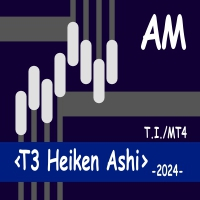
Implementation of the classic Heiken Ashi indicator using the T3 smoothing method. The indicator allows you to select the smoothing depth and the smoothing shift relative to the current price. The indicator also allows you to select the price at which the data will be smoothed, as well as the control price with which comparison is made. The proposed approach allows you to visualize the trend and simplify trading decisions.
FREE

This indicator smoothes the value of CCI (Commodity Channel Index) and reduces its volatility. By using this indicator, the fluctuations created by the CCI indicator are reduced. The smoothed CCI value is placed in a buffer that you can use in your EA and strategy. Leave me a comment if you want By using this indicator, you no longer need to use the Moving Average indicator on the CCI indicator.
FREE
MA intersection indicator.
At a selected period, the indicator finds the best of the periods MAs on profit with considering the ratio of losses and profits. (Auto-optimizing MA) Entering a long position is the cross of fast MA from the bottom to up through long MA.
For a short position - vice versa.
The best of the periods is displayed. MAs are also drawn.
In the settings, it is possible to select the period of bars / candles for find better solution.
Also, the time period of the upda
FREE

Introduction and Description
Colored candlesticks showing the trend based on two moving averages and the slope of the slow moving average. A trend is the overall direction of a market or an asset's price. In technical analysis, trends are identified by trendlines or price action that highlight when the price is making higher swing highs and higher swing lows for an uptrend, or lower swing lows and lower swing highs for a downtrend. Many traders opt to trade in the same direction as a trend, whi
FREE
The indicator shows the time of formation of the current bar in a percentage ratio.
Indicator Properties color_back1 - background color 1 color_flat1 - color of borders for background 11 color_back2 - background color 2 Alert_Percent - percent value for a sound alert Sound_file - the name of the sound file, the file must be located in the terminal_directory/Sounds and have the .wav extension
FREE

KFX SMA: Symbol Changer + Moving Average (3x) + ATR + RSI + Candle Timer.
This indicator allows you to create a Symbol list and change between symbols of the current chart or Timeframe by selecting the appropriate button. On Chart there are three(3) multi timeframe Moving Averages shown (selected by you), ATR Value MTF ( selected by you - helps with setting SL and TP), RSI Value MTF (selected by you) and a Candle Timer. Features: - Symbol Changer : Change Symbol and Timeframe of Chart. (
FREE

Live Pivots Indicator Time Frame: Suitable for any time frame. but recommended time frame 30M and above. Purpose of this indicator: Trend Prediction. Buy: When the candle crossed above the golden pivot line its buy call, TP1-R1, TP2-R2, TP3-R3. SELL: When the candle crossed Below the golden pivot line its sell call, TP1-S1, TP2-S2, TP3-S3. Happy trade....
FREE

As the title says, this is an indicator that shows the current open market (session). It has 4 sessions with customizable schedule : 1. London session, 2. New York session, 3. Sydney session, 4. Tokyo session.
Indicator inputs: - The color of each session. - The open time and close time of the sessions. - The line width.
The objective of the indicator, is to follow each sessions, observe at what times are multiple sessions open, and thus take the chance of the high market movements.
FREE
The purpose of this new version of the MT4 standard indicator provided in your platform is to display in a sub-window multiple timeframes of the same indicator. See the example shown in the picture below. But the display isn’t like a simple MTF indicator. This is the real display of the indicator on its timeframe. Here's the options available in the FFx indicator: Select the timeframes to be displayed (M1 to Monthly) Define the width (number of bars) for each timeframe box Alert pop up/sound/ema
FREE

The YK-LOT-SIZE is an indicator that displays the total Lot Size and profit/loss of all trade orders for the current symbol on the price chart. It has the following features: Shows the total Lot Size of buy orders (BUY) and sell orders (SELL) on separate lines. Displays the profit/loss of buy orders (BUY) and sell orders (SELL) by calculating the sum of profit, commission, and swap. Users can customize the color of the displayed text through the input parameter. The information is displayed at t
FREE

Unisciti al Canale Koala Trading Solution nella comunità MQL5 per scoprire gli ultimi segnali, le notizie su tutti i prodotti Koala. Il link per unirti è il seguente: https://www.mql5.com/en/channels/koalatradingsolution Descrizione:
siamo felici di presentare il nostro nuovo indicatore gratuito basato su uno degli indicatori professionali e popolari nel mercato forex (PSAR) questo indicatore è una nuova modifica sull'indicatore SAR parabolico originale, nell'indicatore pro SAR puoi vedere
FREE
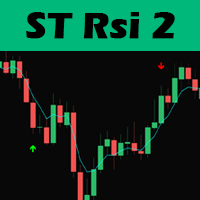
Hello traders, this trading strategy is based on the the Larry Connors RSI-2 strategy, We begin with a 200 periods EMA to find the direction of the market. This is important because we only trade in the main trend direction.
We then look for pull backs using the RSI with a period of 2 to get entry signals. Trades are then exited using the 5 EMA.
Lot size should be calculated using 1% of 1 the ATR value and positions can be added as long as the entry criterion is met.
TRADING IS RISKY AND
FREE

The indicator calculates running total of linear weighted returns. It transforms rates into integrated and difference-stationary time series with distinctive buy and sell zones. Buy zones are shown in blue, sell zones in red. Parameters: period - number of bars to use for linear weighted calculation; default value - 96; smoothing - period for EMA; default value - 5; mode - an integer value for choosing calculation mode: 0 - long term trading; 1 - medium term trading; 2 - short term trading; defa
FREE
The presented indicator is essentially a separate trading system. The indicator independently determines entry points and points for setting protective stop orders. This product can be useful for both beginners and experienced traders, since it is developed on the basis of solutions proven by time and by professional traders. On fully formed bars the indicator is not redrawn. The indicator has the ability to send notifications to the terminal and email. Technically, the indicator is a system of
FREE

This indicator shows the strength of each currency compared to the US dollar by calculating the rate of change in price over a specified time period. When you open the indicator, you'll see a list of different currencies on the price chart. Each currency will have a numerical value indicating its strength level compared to the US dollar, where: If the value is higher than the US dollar, it will be displayed in green, meaning that currency is stronger than the dollar. If the value is lower than
FREE

Индикатор "Buy Sell zones x2" основан на принципе "остановка/разворот после сильного движения". Поэтому, как только обнаруживается сильное безоткатное движение, сразу после остановки - рисуется зона покупок/продаж. Зоны отрабатывают красиво. Или цена ретестит зону и улетает в космос, или пробивает зону насквозь и зона отрабатывается с другой стороны так же красиво. Работает на всех таймфреймах.
Лучше всего выглядит и отрабатывает на Н1.
Может использоваться как: индикатор зон, где лучше
FREE

Indicator showing the breakout after at least X candles of the same sign, followed by an opposite candle. PARAMETERS: BARS TO SHOW = Story of Indicators (0 = all bars) Consecutive Bars for Breakout = How many Bars of the same direction and after a Bar with opposite direction Minimu Point between H/L = To consider a bar valid, she must have a Minimun Hi/Lw value Minimu Point between O/C = To consider a bar valid, she must have a Minimun Open/Close value Graphics are self-explanatory
FREE
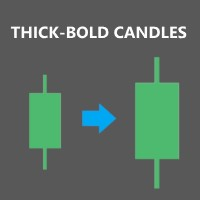
Description: Expand the width of your candles horizontally in MT4 to improve visibility when zooming in or out of the chart. Once attached to the chart, the indicator will automatically double the size of the candles compared to their normal value. Main indicator inputs: Body: size of the candle body Wick: size of the candle wick Additionally, you have the option to change the color of the candle body. We hope you find this free and useful indicator enjoyable!
FREE

Trend is Friends is an line Indicator used as an assistant tool for your trading strategy. The indicator analyzes the standard deviation of bar close for a given period and generates a buy or sell trend if the deviation increases. It good to combo with Martingale EA to follow Trend and Sellect Buy Only/Sell Only for EA work Semi-Automatic. You can use this Indicator with any EAs in my Products.
FREE
This indicator is a classic indicator of technical analysis - MACD. Unlike the classic MACD indicator, the presented indicator is calculated as follows: - the first smoothing signal is one of the standard methods used to create moving averages. - secondary smoothing method used in MAMA/FAMA indicators. - calculation of the difference between MAMA/FAMA values.
The indicator gives signals about a change in trend direction, as well as signals about weakening or strengthening of the trend. The ind
FREE

Now there is no need to check volatility on third-party websites in order to determine the average movement rage of a certain currency pair. The Truly Volatility indicator is designed for determining volatility for the specified period and is displayed in a separate window as a histogram and line. If attached to a chart with the Н1 timeframe, the indicator displays the average price movement for each hour (from 0 to 23) based on the history data. On the D1 timeframe it displays the average movem
FREE

This indicator is an interpretation of the values of the classic indicator - RSI. A filter is used to smooth the sharp fluctuations of the indicator values, eliminating the weak changes and focusing the trader's attention on strong fluctuations of values. The indicator is not redrawn on completed bars. For greater efficiency of this indicator, it should be used in conjunction with the indicators that identify the trend direction, as well as support/resistance levels. Signals: Histogram crossing
FREE

Candle Pattern Alert indicator alerts when the last price closed candle matches the set input parameters. You can choose to scan through all the symbols in Market Watch or enter your favorite symbols and also you can enter time frames you need to scan. --------- Main settings- ------- Select all symbols from Market Watch? - if Yes the program scans through all the symbols displayed in Market Watch, if No - only selected in next input symbols are scanned
Enter symbols separated by commas - enter
FREE

This indicator displays the historical bid and ask prices on the chart. This is an extremely useful tool for watching the spread rise and fall, as well as watching to see whether or not the bid and ask prices are converging or diverging. This tool will allow you to enter the market at just the right time. This indicator will help you stay out of the market when the spread begins to rise and help you get into the market as the spread begins to fall again.
ON SALE FOR FREE, GET IT FREE FOR A LIM
FREE
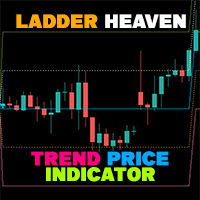
If you have difficulty determining the trend as well as entry points, stop loss points, and take profit points, "Ladder Heaven" will help you with that. The "Ladder Heaven" algorithm is operated on price depending on the parameters you input and will provide you with signals, trends, entry points, stop loss points, take profit points, support and resistance in the trend That direction.
Helps you easily identify trends, stop losses and take profits in your strategy!
MT5 Version: Click he
FREE
This indicator allows to hide ZigZag indicator (on all MT4 timeframes) from a date define by the user with the panel ("Hidden Candles"). This indicator can be use with other "Hidden Indicators". Indicator Inputs: Depth Deviation Backstep Information on "ZigZag" indicator is available here: https://www.mql5.com/en/articles/1537 ************************************************************* Hey traders!! Give me your feeds! We are a community here and we have the same objective.... make some mo
FREE

The Flag Streamer Pattern indicator is an indicator designed to find flag and pennant patterns. When the legend finds patterns, it draws lines on the graph screen. Magenta lines represent the streamer pattern. Aqua colored patterns represent the flag pattern. You can change the pattern colors according to your request. Our Popular Products Super Oscillator HC Cross Signal Super Cross Trend Strong Trend Super Signal Parameters fs- =======Channel Trend Setting===== Channel - Channel period setting
FREE

I trend sono come il "Santo Graal dei trader": possono darti un win rate più elevato , un migliore rapporto rischio-rendimento , una gestione della posizione più semplice e molto altro ancora... Ma è davvero difficile determinare l'andamento con precisione per via dei segnali falsi; soprattutto se si vuole mantenere il giusto tempismo per poter captare in anticipo movimenti massicci.
Ecco perché ho creato il Trend Validator: uno nuovo software GRATUITO che renderà l' identificazione dei tren
FREE

The indicator still has a few bugs but is ready for testing.
This is my first indicator that determines entry and exit points. The entry point is based on breaking the peaks determined by a channel indicating highs and lows (invisible channels). TP1 is a probable target at which most positions can be closed. The channel determining the opening and closing of positions is based on different assumptions. The red stop loss line is determined based on lows and highs.
The stop loss can be adjusted
FREE

Super Channels indicator is a channel indicator created by calculating support and resistance levels. It calculates by taking the average of support and resistance levels. After determining the number of candles, it takes the levels of the number of candles and creates an autonomous channel according to these levels. If you want to calculate how many candles, you must enter the number in the parameter section. Also, there are two types of modes in the indicator. The first is to calculate based o
FREE
Vertical Lines for Hour - Time-Based Trading Indicator The Vertical Lines for Hour indicator allows you to mark up to 4 vertical lines at specific times on your chart. Simply enter the hour without considering the minutes, and you can also choose the color for each line. This indicator is useful for identifying session ranges or implementing custom trading strategies. It provides a straightforward solution for your trading needs. Key Features: Mark up to 4 vertical lines at specified times. Sele
FREE
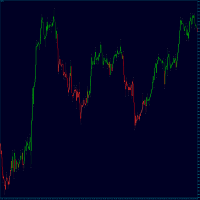
TrendFinder RSI are Colored candlesticks showing the trend based on The Relative Strength Index (RSI) This indicator will give you the color change on the next bar on the confirmation candle and will never repaint TrendFinder RSI is optimize to trade on any market and to be used trending and None trending markets. For best results use this indicator as an extra tools after you have completed your regular analysis and use it for alerts based on such analysis.
FREE

Pivot levels is indicator showing 7 pivot levels. It is adjusted for major use, including: all standard time frames
choice of periods to show three popular calculation formulas (typical, median, weighted) 9 level Camarilla pivot
pivot day shift choice of properties for lines and labels choice of showing alerts when crossing pivot lines Parameters: ----------Main parameters----------- Timeframe - time frame for pivot levels
Number of periods to show - displays pivot levels for number of period
FREE

This indicator helps you to scan all symbols which are in the Market Watch window and filter out a trend with alerts. It works on five most effective indicators which are used by most of traders for trading: Moving Average Average Directional Moment (ADX) Relative Strength Index (RSI) Parabolic SAR MACD It calculates two bars for scanning. When box colour changes to coral or royal blue colour, it indicates you for trend change for long and short entry. And also you will get alert on screen. When
FREE
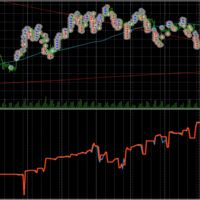
Graph shows your balance and equity in real time similar to the tester graph which is nice to see your real progress vs tester graph. This code was copied from mql5.com, it was free and it works im just putting it here to make it easier for us :-) https://www.mql5.com/en/code/13242
https://www.mql5.com/en/code/8454 .. original code
//+------------------------------------------------------------------+
//| Equity Monitor |
//| Monitori
FREE

This indicator is a useful tool for visualising cyclic components in price. It calculates the Discrete Fourier Transform (DFT) of a price chart data segment selected by the user. It displays the cycles, the spectrum and the synthesised signal in a separate window. The indicator is intended as a learning tool only, being unsuitable for providing actual trade signals. Download the file - it is a free toy. Play with it to understand how signals can be transformed by controlling their cyclic comp
FREE
The indicator shows the High and Low levels of candles for timeframes selected in the settings. It is recommended to use it on smaller timeframes to determine the levels of higher timeframes.
Parameters TYPE_LINE - type of the line (short based on the bar time, or long for the entire chart) ============= TF 1 ============= block of lines for the first timeframe TF_1 - timeframe of the first block of lines Bars_1_from=1 - Bar of the beginning of the line of the corresponding Timeframe. Bars_1
FREE

RaysFX EMA Crossover Scopri i potenziali punti di inversione del mercato con l’indicatore di Crossover EMA di RaysFX. Questo indicatore utilizza una combinazione di due medie mobili esponenziali (EMA) - una più veloce e una più lenta - per identificare i possibili punti di ingresso e uscita. Caratteristiche principali : Due EMA : Utilizza una EMA più veloce e una più lenta per catturare i movimenti di mercato a breve e lungo termine. Segnali di crossover : Genera un segnale quando l’EMA più v
FREE

This indicator identifies short-term, medium-term and long-term highs and lows of the market according to the method described by Larry Williams in the book "Long-term secrets to short-term trading".
Brief description of the principle of identifying the market highs and lows A short-term high is a high of a bar with lower highs on either side of it, and, conversely, a short-term low of a bar is a low with higher lows on either side of it. Medium-term highs and lows are determined similarly: a
FREE

Smart Trend Line Alert Demo is a unique professional Trend Line, Support Line and Resistance Line Touch and Break out Alert with awesome Alert History feature, designed to help traders easily manage many charts and symbols without staring at the monitor. Note: This a Demo version operating only on USDCHF . Full version link: https://www.mql5.com/en/market/product/3085
Features Candle Break Out Alert, Price Touch Alert and Time Line Alert; 1 click for converting any drawn line into an alert lin
FREE

The Sextet is an MT4 indicator that displays 6 levels of Moving Averages, where the second is the moving average of the first, the third of the second, and so on. It gives a signal when all the moving average levels align in order. Get a Free Sextet EA, and read discussions about using The Sextet Indicator on Forex Factory:
The Sextet EA @ Forex Factory Check out the The Sextet Scalper Pro for a more elaborate scalping strategy also with Free EA . Key Features: Is a Moving Average of a Movi
FREE
Il MetaTrader Market è il posto migliore per vendere robot di trading e indicatori tecnici.
Basta solo sviluppare un'applicazione per la piattaforma MetaTrader con un design accattivante e una buona descrizione. Ti spiegheremo come pubblicare il tuo prodotto sul Market per metterlo a disposizione di milioni di utenti MetaTrader.
Ti stai perdendo delle opportunità di trading:
- App di trading gratuite
- Oltre 8.000 segnali per il copy trading
- Notizie economiche per esplorare i mercati finanziari
Registrazione
Accedi
Se non hai un account, registrati
Consenti l'uso dei cookie per accedere al sito MQL5.com.
Abilita le impostazioni necessarie nel browser, altrimenti non sarà possibile accedere.