Смотри обучающее видео по маркету на YouTube
Как купить торгового робота или индикатор
Запусти робота на
виртуальном хостинге
виртуальном хостинге
Протестируй индикатор/робота перед покупкой
Хочешь зарабатывать в Маркете?
Как подать продукт, чтобы его покупали
Бесплатные технические индикаторы для MetaTrader 4 - 11

Этот осциллятор стал одним из основных инструментов большинства профессиональных трейдеров. Индикатор включает в себя классическую MACD ( Moving Average Convergence/Divergence ) линию, сигнальную линию, а также гистограмму MACD. В расчете используются экспоненциальные скользящие средние. Так же в индикаторе предусмотрена возможность включения сигналов о нахождении дивергенций между графиком цены и индикатором. Поиск дивергенций происходит по трем паттернам: классическая, скрытая и расширенная ди
FREE

Fibonacci SR Indicator Индикатор рисует линии поддержки и сопротивления. Продукт основан на уровнях коррекции и расширения Фибоначчи (Fibonacci Retracement and Extension levels). Индикатор учитывает многочисленные комбинации уровней Фибоначчи и рисует линии поддержки/сопротивления. При этом в расчетах используются значения вершин и оснований, построенных индикатором ZigZag. При необходимости ZigZag также может быть отображен на графике. Индикатор учитывает многочисленные комбинации предыдущих то
FREE

The indicator monitors price movements in relation to a dynamic trailing stop line derived from the Average True Range (ATR). The trailing stop line adjusts based on market volatility, with the ATR determining the distance of the stop from the current price. This allows the stop to widen during periods of high volatility and tighten during calmer market conditions. The indicator tracks how the price interacts with this trailing stop line, marking potential reversal points when the price crosses
FREE

AC Pivot Panel:
AC Pivot Panel is a pivot point indicator including favorite selection panel accessible in the chart. For pivot traders, it is well convenient to easily and quickly can adjust their pivots setting in the chart. To reaching this goal, a panel has been considered to user can easily switch to each pivot levels by different method and time period. In the current version: All pivots including supports and resistance can be selected to display or disappear in the chart just by
FREE

Quantum Swing 1.Что такое Quantum Swing ? Индикатор рассчитывает и отображает будущие ценовые уровни , на основе квантовой математики с высокой точностью вероятности и направления . Уровни отображаются в виде зон принятия торговых решений , чётко определяют узкий диапазон цен для выставления ордеров с минимальным стоп-лоссом и максимальным тейк-профитом. Индикатор отображает будущие торговые зоны на разных таймфрэймах H1 , H4 , D , W . Квантовые свинги так же отображаются без привязки к време
FREE

Check my p a id tools they work perfect please r ate Adjustable PIN BAR indicator is usefull tool alowing to search for pin bars you wish to find on the price chart, it has 2 parameters to filter out what type of pin bars you wish to search for: 1) MinTailProc 75% (default) which means to show pin bars that has minimum size of the Nose (Tail) as 75% of full candle size. If Upper Nose (Tail) size of the candle is minimum 75% of the candle size fully than candle is painted in RED. If Lower Nose
FREE

Sync Cursor MT4 Sync Cursor MT5 https://www.mql5.com/en/market/product/118259 MT4 Tool will It make the Horizontal Line + Vertical Line in the Screen That it is always present on the screen and that it moves along with the candle (with the price). I am sure that something so simple will be a Treasure in the hands of many people. Some of my personal trades are posted voluntary and free of charge in this Public channel https://t.me/FXScalpingPro Contact: https://t.me/TuanNguyenTrader
FREE

Введение в алгоритм GARCH Improved Nelder Mead GARCH - это сокращение от Generalized Autoregressive Conditional Heteroskedasticity (Обобщенная авторегрессионная условная гетероскедастичность). Представляет собой модель прогнозирования волатильности, обычно применяемую в финансовой сфере. Модель GARCH впервые появилась в работе датского экономиста Тима Петера Боллерслева (Tim Peter Bollerslev) в 1986 году. Лауреат Нобелевской премии 2003 года Роберт Ф. Энгл внес огромный вклад в усовершенствовани
FREE
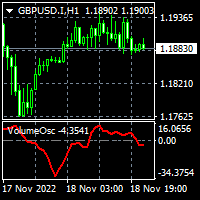
To download MT5 version please click here . The Volume Oscillator measures volume by analyzing the relationship between two Moving Averages. The Volume Oscillator indicator subtracts a fast MA from slow MA. The fast and slow MA periods are configurable via input tab. Volume indicators are an ingredient of trading systems to avoid entry in thin liquidity markets. Having set a threshold on Volume Oscillator you can avoid entering chop. Buffers are available to access via EA.
FREE

Tired of using the same technical indicators? The "Tekno RSI" is an innovative tool designed to make the interpretation of the Relative Strength Index (RSI) more intuitive and accessible to traders of all levels. It displays the RSI as a 3-color histogram, providing a clear and intuitive visual representation of market conditions.
1)Key Features 3-Color Histogram: RSI is a versatile indicator providing insights into market direction and potential reversal points. However, when analyzing the ch
FREE

Concept
Market arranges in Time upcoming Phases according to the present Results of its Interest. Directing Modulations are an Interaction of immanent Periods, which show in Reference to Time cyclic Activity and to Price leveling Activity. PointZero is a projecting Price Mask of this Concept of Time and Price and categorizing developed Price Movements related to their own Range: how far moved ? indicating their Status by marking special Events: when which Action ? setting the Situation in a fu
FREE

Nermal Round Levels is an indicator of round numbers in the form of a grid drawing horizontal lines. You can use it in many ways ... as it could be activating for an expert advisor to enter the market, confirmation of entry for your strategy, entrance area, mark areas of important levels, possible rebounds and others. Place it in your chart and verify as the price respects those round levels.
Inputs GridSpace linecolor lineStyle
FREE

Introduction The ST Cross indicator is based on the traditional Moving Average (MA) Cross which uses a fast and slow moving average. Entry signals to buy and sell are given when both moving averages cross. However with the basic strategy there are a lot of false signals. In order to filter the trades we use the 200 (MA) to identify the overall direction of the trend. Input Settings Master Trend Period - 200 Period moving average used to get the trend direction. Fast
FREE

This indicator is designed based on the Moving Origin indicator
When the moving origin indicator breaks the price, this indicator gives a signal
It is useful for better viewing of signals and analysis on them
Attributes: Can be used in all symbols Can be used in all time frames Too many signals Simple and quick settings Easy way to work
Settings: period: like moving average settings alarmShow: If you want to receive an alert in Metatrader after receiving the signal, enable this setting
a
FREE
Signal Trend Super
Индикатор точного входа в рынок. Очень хороший индикатор входа для вашей торговой системы, рекомендую использовать совместно с - System Trend Pro или Professional Trade Arrow
Индикатор не перерисовывается и не изменяет свои данные.Дождитесь закрытия свечи.
Остались вопросы? нужна помощь?, я всегда рад помочь, пишите мне в личные сообщения или В телеграмм
FREE

QuantumAlert CCI Navigator is a free indicator available for MT4/MT5 platforms, its work is to provide "alerts" when the market is inside "overbought and oversold" regions in the form of "buy or sell" signals. This indicator comes with many customization options mentioned in the parameter section below, user can customise these parameters as needful. Join our MQL5 group , where we share important news and updates. You are also welcome to join our private channel as well, contact me for the pri
FREE

Индикатор анализирует ценовую структуру фракталов и определяет возможные точки разворотов рыночной динамики. Отлично подойдет при использовании в комбинации с другими типами индикаторов.
Преимущества:
Работает на всех инструментах и таймсериях, Не перерисовывает свои результаты, Настраиваемые цвета элементов индикатора, Отлично сочетается с любой трендовой стратегией, Регулировка силы фракталов.
MT5 версия -> ЗДЕСЬ / Наши новости -> ЗДЕСЬ
Стратегия:
AW Flexible Fractals - это индик
FREE

Индикатор My Big Bars (мои большие бары) показывает бары (свечи) более старшего таймфрейма. То есть, если открыт график с таймфреймом H1 (один час), индикатор "подкладывает" снизу график с таймфреймом H4, D1 и так далее. Используются следующие старшие таймфреймы: M3, M5, M10, M15, M30, H1, H3, H4, H6, H8, H12, D1, W1 и MN1. Индикатор автоматически подбирает только те старшие таймфреймы, которые больше текущего и кратны ему. Если открыт график с таймрфеймом M30 (30 минут), то среди старших таймфр
FREE

!!! В [CodeBase] я опубликовал Mql4 код индикатора. Качайте код бесплатно!!! (Вы должны адаптировать код при обновлениях терминала).
Этот индикатор - инструмент трейдера. На всех периодах и символах показывает движение стохастиков М1, М5, М15, М30, Н1, Н4 каждую минуту (шкала времени от текущей до -240 минуты, - это последние 4 часа). В Step_Stoch устранён недостаток стохастиков - запаздывание. Например, то что Н1 (или М30) после подьёма начал падать, на обычном стохастике Н1 Вы увидите через 6
FREE

Описание индикатора Если для торговли вам необходимо знать будущую волатильность, значит вам нужен этот индикатор! С Predictor of the ATR, ваша торговая система станет более совершенной. Данный индикатор предсказывает будущую волатильность, и делает это достаточно хорошо. Точность прогноза достигает 95%, и это на дистанции до 5 баров в будущее (на периоде H1). Средняя точность прогнозов составляет около 85%, количество прогнозированных баров ограничено вашей фантазией. Прогноз можно делать при
FREE

Stochastic RSI производит расчет стохастика на индикаторе RSI. Индекс относительной силы (RSI), разработанный Дж. Уэллсом Уайлдером, является известным импульсным осциллятором, измеряющим скорость и изменение ценового движения.
Особенности Находит ситуации перекупленности и перепроданности. Звуковое оповещение при достижении уровня перекупленности/перепроданности. Получайте уведомления по электронной почте и/или на мобильное устройство при обнаружении сигнала. Индикатор не перерисовывается. Во
FREE

Donchian channels are a tool in technical analysis used to determine the relative volatility of a market and the potential for price breakouts.
Can help identify potential breakouts and reversals in price, which are the moments when traders are called on to make strategic decisions. These strategies can help you capitalize on price trends while having pre-defined entry and exit points to secure gains or limit losses. Using the Donchian channel can thus be part of a disciplined approach to manag
FREE

About Waddah Multimeter (free): This product is based on the WAExplosion Indicator. It helps identify explosive market trends and potential trading opportunities. Waddah Multi-meter (Multi-timeframe) Check out the detailed product post here for scanner and multimeter both: https://www.mql5.com/en/blogs/post/758020
Please note that scanner is paid and multimeter is free.
Features: Waddah Trend Direction Trend Strength (above/below explosion line or deadzone) Trend Explosion Alert Alignment al
FREE

The " Multi Kernel Regression " is a versatile trading indicator that provides graphical interpretations of market trends by using different kernel regression methods. It's beneficial because it smoothes out price data, creating a clearer picture of price movements, and can be tailored according to the user's preference with various options.
What makes this indicator uniquely versatile is the 'Kernel Select' feature, which allows you to choose from a variety of regression kernel types, such
FREE

This indicator is an addition to "Trend Edges."
The "Trend Edges histogram" indicator determines whether the trend is rising or falling. It is suitable for any time frame (tested on DAX).
Find a trending pair, index or CFD. Additionally :
-Sound alert on trend change.
-Alert Notification
-Alert Notification on your mobile phone Check my other indicators.
FREE

Engulfing candlestick patterns are comprised of two bars on a price chart. They are used to indicate a market reversal. The second candlestick will be much larger than the first, so that it completely covers or 'engulfs' the length of the previous bar.
By combining this with the ability to look at trend direction this indicator eliminates a lot of false signals that are normally generated if no overall trend is taken into consideration
FREE
This is a custom indicator based on the Exponential Moving Average (EMA) angle, typically used to measure the trend angle of EMA lines. Here are the main parameters and functions of this indicator: Main Parameters: md1: Fast period for EMA, default value is 12. md2: Slow period for EMA, default value is 26. md3: Period for the MACD signal line, default value is 9. Functions: The indicator calculates the MACD indicator and categorizes data into different buffers based on the direction and angle o
FREE

False Breakout Stochastic to be used with our Elliott Wave Indicator as part of the overall strategy on trading the 5th wave.
As we cannot upload multiple files, we have listed this separately. False Breakout Stochastic is best used as a confirmation tool rather than the sole signal indicator The Elliott Wave Indicator Suite is designed around a simple but effective Swing Trading Strategy. The Indicator Suite is great for Stocks, Futures and Forex trading on multiple timeframes You can find the
FREE

Features:
- Moving Average Slope for Max Past Bars - Slope Period - Slope Thresholds - Multiple Slope Type options - See slope visually as a histogram - Info Panel Show/Hide Slope Calculations and Types:
The slope value is calculated using the Slope Period. Suppose Period is 5, it will check the MA value for bar (x) and bar (x+5). And find the slope angle between them.
Read detailed description about Slope Types and Settings here: https://www.mql5.com/en/blogs/post/747651
FREE
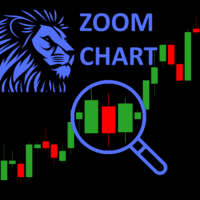
И ндикатор ZoomChart отображает в подокне данные с других таймфреймов на текущем графике, действуя как увеличительное стекло или, наоборот, уменьшает график для отображения более крупных таймфреймов. Индикатор ZoomChar автоматически отслеживает текущий крайний бар на графике и перемещается вместе с графиком при его сдвиге. Индикатор может отображать данные другого финансового инструмента, не ограничиваясь лишь инструментом главного графика.
Индикатор несёт в себе функцию "mirroring" -
FREE
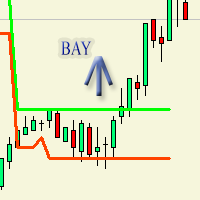
Индикатор изначально предназначался для торгового робота который в дальнейшем опубликуется. Рисует на графике флет. То-есть покой тренда. Очень отчетливо выражает флет по параметрам по умолчанию. flateWigth - допустимая ширина или разница между барами по которому индикатор будет засчитывать флет. Индикатор работает в реальном времени. Для наглядного просмотра работы можно запустить в тестере.
FREE
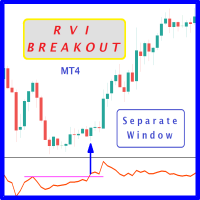
Probability emerges to record higher prices when RVi breaks out oscillator historical resistance level. It's strongly encouraged to confirm price breakout with oscillator breakout since they have comparable effects to price breaking support and resistance levels; surely, short trades will have the same perception. As advantage, a lot of times oscillator breakout precedes price breakout as early alert to upcoming event as illustrated by 6th screenshot. Furthermore, divergence is confirmed in case
FREE
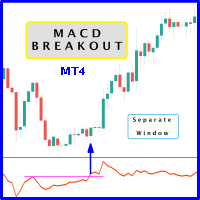
Probability emerges to record higher prices when MACD breaks out oscillator historical resistance level. It's encouraged to confirm price breakout with oscillator breakout since they have comparable effects to price breaking support and resistance levels; certainly, short trades will have the same perception. As advantage, many times oscillator breakout precedes price breakout as early alert to upcoming event as illustrated by second and third screenshot. Furthermore divergence is confirmed in c
FREE

Трендовый индикатор гибрид нескольких известных индикаторов, обрабатывающих данные последовательно с сигнализацией смены тренда. Конечная обработка данных индикатора АМка. Индикатор условно не рисующий - при перезапуске может изменить некоторые данные графика, но если его не трогать, то перерисовывать не будет. Возможно выдавать алерт, звук, посылать e-mail или сообщение на другой терминал при смене тренда.
FREE

Индикатор отображает в виде стрелок пересечение индикатора Скользящая Средняя Осциллятора (Moving Average of Oscillator, OsMA) нулевого уровня. В индикаторе есть уведомление при появлении сигнала - всплывающее окно (Alert), отправка на EMail.
Параметры Fast EMA Period - Быстрое EMA – скользящая средняя от цены, экспоненциального типа, с коротким периодом. Slow EMA Period - Медленное EMA – тоже экспоненциальная скользящая средняя рыночной цены, но уже с более длинным периодом. Signal SMA Period
FREE

Целью этой новой версии стандартного MT4 индикатора, входящего в поставку платформы, является отображение в подокне нескольких таймфреймах одного и того же индикатора. См. пример, приведенный на рисунке ниже. Однако индикатор отражается не как простой индикатор MTF. Это реальное отображение индикатора на его таймфрейме. Доступные настройки в индикаторе FFx: Выбор таймфрейма для отображения (от M1 до MN) Установка ширины (количество баров) для каждого окна таймфрейма Всплывающее оповещение/звуков
FREE
Price Action Indicator gives you reverse or even continous trend signals depending on your timeframe and Strategy used. !!!This is not a holy grail indicator and it will not give 100% winning rate!!! As you can see, it is not giving a lot of signals because of the price movements in side way (flat) trend. You can use it on every major currency pairs and even on indices. Please be aware of using this indicator with other strategies and indicators. Use MM and Risk Management properly. Sometimes
FREE

Целью этой новой версии стандартного MT4 индикатора, входящего в поставку платформы, является отображение в подокне нескольких таймфреймах одного и того же индикатора. См. пример, приведенный на рисунке ниже. Однако индикатор отражается не как простой индикатор MTF. Это реальное отображение индикатора на его таймфрейме. Доступные настройки в индикаторе FFx: Выбор таймфрейма для отображения (от M1 до MN) Установка ширины (количество баров) для каждого окна таймфрейма Всплывающее оповещение/звуков
FREE

Индикатор фрактал - один из основных в различных стратегиях. Индикатор Volume Fractals расширил функциональность стандартной версии, получил настройки фильтрации фракталов и отображение объемных фракталов, где объемный фрактал - это экстремум не только по цене, но и максимум по объему.
Применение Установка стоп-лоссов Сигнал на разворот Установка отложенных ордеров на пробой фрактала
Настройки Bars of history - количество баров графика, для которых рисуется индикатор Left side minimum bars -
FREE

ITS FREE I Recommend www.CoinexxBroker.com as a great broker and the one I personally use Asia session 1:00 to 9:00 (6pm est to 2 am est) Eur means London Session 10:00 to 18:00 (3 am est to 11 am est) USA means New York Session 15:00 to 23:00 (8 am est to 4 pm est) Session indicator highlights the start of each trading session. You can show all sessions or edit the settings to only show the hours you want highlighted (Asia) means Asian Session ,(Eur) means London Session , (USA) means New
FREE

FIBO ALERT https://www.mql5.com/en/market/product/34921
This indicator draws a fibonacci retracement (high and low) of a candle. It alerts and notifies the user whenever price touches or crosses the fibonacci levels. INPUTS ON Alert: set to true will alert pop up whenever price crosses levels at chart time frame. ON Push: set to true will send push notification to phone whenever price crosses levels at chart time frame. ===== FIBO (High & Low) ===== Time Frame: indicator draws fibonacci lev
FREE

BeST_ Classic Pivot Points is an MT4 Indicator that is based on the widely known and definitely classic Pivot Point of a market prices activity. A pivot point is calculated as an average of significant prices (high,low,close) from the performance of a market in the prior trading period. If the market in the following period trades above the pivot point it is usually evaluated as a bullish sentiment, whereas trading below the pivot point is seen as bearish. A pivot point and the associated suppo
FREE
FREE Spread indicator for MetaTrader 4 this indicator includes: -average spread -current spread -minimum spread -maximum spread
If you are interested in my products I recommend you visit my page where you can find: Experts Advisors: https://www.mql5.com/it/market/product/119456?source=Site+Profile indicators: https://www.mql5.com/it/market/product/120038?source=Site+Profile
I hope the spread indicator will be useful to you.
https://www.mql5.com/it/users/kappa05
FREE

Индикатор для Скальпинга на Рынке Форекс и Торговли Бинарными Опционами Этот индикатор разработан для скальпинга на рынке Форекс и торговли бинарными опционами. Сигнал появляется при открытии новой свечи. Рекомендации по применению: Для Бинарных Опционов : Рекомендуется открывать сделки при появлении сигнала на 1 свечу. Сигнал на покупку появляется, когда синий икс сменяет красный, а сигнал на продажу - когда красный икс сменяет синий, как показано на скриншотах. Для Рынка Форекс: Вход в сделку
FREE
Highly configurable Williams %R indicator. Features: Highly customizable alert functions (at levels, crosses, direction changes via email, push, sound, popup) Multi timeframe ability Color customization (at levels, crosses, direction changes) Linear interpolation and histogram mode options Works on strategy tester in multi timeframe mode (at weekend without ticks also) Adjustable Levels Parameters:
Williams %R Timeframe: You can set the current or a higher timeframes for Williams %R. William
FREE

Индикатор для определения направления тренда. Используется популярный индикатор Аллигатор Билла Вильямса. Показывает на одном графике состояние рынка всех таймфреймов. Как известно, основную прибыль на рынке Форекс трейдеры получают именно от торговли по тренду, а убытки чаще всего получают на флетовых участках рынка. Поэтому, чтобы получать прибыль на рынке Форекс, трейдер должен научиться легко и безошибочно определять трендовые участки рынка, а так же направление текущего тренда. Для этих цел
FREE

Introduction and Description
The indicator displays an arrow whenever a " Bearish Engulfing " is detected. The latter usually indicates the beginning of a downward trend. A bearish engulfing pattern is a technical chart pattern that signals lower prices to come. The pattern consists of an up candlestick followed by a large down candlestick that eclipses or "engulfs" the smaller up candle. The pattern can be important because it shows sellers have overtaken the buyers and are pushing the price m
FREE

Индикатор BB Arrows MTF построен на основе индикатора Bollinger Bands . Представляет собой сигналы на вход в виде стрелок. Все сигналы образовываются на текущем баре. В 2 режимах Сигналы не перерисовываются (Исключение очень резкие скачки) ! Все сигнала в режиме MTF, соответствуют сигналам того периода, который указан в MTF. Максимально упрощен в использовании как для торговли исключительно одним индикатором, так и для использования индикатора в составе Ваших торговых систем. Особенностью ин
FREE

The "MACD Trend Follower" is an indicator based on the MACD oscillator. It serves to spot the trend direction by giving it a fixed color until the trend changes (the trend direction colors are customizable). The default MACD settings for the indicator has been changed to adapt to the fast moving Forex market, but they can be changed to suit the trader.
Recommended settings for the indicator : - MACD Fast EMA : 8 Periods. - MACD Slow EMA : 13 Periods. - MACD SMA : 5 Periods.
Indicator inputs
FREE

Данный индикатор автоматически рисует трендовые линии по нижним и верхним точкам экстремума с помощью индикатора ZigZag. По мере движения рынка индикатор постоянно обновляет линии на графике. Он может работать на любом типе счета или графике. Все параметры можно отрегулировать.
Настройки: Delete_Lines - При значении true индикатор будет удалять старые трендовые линии по мере формирования новых точек экстремума индикатора ZZ. При значении false старые трендовые линии удаляться не будут. Num_ZZ_
FREE

Индикатор рисует уровни Фибоначчи с выделенными Ценовыми метками.При установке индикатора на график необходимо создать трендовую линию с именем указанным в поле" Unique name of trend line to place fib on ". По умолчанию имя=" Unique name of trend line to place fib on" = "+" .В индикаторе можно заменить уровни фибоначчи по своему усмотрению.Также меняются цвет,стиль,толщина линий и т. д.
FREE
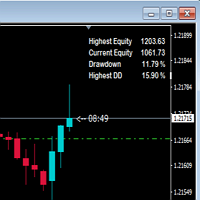
This indicator shows drawdown based on highest equity. Usually drawdown is used to show performance of a trading account especially when someone participate in a trading contest. If drawdown exceed a determined number, the contest account will be disqualified. So, I hope, this indicator will warn us in maintaining the drawdown and the account still be saved.
FREE

"Drivers Road Bands" indicator that is designed to be used in the 1H, 4H and 1D timeframes in the most ideal way. If we compare timeframes to roads and streets; main streets and highways with high traffic volume are similar to high-time timeframes in technical analysis. If you can interpret the curvilinear and linear lines drawn by this indicator on the graphic screen with your geometric perspective and develop your own buy and sell strategies; you may have the key to being a successful trader.
FREE

Рекомендуемый таймфрейм - H1! Индикатор имеет два вида сигнала. Это сигнал на открытие позиции от появления стрелки Выход цены за пределы канала В первом случае индикатор строит стрелки на основании построенного канала и лет Bollinger Bands. В другом случае трейдер может торговать, если цена просто вышла за пределы канала. Если цена выше канала - продаем. Если цена ниже канала, то можно искать место для покупки. Можно использовать и как сигнал для закрытия ранее открытого ордера. Индикатор не пе
FREE

Индикатор IceFX Heatmap показывает участки на графике, на которых цена наиболее долго оставалась в боковике в пределах последних нескольких дней. Такие участки отображаются в стиле тепловой карты ("Heatmap style"), наглядно демонстрируя основные уровни. Участки, на которых цена задерживалась наиболее долго, показаны более светлым цветом (при черно-белом отображении) или красным цветом (при цветном отображении).
Настройки Days - количество дней, для которых рассчитывается тепловая карта. Resolu
FREE

Bollinger Bands Breakout Alert is a simple indicator that can notify you when the price breaks out of the Bollinger Bands. You just need to set the parameters of the Bollinger Bands and how you want to be notified.
Parameters: Indicator Name - is used for reference to know where the notifications are from Bands Period - is the period to use to calculate the Bollinger Bands Bands Shift - is the shift to use to calculate the Bollinger Bands Bands Deviation - is the deviation to use to calculate
FREE

После 7 лет я решил бесплатно поделиться некоторыми своими индикаторами и экспертами.
Если они вам понравятся, пожалуйста, Поддержите 5-звездочным рейтингом! Ваш отзыв поможет продолжать выпускать бесплатные инструменты! Смотрите другие мои бесплатные инструменты и мои живые сигналы здесь здесь
_________________________________ Детектор Поглощения - Упрощенный Индикатор Трейдинга Откройте для себя Детектор Поглощения, простой инструмент, созданный на MQL4 для идентификации мо
FREE
Индикатор подает сигналы на открытие позиции. Принцип работы - сравнение текущей цены закрытия с диапазоном цен закрытия за больший период. Подтверждением сигнала считается преодоление ценой максимума/минимума бара на котором индикатор подал сигнал. Сопровождение открытой позиции ведется на меньшем TF. Сигналы индикатора на открытие противоположной позиции на меньшем TF являются сигналом к закрытию сделки. Индикатор не перерисовывается и не пересчитывается.
Сигналы при работе с индикатором:
FREE
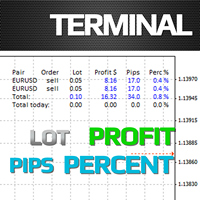
Terminal - индикатор, который служит заменой стандартной вкладке Терминал. Внешне индикатор представляет собой некое подобие таблицы и состоит из нескольких элементов: Строка с описанием столбцов; Открытые ордера; Суммарная информация по открытым ордерам; Суммарная информация по закрытым ордерам за текущий день. Настройки индикатора: Graph corner for attachment - Угол привязки к графику экрана Font - Шрифт Fontsize - Размер шрифта Text color - Цвет текста Profit color - Цвет профита Loss color -
FREE
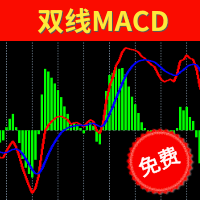
Two Lines MACD Many people who conduct technical transactions on MT4 like to use MACD to judge the turning or continuation of the market. When everyone uses the MACD indicator that comes with MT4, they find that the indicator is a single-line MACD, and the histogram seems to be similar to the past. The MACD that I understand does not match. In order to provide traders with a perfect trading experience, we especially provides free two-line MACD indicators for all traders! The single line in the
FREE

We Trade Live Trend Candle Stick can help identify potential trend in the market when trading, spot market trends and predict future prices. We Trade Live Trend Candle Stick has a smoother look, as it is essentially taking an average of the movement. candles will stay RED during a downtrend and Green during an uptrend . We believe It's useful for making candlestick charts more readable and trends easier to analyse. As a breakout trader you are looking for trades that are ‘breaking out’ of
FREE
Представленный индикатор является развитием идей заложенных в индикаторе Bulls or Bears AM . Данный индикатор отображает разность максимальной и минимальной цен за текущий период времени и значений канала, построенного по максимальным и минимальным ценам за больший период. Рост значений индикатора выше нуля говорит о том, что максимальная цена за текущий период больше среднего значения максимальных цен за период, выбранный в качестве параметра индикатора. Такая ситуация в большинстве случаев го
FREE

Key Level Key Level is a MetaTrader 4 Indicator that uses a proprietary algorithm based on Price Retracement/Breakout Method to show the Entry-Line on your trading.
Instead, it analyzes data of market and identify entry points and opportunities. (Price Retracement / Price Breakout)
It's also a trading tool that be used to practice and enhance your manual trading skills.
Key Level is an amazing tool for Scalping Trader. It also a trading tool that be used to practice and enhance your manual t
FREE

Mega Alert Level: Простой, но ценный индикатор Этот помощник предоставляет звуковые, информационные, push и email уведомления по вашему выбору, когда цена валютной пары касается или приближается к стандартным уровням поддержки и сопротивления или к любым другим объектам на графике, которые вы выбираете. Индикатор крепится к горизонтальным линиям поддержки и сопротивления или к любым другим объектам на графике, которые вы выбираете, нанесенным на график с использованием стандартных инструментов
FREE

The indicator rely on The Toby strategy >> The mother candle which is bigger in range than the previous six candles.
A vertical line shows the last Toby Candle with the targets shown up and down. The strategy is about the closing price out of the range of the toby candle to reach the 3 targets..The most probable to be hit is target1 so ensure reserving your profits and managing your stop lose.
FREE
Forex and Gold OBI is an innovative indicator based on a study of price and market dynamics, utilizing the RSI indicator. This indicator helps you find the best moment to enter the forex market by signaling when the market is in overbought or oversold conditions. Moreover, The indicator calculates two possible targets and the stop loss for each trade, allowing you to optimize your risk/reward ratio. Price This indicator is easy to use and set up, working with any currency pair and timeframe. If
FREE

Индикатор вычисляет и рисует линии на графике. Два типа тренда: Тренд A: линия отрисовывается по локальным минимумам для восходящих трендов и по локальным максимумам - для нисходящих. Тренд Б: линия отрисовывается по локальным максимумам для восходящих трендов и по локальным минимумам — для нисходящих. Нужно, чтобы ситуация полностью удовлетворяла нескольким условиям, которые можно настроить во входных параметрах (см. также рис. 4): MinBarAge : количество баров до последней базовой точки линии н
FREE
The principle of this indicator is very simple: detecting the candlestick pattern in M5 timeframe, then monitoring the return point of graph by using the pullback of High-Low of M5 Candlestick and finally predicting BUY and SELL signal with arrows, alerts and notifications. The parameters are fixed and automatically calculated on each time frame. Example:
If you install indicator on XAUUSD, timeframe M5: the indicator will detect the reversal, pullback, price action on this timeframe (for exa
FREE
Retracement Reversal and Support and Resistance Pro is based on a formula used by Proprietary trading firms and other big institutions on WallStreet including on my Company and used by my traders here in the capital of the world. This indicator will create Red and Green arrows on a possible mayor Retracement level, Reversal Level and future Support and Resistance levels and Yellow arrows on a possible m i nor Retracement level, Reversal Level and future Support and Resistance levels . This in
FREE

If you trade or wish to trade the popular HLHB Trend-Catcher System, then this indicator is for you! It detects when the HLHB system entry rules are met and sends out an alert in the form of notifications to your mobile phone and to your pc. By automatically sending you notifications, this indicator lessens your trading work load as you don't have to sit in from of your pc all day checking all the chats for when the entry rules are met. This indicator does all the dirty work for you. When the si
FREE
MetaTrader Маркет предлагает каждому разработчику торговых программ простую и удобную площадку для их продажи.
Мы поможем вам с оформлением и подскажем, как подготовить описание продукта для Маркета. Все продаваемые через Маркет программы защищаются дополнительным шифрованием и могут запускаться только на компьютере покупателя. Незаконное копирование исключено.
Вы упускаете торговые возможности:
- Бесплатные приложения для трейдинга
- 8 000+ сигналов для копирования
- Экономические новости для анализа финансовых рынков
Регистрация
Вход
Если у вас нет учетной записи, зарегистрируйтесь
Для авторизации и пользования сайтом MQL5.com необходимо разрешить использование файлов Сookie.
Пожалуйста, включите в вашем браузере данную настройку, иначе вы не сможете авторизоваться.