Смотри обучающее видео по маркету на YouTube
Как купить торгового робота или индикатор
Запусти робота на
виртуальном хостинге
виртуальном хостинге
Протестируй индикатор/робота перед покупкой
Хочешь зарабатывать в Маркете?
Как подать продукт, чтобы его покупали
Бесплатные технические индикаторы для MetaTrader 4 - 15

EMA Separation рисует 2 экспоненциальные скользящие средние, и заполняет пространство между ними. Цвет заполнения выбирается в зависимости от направления тренда: восходящий (EMA с коротким периодом выше EMA с длинным периодом) или нисходящий (EMA с коротким периодом ниже EMA с длинным периодом) Это небольшой инструмент для помощи в визуализации разницы между средними с длинными и короткими периодами. Надеемся, он вам понравится. EMA Separation также можно сочетать с бесплатным инструментом EMA S
FREE
Download the free version here.
A Full Concept of BUY/SELL Scalping Strategy Trend detection is one of the basic challenges of every trader. Finding a way to tell when to enter a trade is very important, timing is a game changer, not too early and not too late. Sometimes, due to not knowing the market conditions, the trader closes his positions with a small profit or allows the losses to grow, these are the mistakes that novice traders make. Indicator Trend Whipper is a complete trading st
FREE

Intraday Setup Indicator uses Bollinger Bands as a main indicator to find a good setup filtered with candle stick pattern such as engulfing and pin bar. This is great tool for those who trade with Bollinger bands for entry or use it as a filter for trend. It is suggested to use a higher time frame when using this tool. There are many input setting for user to conveniently find a good probability setup.
FREE

Variable Index Dynamic Average (VIDYA) developed by Tushar Chande by default is contained in MT5 but not in MT4 platform and it is a dynamic EMA (Exponential Moving Average) that adjusts its Length (LB Period) automatically in response to Market Volatility originally measured through the Chande Momentum Oscillator(CMO). CMO value is used as the ratio to the smoothing factor of EMA ( The New Technical Trader by Tushar Chande and Stanley Kroll, John Wiley and Sons, New York, 1994). The higher th
FREE

Unveil the Secret to Trading with Joker's TrendMaster!
Ready to outperform the markets with a proven and reliable strategy? Look no further! Introducing Joker's TrendMaster, the revolutionary indicator crafted by Yuri Congia! With Joker's TrendMaster, you'll gain access to a powerful combination of advanced technical analysis and unique strategic insights.
Limited-time Special Opportunity: Seize the moment! Be among the first 10 (Purchasing 1/10) to seize this unique opportunity, and not
FREE

SKAN This indicator helps you to scan all symbols which are in the Market Watch window and filter out a trend with alerts. It works on five most effective indicators which are used by most of traders for trading: Moving Average Super Trend (ST) Bolinger Band (BB) OPRC BFD It calculates two bars for scanning. When box colour changes to coral or royal blue colour, it indicates you for trend change for long and short entry. And also you will get alert on screen. When it changes to royal blue, it
FREE

Индикатор Fractals ST Patterns является модификацией индикатора Fractals Билла Вильямса и позволяет задавать любое количество баров для нахождения фрактала. Этот простой индикатор соответствует параметрам ST Patterns Strategy ( https://stpatterns.com/ ) . Structural Target Patterns по своей сути и есть сам рынок, последовательно разделенный на составляющие. Для формирования ST Patterns не нужны линии тренда, геометрические пропорции самой модели, объем торгов или открытый рыночный интерес. Они л
FREE

Наша команда наконец-то добилась ожидаемого результата.
Мы создали искусственный интеллект для торговли бинарными опционами. Не верите? Многие пользователи уже оценили его положительно. Результаты вас тоже удивят. Этот индикатор транслирует сигналы для бинарного опциона через телеграм-канал. Все сигналы надежные и качественные.
Читайте далее !!! ВНИМАНИЕ !!!
Вы и не мечтали !!! КАК ЗАРАБАТЫВАТЬ уже прямо сейчас? Самый успешный сигнальный канал для бинарных опционов С нами зара
FREE

Индикатор RSI Arrows MTF построен на основе индикатора RSI . Представляет собой сигналы на вход в виде стрелок. Имеет 6 видов расчета. Все сигналы образовываются на текущем баре выбранного периода. Сигналы не перерисовываются в первых 4 режимах! Но возможно перерисовка в случаях резкого изменения движения рынка. Все сигнала в режиме MTF, соответствуют сигналам того периода, который указан в MTF. Максимально упрощен в использовании как для торговли исключительно одним индикатором, так и для и
FREE

FRB Candle Time
Indicator showing the time left for the next candle You can edit font color and size. Very important indicator for Traders. To move time, just click on it and move the mouse to where you want to leave it. After positioning the time where you want it, click again or press "ESC" and the time will stay where you left it.
Settings font color Font size Background color
FREE

Engulfing candlestick patterns are comprised of two bars on a price chart. They are used to indicate a market reversal. The second candlestick will be much larger than the first, so that it completely covers or 'engulfs' the length of the previous bar.
By combining this with the ability to look at trend direction this indicator eliminates a lot of false signals that are normally generated if no overall trend is taken into consideration
FREE

Индикатор для визуализации временных диапазонов ключевых торговых сессий: Азиатской, Европейской и Американской. Индикатор обладает функционалом настройки времени начала и окончания каждой торговой сессии, а также устанавливаемой временной зоны торгового сервера. Основные преимущества индикатора включают возможность работы с минимальной загрузкой процессора и экономии оперативной памяти. Кроме того, предоставляется опция указания количества отображаемых исторических дней, обеспечивая пользоват
FREE
This indicator allows to hide OBV (on all MT4 timeframes) from a date define by the user with a vertical line (Alone) or a panel (with "Hidden Candles"). Indicator Inputs: Apply To Information on "On Balance Volume" indicator is available here: https://www.metatrader4.com/en/trading-platform/help/analytics/tech_indicators/on_balance_volume ************************************************************* Hey traders!! Give me your feeds! We are a community here and we have the same objective....
FREE

Семафорный индикатор основан на стандартном индикаторе RSI, на который наложен индикатор Envelopes, который показывает конверт или границы колебания индикатора. Это версия индикатора RSI vs Envelopes который рисуется только в окне символа . Сигнал на продажу возникает, когда верхний конверт/граница пробивается индикатором RSI сверху вниз. Сигнал на покупку возникает, когда нижний конверт/граница пробивается индикатором RSI снизу вверх. Индикатор имеет возможность рисовать стрелки на индикаторе,
FREE

The Tmcd is a very smooth oscillator and a good indicator of trend. It has a noise filter built in which shows sideways markets and it can also show the beginning of a trend. It works on any symbol from Forex to commodities as well as crypto currencies. It does not require a change of settings. The default settings are fine. The use of it can be varied and I recommend it is be used in conjunction with other indicators. The indicator is free for use and your review will be appreciated.
Join my
FREE
Индикатор подает сигналы на открытие позиции. Принцип работы - сравнение текущей цены закрытия с диапазоном средних цен за больший период. Подтверждением сигнала считается преодоление ценой максимума/минимума бара на котором индикатор подал сигнал. Сопровождение открытой позиции ведется на меньшем TF. Сигналы индикатора на открытие противоположной позиции на меньшем TF являются сигналом к закрытию сделки. Индикатор не перерисовывается и не пересчитывается.
Сигналы при работе с индикатором:
FREE

This indicator plots in the candles the divergence found in the selected indicator and can also send a notification by email and / or to the cell phone.
Works on all TIMEFRAMES. Meet Our Products
He identifies the divergences in the indicators:
Relative Strength Index (RSI); Moving Average Convergence and Divergence (MACD); Volume Balance (OBV) and;. iStochastic Stochastic Oscillator (STOCHASTIC).
It is possible to choose the amplitude for checking the divergence and the indicator has
FREE

Бесплатный информационный индикатор-помощник Email Alert & InfoPanel. Особенно будет полезен трейдерам, использующим большое количество валютных пар или сеточные торговые системы с усреднением или Мартингейлом. Также он просто удобен, как информатор с возможность отправки сообщения на почту или мобильное приложение. Выполняет следующие функции: Рассчитывает просадку депозита по эквити и отправляет сообщение пользователю, если она больше, чем указана в настройках. Отправляет уведомление о просадк
FREE

RSI Color and Notification Setting Usages :: 1. Set value Oversold and Overbought 2. Set period RSI 3. Set Color 4. Notify to Alert, Email and Mobile.
For Trading :: Forex and Binary option 1. When the color alarm occurs in the OVB area, do the preparation. To enter a Sell order 2. When the color alarm occurs in the OVS area, do the preparation. To enter a Buy order 3. When RSI is between OVB and OVS, consider another indicator to trade.
FREE

An “inside bar” pattern is a two-bar price action trading strategy in which the inside bar is smaller and within the high to low range of the prior bar, i.e. the high is lower than the previous bar’s high, and the low is higher than the previous bar’s low. Its relative position can be at the top, the middle or the bottom of the prior bar.
The prior bar, the bar before the inside bar, is often referred to as the “mother bar”. You will sometimes see an inside bar referred to as an “ib” and its
FREE
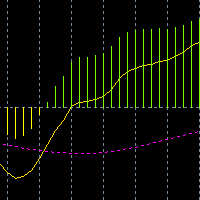
одель MACD, а также добавлены две линии, когда они пересекаются, чтобы получить сигнал покупки или продажи.
желтый сигнал линии в розовой линии сигнала, розовый сигнал вниз, желтый сигнал сверху, что означает больше.
желтый сигнал под линией бледного сигнала, желтый сигнал вниз, розовый сигнал сверху, обозначает пустоту.
линия с нулевыми или выше столбчатыми линиями переводится на светло - зелёные.
под нулевыми линиями столбчатая линия переводится на светло - желтый.
FREE

Небольшой бесплатный индикатор для определения определенных графических паттернов, плечо/голова плечо/разворот, тройная вершина/дно, чашка, флаги и другие... Я разработал его некоторое время назад, он обнаруживает числа в m1, m5, m15, m30 и h1.
Я надеюсь, что это будет полезно для вас, потому что я мало торгую с этим индикатором, у меня есть несколько других, которые я постараюсь быстро разместить в сети, возможно, вы найдете их полезными, хорошие друзья по торговле.
FREE

Индикатор вычисляет и рисует линии на графике. Два типа тренда: Тренд A: линия отрисовывается по локальным минимумам для восходящих трендов и по локальным максимумам - для нисходящих. Тренд Б: линия отрисовывается по локальным максимумам для восходящих трендов и по локальным минимумам — для нисходящих. Нужно, чтобы ситуация полностью удовлетворяла нескольким условиям, которые можно настроить во входных параметрах (см. также рис. 4): MinBarAge : количество баров до последней базовой точки линии н
FREE

Свечной таймер отображает время, оставшееся до закрытия текущего бара и формирования нового бара.
Функция прост в использовании. настроить положение, цвет и Размер шрифта . время сервера не местное.
Входные данные
- позиция - рядом с активной свечой (по умолчанию) ~ Справа вверху ~ Поднимите верхнюю часть ~ Справа внизу ~ Поднять низ - размер шрифта ~ 14 (по умолчанию) - color ~ SpringGreen (по умолчанию)
FREE

TrendFinder VolumeI are Colored candlesticks showing the trend based on Volume and Slope of Trend
This indicator will give you the color change on the next bar on the confirmation candle and will never repaint Lime Green = Possible Buy (Volume up), Teal Green = Bullish Weak (Volume Decreasing), Red = Possible Sell (Volume up) , Orange = Bearish Weak (Volume Decreasing)
TrendFinder Volume is optimize to trade on any market and to be used trending and None trending markets. For best results us
FREE
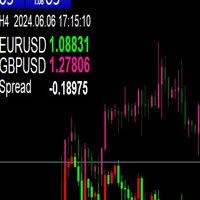
This indicator can be used to add a candle chart of another variety to the chart of the current variety.
1. The chart height will be adjusted automatically
2. If you switch the current icon period, the K of another variety will also switch to the corresponding period
3. In the upper left corner of the chart, the current cycle, the current time, and the current price and spread of the two targets will be displayed.
4. When switching cycle, due to a large number of data retrieval, it wi
FREE

Latest Changes in 1.6 : Added Signal Modes input. Mode 1 : HPF positive go long blue, HPF negative go short red. Mode 2 : slow envelope only, HPF above upper envelope go long blue, HPF below lower envelope go short red. Mode 3 : HPF above both upper envelopes - go long blue, HPF below both lower envelopes go short red. Mode 4 : Go long blue if HPF crosses above upper slow, but fast upper should be below slow upper at the time, exit when HPF crosses below upper fast, reverse logic for short re
FREE

Описание Продукт основан на индикаторах RSI и Momentum. Он также учитывает скользящие средние этих двух индикаторов. Настройки всех трех индикаторов редактируются. Стрелки не перерисовываются, так как индикатор использует только подтвержденные значения и ждет закрытия свечи перед тем, как вывести на график стрелку. Индикатор также может выдавать алерты при появлении стрелок. Предусмотрены три типа алертов - всплывающие, отправляемые по электронной почте и push-уведомления на мобильные устройства
FREE

ATR on Prices - простой индикатор ATR, рисующий линию поддержки и сопротивления на основе расчета Average True Range. Можно настроить дневные периоды ATR для расчета. Также можно установить базовую цену, к которой прибавляется или вычитается значение ATR для получения верхней и нижней линий ATR, используя цену открытия (фиксированную) или среднюю (HL/2) цену (меняется), или прибавлять ATR к дневному минимуму и вычитать его из дневного максимума. Можно использовать целое значение ATR или его поло
FREE

Индикатор показывает на графике к лассические уровни пивота , рассчитанные на основе предыдущего дня. Вы можете выбрать, с какого часа рассчитывать формулу. Торгуйте во флэте на разворот. На трендовом рынке используйте их как цель. Совместите со своими стратегиями для успешной торговли. Уровни строятся с помощью буферов и отображаются на всей доступной истории котировок.
Входные параметры.
Start Hour - с какого часа считать начало дня. 00 - по умолчанию. Show Mid Pivots - отображать промежу
FREE

(перевод Google) Этот индикатор основан на оригинальном " Time Segmented Volume (TSV) ", разработанном Worden Brothers, Inc . Однако я добавил к этому несколько дополнительных функций. Можно выбрать цену, которая будет применяться, вместо того, чтобы использовать только цену закрытия по умолчанию, используемую оригиналом. Также можно выбрать, какое взвешивание по объему использовать, включая псевдообъемное взвешивание на основе истинного диапазона или вообще без взвешивания по объему. (Original
FREE

Индикатор определяет направление тренда и раскрашивает свечи на графике в соответствующий цвет. Позволяет входить в сделку в самом начале движения Максимально простая настройка индикатора Можно использовать на любых валютных парах, металлах и криптовалюте, а так же при работе с бинарными опционами
Отличительные особенности Показывает направление тренда Не перерисовывается; Простая и точная настройка; Работает на всех таймфреймах и на всех символах; Подходит для торговли валютами, металлами, оп
FREE

Dear everyone, Today, I would like to introduce you to an amazing tool on the MetaTrader 4 platform - "Pivotal Moments." This indicator will be a reliable companion on your trading journey in the financial market. "Pivotal Moments" is not just an ordinary indicator, but an intelligent tool that helps you better understand significant fluctuations on the chart. With a variety of customization options, it provides valuable information and deep insights into the market. The key features of "Pivotal
FREE

A powerful trend analysis tool for traders of all levels Super Trend Analyzer is a technical analysis tool that uses the Relative Strength Index (RSI) and Moving Average (MA) indicators to identify trends in the market. It is a versatile tool that can be used by traders of all levels of experience.
How does it work An uptrend begins when the main trend line and the auxiliary trend line cross from below and the lower minor oscillator is on the rise. A downtrend begins when the main trend line a
FREE
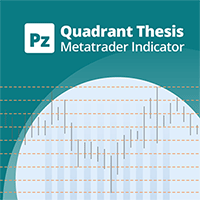
Индикатор общего назначения, отображающий цветные линии с фиксированными ценовыми интервалами, указанными во входных параметрах. Она предлагает универсальные, постоянные и знакомые диапазоны цен, которые позволяют быстро и точно анализировать цены валютной пары. Простой в использовании Не требует оптимизации Настраиваемые ценовые интервалы, цвета и размеры С параметрами по умолчанию индикатор можно использовать для торговли согласно Квартальной теории :
Сплошные красные линии - целые числа Спло
FREE
Индикатор пересечения МА. На заданном периоде находит лучший из периодов МА по прибыли и соотношению убытков и позитивных движений. Входом в длинную позицию считается пресечение быстрой МА снизу вверх по отношению к длинной. Для короткой позиции - наоборот. Лучший из периодов выводится на экран. Также отрисовываются МА. В настройках есть возможность выбрать период баров/свечей для анализа. Также временной период обновления, по истечении которого индикатор пересчитает комбинации снова.
Period
FREE

H I G H - P R O B A B I L I T Y - B R E A K O U T T R E N D L I N E I N D I C A T O R This is no ordinary trendline indicator. It has a highly-probability algorithms incorporated in the script to display only trendlines that may give a very high chance of price breakout. The indicator is not a stand alone indicator. Trader should interpret it together with their very own analysis technique to come up with a more efficient trading strategy. You can use with it other trend indic
FREE

The Fisher Transform is a technical indicator created by John F. Ehlers that converts prices into a Gaussian normal distribution. The indicator highlights when prices have moved to an extreme, based on recent prices. This may help in spotting turning points in the price of an asset. It also helps show the trend and isolate the price waves within a trend. The Fisher Transform is a technical indicator that normalizes asset prices, thus making turning points in price clearer. Takeaways Turning poi
FREE

The selective pin bar is designed to identify reversals. To use the selective pin bar effectively, traders typically look for Strong Rejection: The tail of the pin bar should extend significantly beyond the surrounding price action. It indicates that there was a sharp rejection of higher or lower prices during the trading period. A strong rejection suggests that the market sentiment may be changing.
FREE

Indotrend is a Smart indicator to detects the Trend and also view support & resistance, multiple timeframe to get validate the trend. it can be use for Forex,Index,Metal,Stock and Crypto. Parameters: Alerts - show popup alert message on Metatrader Hi Lo H1 Timeframe - Show LIne Hi/Low Price base on H1 timeframe Show Fibonaci level - Show Fibonaci retracement level
Show Support Resistance, - Show Support & Resistance H1 timeframe.
FREE

Этот осциллятор стал одним из основных инструментов большинства профессиональных трейдеров. Индикатор включает в себя классическую MACD ( Moving Average Convergence/Divergence ) линию, сигнальную линию, а также гистограмму MACD. В расчете используются экспоненциальные скользящие средние. Так же в индикаторе предусмотрена возможность включения сигналов о нахождении дивергенций между графиком цены и индикатором. Поиск дивергенций происходит по трем паттернам: классическая, скрытая и расширенная ди
FREE

Th3Eng Panda trend is a powerful indicator that works perfectly for scalping trades as well as swing trades. Th3Eng Panda trend is not just an indicator, but a very good trend filter. You can setup it on H4/H1 to Find the main trend and start scalping on M5/m15/m30 Time Frames. Works with all pairs and all Time Frames.
Inputs:
Section #1 History : Maximum number or bars to draw the last signals. (Default 5000) Draw Candles : Draw red candle when sell signal and green when buy signal. (tr
FREE

PREVIOUS INDICATOR’S DATA MA CROSSOVER https://www.mql5.com/en/users/earobotkk/seller#products P/S: If you like this indicator, please rate it with 5 stars in the review section, this will increase its popularity so that other users will be benefited from using it.
This indicator notifies and draws an arrow on the chart whenever the MA line has crossed over its previous indicator’s data MA filtered by MA Trend. It also displays total pips gained from all the entry set-ups. Setting · You
FREE

Этот индикатор служит для визуального представления Дончианского канала на вашем торговом графике. Дончианский канал - это простой технический инструмент, используемый для изображения диапазона между самыми высокими и самыми низкими значениями за определенный период. Этот индикатор улучшает визуальный анализ движения цен, предоставляя понимание потенциальных точек прорыва и продолжения тренда. Дончианский канал может быть применен как к текущему временному интервалу, так и к более высокому, если
FREE

Индикатор теней.
Отображает размер теней свечей, в пунктах, в виде гистограммы. Работает в трех режимах, на выбор пользователя. Описание настроек индикатора Mode - режимы работы индикатора, три режима: первый height - режим отображения верхних и нижних теней свечей; второй difference - режим отображения разницы теней свечей, разница между верхней и нижней тенью свечи; третий superiority - накопленная разница теней свечей за один торговый день, режим не работает на периоде большем 4 часа.
FREE

FIBO ALERT https://www.mql5.com/en/market/product/34921
This indicator draws a fibonacci retracement (high and low) of a candle. It alerts and notifies the user whenever price touches or crosses the fibonacci levels. INPUTS ON Alert: set to true will alert pop up whenever price crosses levels at chart time frame. ON Push: set to true will send push notification to phone whenever price crosses levels at chart time frame. ===== FIBO (High & Low) ===== Time Frame: indicator draws fibonacci lev
FREE

*This is tradingview indicator converted to mql4*
The Chandelier Exit Indicator is a popular technical analysis tool developed by Chuck LeBeau. It is designed to help traders identify potential exit points for their trades based on market volatility and the concept of trailing stops. The Chandelier Exit Indicator consists of three main components: Average True Range (ATR): The indicator utilizes the Average True Range, which measures market volatility. The ATR calculates the average range bet
FREE
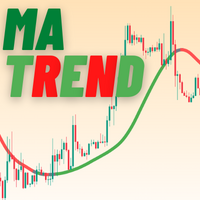
MATrend indicator makes the directional trend of the current market easily recognizable. Settings: MA Period : The amount of candles taken into consideration for the calculation of the moving average; MA Method : The method used for the calculation of the moving average. Selectable methods are: Simple averaging;
Exponential averaging;
Smoothed averaging;
Linear-weighed averaging; Usage: The color of the indcator will change based on the slope of the MA. Green : The indicator has a bullish
FREE
Это бесплатная версия индикатора Double Top Tracker . В отличие от полной версии некоторые функции отключены, а параметры не могут быть изменены. Индикатор параллельно анализирует ценовые графики нескольких валютных пар на всех таймфреймах и отправляет уведомление, как только обнаруживаются паттерны "Двойная вершина" и "Двойное дно". Когда цена достигает второй вершины, индикатор формирует сигнал. "Двойная вершина" (Double Top) — паттерн разворота тренда, который состоит из двух последовательны
FREE
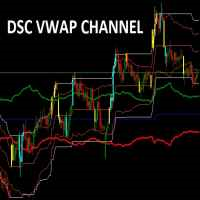
Corretora recomendada para usar esse indicador: https://tinyurl.com/5ftaha7c
Indicador usado para sabermos os pontos de suporte de resistência no gráfico. Funciona em todos ativos e timeframes.
Acerte exatamente os pontos de entradas e saídas das suas operações. SEE OUR RESULTS ON INSTAGRAM: https://www.instagram.com/diogo.cansi/ TELEGRAM GROUP = https://t.me/robosdsc More information by email dscinvestimentos@gmail.com or by Whatsapp 55-991372299
FREE
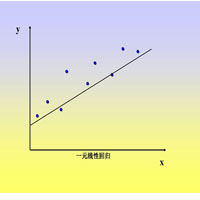
This index is used to calculate the linear regression slope of the K line in a period of time. The algorithm adopts the least square method.
1. Suitable for each cycle chart.
2. Can be used to calculate opening price, closing price, high price, low price, middle price.
3. Specify the start time and end time in the parameters.
Note that the start time and end time cannot be weekends, select the calculated price, pay attention to capital letters.
FREE
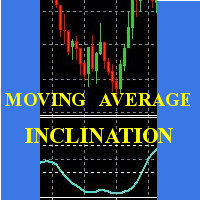
Scalp using the behavior of a short moving average, the indicator gives the slope and identifies the "hyper" moments.
Operational advice:
Use M1 chart. Period 20 : open buy after two rising lows; sell after two max downhill; avoid countertrend openings; when the line goes flat put a stop at the opening price. Avoid actions in low volatility timeslots. When the curve that draws the min / max is very flat, it is better to postpone at least 15'.
Period 50 : matches the trend, when it is at t
FREE

The BuySellAlert free arrow indicator is developed based on the use of HMA, Laguerre, CCI, and ATR. The BuySellAlert free arrow indicator: generates possible entry points for BUY and SELL ; displays current profit ; displays current spread. The profitability of the indicator is shown in the screenshot on the example of the GBPUSD pair Does not redraw and works on opening bar. Timeframes - M1-H1. Recommended TimeFrame-M15. The BuySellAlert free works only with AUDUSD . Version without restric
FREE
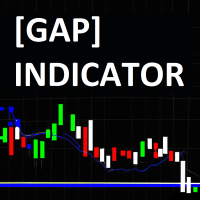
The JagzFX Gap Indicator acts as your vigilant companion, scanning the market with precision and alerting you to the presence of gaps as soon as a new candle is formed. Set your desired gap size, and the indicator will highlight both filled and unfilled gaps, on any symbol and on any timeframe. By analysing the presence of unfilled gaps, you gain valuable insights into market behaviour, allowing for more informed trading decisions. Combine JagzFX Gap Indicator with JagzFX OnePin to create a ma
FREE

Целью этой новой версии стандартного MT4 индикатора, входящего в поставку платформы, является отображение в подокне нескольких таймфреймах одного и того же индикатора. См. пример, приведенный на рисунке ниже. Однако индикатор отражается не как простой индикатор MTF. Это реальное отображение индикатора на его таймфрейме. Доступные настройки в индикаторе FFx: Выбор таймфрейма для отображения (от M1 до MN) Установка ширины (количество баров) для каждого окна таймфрейма Всплывающее оповещение/звуков
FREE

[DESCRIPTION] A Simple Moving Average with period 20 that changes color to green when the price is above the moving average and to red when the price is below the moving average. A simple moving average (SMA) calculates the average of a selected range of prices (closing prices), by the number of periods in that range. The SMA is a technical indicator that can aid in determining if an asset price will continue or reverse a bull or bear trend [WARNING AND RECOMMENDATIONS] Trading Forex and
FREE

I was looking for a lean symbol changer. I could not find any. Normally other products hide lot's of screen space. So I developed a very lean symbol changer Just click on the 2 currencies you want to combine. The order does not matter. If you miss some pairs, you can add up to 5 custom symbols. Please make sure, your broker support your custom symbols. Drag an drop the panel with the green button.
In future I plan to include suffix and prefix als well.
FREE

Features:
- Moving Average Slope for Max Past Bars - Slope Period - Slope Thresholds - Multiple Slope Type options - See slope visually as a histogram - Info Panel Show/Hide Slope Calculations and Types:
The slope value is calculated using the Slope Period. Suppose Period is 5, it will check the MA value for bar (x) and bar (x+5). And find the slope angle between them.
Read detailed description about Slope Types and Settings here: https://www.mql5.com/en/blogs/post/747651
FREE
How To Trade
Execute your trades in 3 Easy Steps!
Step 1: Trade Setup Entry Buy = If daily open market Above Line PIVOT or can Price has touched and closed the candle above Resistance1. Entry Sell = If daily open market Under Line PIVOT or can Price has touched and closed the candle above Support1. Step 2: Set Stop Loss Stop loss BUY ----> You can set stop loss on Line Pivot or Support1. Stop loss SELL ----> You can set stop loss on Line Pivot or Resistance1. Step 3: Set Take Profit Take pro
FREE

Вы устали от большого количества открытых графиков и от наблюдения за многими различными валютными парами? MCTSI будет отслеживать силы 56 валютных пар и покажет лучшие пары для торговли. Вам больше не нужно гадать, какая валюта сильнее/слабее. Больше никакой торговли парой, которая еле движется. Это базовая версия. Более продвинутая версия MCTSIP доступна здесь: https://www.mql5.com/ru/market/product/20994 У вас может быть открыто множество графиков для того, чтобы определить наилучшую пару дл
FREE

Этот индикатор отображает уровни открытия, максимума, минимума и закрытия предыдущего месяца на нижних таймфреймах текущего месяца.
Эти уровни действуют как хорошие уровни поддержки и сопротивления.
Большую часть времени цена колеблется в пределах уровней.
дождитесь, пока цена достигнет этих уровней и действуйте соответственно.
Обратите особое внимание на слияние уровней.
Согласно моим наблюдениям, если уровень Close (White) находится в слиянии с любыми другими уровнями,
FREE

Time to Trade Trading timing indicator is based on market volatility through 2 ATR indicators to determine the timing of a transaction. The indicator determines the times when the market has strong volatility in trend. When histogram is greater than 0 (blue) is a strong market, when histogram is less than 0 (yellow) is a weak market. Should only trade within histograms greater than 0. Based on the histogram chart, the first histogram value is greater than 0 and the second histogram appears, this
FREE

Постоянная необходимость проверки того, достиг ли CCI определенного уровня, может быть утомительным и отнимающим силы, особенно если нужно одновременно отслеживать разные классы активов. Индикатор Alert CCI поможет в этой задаче, гарантируя, что вы получите максимум при минимальных усилиях. Когда значения CCI достигают определенного уровня, оповещения будут подаваться на графике, в мобильном приложении MetaTrader 4 или по электронной почте (вы можете получать текстовые сообщения на мобильное уст
FREE

Этот индикатор способен отображать 1-2 индикатора MACD на разных таймфреймах и с разными настройками. В расчетах используется EMA. Активные индикаторы могут подавать визуальные и звуковые оповещения при пересечении нулевого уровня, если эта функция включена пользователем. Оповещения могут быть установлены для одного или обоих активных индикаторов, даже если у них отличаются таймфреймы и периоды. При установке оповещений для обоих, две гистограммы MACD должны иметь одинаковое значение нулевого ур
FREE
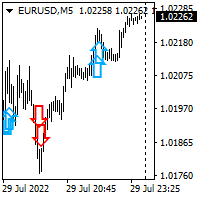
Hello all. This indicator helps you to open a trade, when break out occurred, also you can add to your position and ride it if trend continued. I use it on 1-5 min chart, as you can use short stop loss. Also profit target should be small as well. It is better to enter few small position, so you can book some profit early and ride the rest for bigger gains. Look at the past to have a plan. Enjoy.
FREE

Данный индикатор является интерпретацией показаний классического индикатора - RSI. Для сглаживания резких колебаний значений индикатора применяется фильтр отсекающий слабые изменения и акцентирующий внимание трейдера на сильных колебаниях значений. Индикатор не перерисовывается на сформированных барах. Для большей эффективности данного индикатора его следует использовать совместно с индикаторами, идентифицирующим направление тренда, а также уровни поддержки/сопротивления. Сигналы: Пересечение ги
FREE

Индикатор PA Touching Alert избавит вас от необходимости целый день отслеживать графики в ожидании, когда цена дойдет до определенного важного уровня. С помощью этого инструмента вы можете установить два уровня цен: верхний и нижний, которые должны быть выше/ниже текущей цены соответственно. Как только цена коснется верхнего или нижнего уровня, индикатор подаст оповещение и/или отправит вам уведомление. Верхнее и нижнее значение цены должны находиться на критических уровнях поддержки и сопротивл
FREE

Trends are like the "Saint Graal of traders": it can give you an higher win rate, a better risk to reward ration, an easier position management and so on...
But it is really hard to determine the trend with accuracy, avoiding fase signals, and with the right timing, in order to take massive movements. That's why I created the Trend Validator: a new and EASY tool that will make identifying trend and build new strategy a really easier work.
ANATOMY OF THE SOFTWARE
The indicator is composed b
FREE

Индикатор строит две простые скользящее средние по ценам High и Low. Линия MA_High отображается, когда скользящая направлена вниз. Она может быть использована для выставления стоп ордера для позиции на продажу. Линия MA_Low отображается, когда скользящая направлена вверх. Она может быть использована для выставления стоп ордера для позиции на покупку. Индикатор используется в эксперте TrailingStop . Параметры Period - период расчета скользящей среднейю Deviation - коэффициент сдвижения/раздв
FREE

The " Comfort Zone Signal " indicator identifies a daily zone that, when broken, has a high probability of the market continuing the established trend .
Upon signal, the indicator calculates stop loss and take profit, which can be set by you.
You can also set the trend. If the price is above the MA, it looks only for long positions, if below, it looks only for short positions.
You can choose to ignore the moving average and display all signals.
Additionally, you have the risk percentage d
FREE
MetaTrader Маркет предлагает каждому разработчику торговых программ простую и удобную площадку для их продажи.
Мы поможем вам с оформлением и подскажем, как подготовить описание продукта для Маркета. Все продаваемые через Маркет программы защищаются дополнительным шифрованием и могут запускаться только на компьютере покупателя. Незаконное копирование исключено.
Вы упускаете торговые возможности:
- Бесплатные приложения для трейдинга
- 8 000+ сигналов для копирования
- Экономические новости для анализа финансовых рынков
Регистрация
Вход
Если у вас нет учетной записи, зарегистрируйтесь
Для авторизации и пользования сайтом MQL5.com необходимо разрешить использование файлов Сookie.
Пожалуйста, включите в вашем браузере данную настройку, иначе вы не сможете авторизоваться.