MetaTrader 5용 새 기술 지표

MonetTrend — Премиум-индикатор для торговли по тренду (M30, H1, H4)
MonetTrend — это мощный и визуально понятный трендовый индикатор, созданный для торговли на таймфреймах M30, H1 и H4. Он идеально подходит для работы с волатильными инструментами, такими как: • Золото (XAUUSD) • Криптовалюты (BTCUSD) • Валютные пары (EURUSD, USDJPY и др.)
Ключевые особенности MonetTrend: • Автоматическое отображение Take Profit 1 (TP1) и Stop Loss (SL): После появления сигнала индикатор сразу показывает: • TP
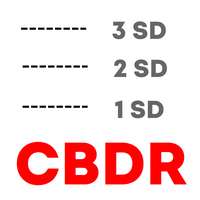
Haven CBDR 는 ICT의 "Central Bank Dealers Range (CBDR)" 가격 범위를 차트에 표시하는 사용하기 쉬운 인디케이터입니다. 이 프로그램은 CBDR 가격 범위를 직사각형으로 표시하며, 표준편차 라인을 추가로 그려 잠재적인 지지 및 저항 레벨을 확인할 수 있도록 도와줍니다. 사용자는 CBDR 시간 구간, 표시할 캘린더 날짜 수, 색상 및 그래픽 요소 스타일을 설정할 수 있으며, 차트 테마에 따라 자동으로 색상 테마도 조정됩니다. 또한 일일 캔들 오픈 시점을 나타내는 수직선을 표시하여 시장 움직임을 쉽게 파악할 수 있습니다. 다른 제품 보기 -> 여기 트레이더 활용법: 설정 조정:
필요에 따라 세션 시작 및 종료 시간, 표시 색상, 직사각형 테두리 스타일, 표준편차 라인 및 마커 설정을 변경하세요. 범위 분석:
표시된 직사각형을 통해 선택한 기간 내 CBDR 가격 범위를 빠르게 시각적으로 확인하세요. 표준편차 라인을 통해 되돌림이나 추세 지속 가능성
FREE

간단하고 직접적이며 효율적입니다. 이것이 바로 Bars Trend and Pivot Support의 전부입니다.
이 시스템을 사용하면 그래프 분석을 용이하게 해주는 직관적인 도구를 사용할 수 있습니다. 선택한 기간에 따라 중요한 지지선과 저항선을 자동으로 표시하고 피벗 라인을 강조하며, 선호도에 따라 활성화 및 비활성화 옵션을 제공합니다.
대시보드는 또한 D1, H4, H1 및 M30 시간대의 캔들 방향을 명확하게 표시하여 다양한 거래 접근 방식에 대한 필수적인 전략적 통찰력을 제공합니다.
또한, 시스템은 현재 스프레드와 다음 캔들 형성까지 남은 시간을 모두 실용적인 방식으로 알려주고 차트에 통합합니다.
주요 지표인 Brute Force Trend와 함께 사용하세요: https://www.mql5.com/en/market/product/132647?source=Site +Market+My+Products+Page
FREE
Crystal Volume Indicator – MT5를 위한 스마트 거래량 분석 도구 Crystal Volume은 가격 움직임 뒤에 숨겨진 시장의 강도를 시각적으로 해석할 수 있도록 설계된 고급형이면서도 사용자 친화적인 거래량 분석 지표입니다. 가격 행동과 거래량 흐름을 결합하여 Buying Climax(매수 클라이맥스) , Selling Climax(매도 클라이맥스) , 약한 캔들 등의 주요 거래량 이벤트를 강조하여 잠재적인 반전 또는 추세 지속 구간을 쉽게 파악할 수 있게 도와줍니다. 주요 기능: 실거래량 분석 (브로커 지원 시 실거래량 또는 틱 볼륨 모두 가능) 컬러 코드 히스토그램 매수/매도 클라이맥스 감지 최근 거래량에 비해 약한 캔들 강조 이동 평균선(거래량 기반) 사용자 지정 Lookback 윈도우 캔들 방향에 따라 색상 표시 옵션 (상승/하락/도지) 거래량 이벤트 분류: 매수 클라이맥스: 매우 높은 거래량, 고가 부근에서
FREE

초보자도 쉽게 시장의 진짜 힘을 식별하세요.
모멘텀 섀도우 인디케이터(MSI)는 초보자와 전문가 모두에게 완벽합니다.
시장이 실제로 힘이 있는지를 보여주어, 매수 또는 매도 타이밍을 확신 있게 결정할 수 있습니다. 혼란 없음. 추측 없음.
진짜인지 아닌지를 알려주는 간단한 선만 있습니다. 매우 쉬운 사용법 — 모든 수준에 적합
명확한 매수 및 매도 신호
20분 이상 차트에 최적화, 스캘핑에도 유용 합성 변동성 지수에서 가장 잘 작동합니다 — 뉴스가 이러한 시장에 영향을 미치지 않기 때문에 순수한 모멘텀 신호를 얻을 수 있습니다.
작동 원리:
차트에는 세 개의 선이 표시됩니다: 단기 추세선 (노란색) 장기 추세선 (파란색) 모멘텀 섀도우 선 (흰색) — 과거 가격 움직임을 따름 매수 신호:
가격이 노란색과 파란색 선 위에 있고, 섀도우도 위에 있으면:
강한 상승 모멘텀. 매수 고려. 매도 신호:
가격이 두 선 아래로 떨어지고, 섀도우도 아래에 있으면:
강한 하락

Volume Thermal Vision으로 볼륨의 힘을 경험하세요 트레이딩을 한 단계 업그레이드할 준비가 되셨나요? MetaTrader 5용 궁극의 볼륨 지표인 Volume Thermal Vision을 소개합니다. 볼륨 분석을 전략적 우위로 전환시켜 주는 이 지표는 높은 확률의 기회를 식별하려는 트레이더를 위해 개발되었으며, VSA(Volume Spread Analysis), ICT(Inner Circle Trader), SMC(Smart Money Concepts), Wyckoff 등 방법론에 최적화되어 EURUSD, GBPUSD, US30 등 페어의 시장 행동을 해독하는 데 도움을 줍니다. 왜 Volume Thermal Vision인가? 고급 볼륨 분석: 12단계 컬러 레벨로 볼륨 강도를 시각화하여 축적, 분배 및 기관 움직임을 명확하게 식별합니다. 독점 시각 프로토콜: Tactical, StealthMode, ThermalVision, NightVision 4가지 모드를 선택해

KT Fair Value Gap(FVG)는 시장에서 일시적인 가격 불균형이 발생한 구간을 식별하고 시각적으로 강조 표시합니다. 이러한 갭은 가격이 계속 움직일 수 있는 잠재적인 구간이 되며, 경우에 따라 반전 지점(역방향 FVG라고도 함)으로 작용할 수 있습니다. 강세 FVG: 녹색 박스로 표시되며, 가격이 상승 흐름을 다시 이어갈 수 있는 지지 구간 역할을 합니다. 갭이 메워지면 가격이 반전될 수 있는 전환 구간이 되기도 합니다. 약세 FVG: 빨간색 박스로 표시되며, 가격이 하락세를 지속할 수 있는 저항 구간을 나타냅니다. 강세 FVG와 마찬가지로 갭이 메워진 후에는 반전이 일어날 수도 있습니다.
주요 기능 깔끔하고 직관적인 디자인: FVG 영역을 명확하게 보여주도록 설계되어 차트를 복잡하게 만들지 않으며, 트레이더가 집중할 수 있도록 도와줍니다. 인사이트 대시보드: 화면에 표시되는 소형 패널에서 처리된 FVG와 미처리된 FVG의 비율을 한눈에 확인할 수 있습니다. 완벽한 사용
Volume Thermal Vision Basic은 널리 알려진 Volume Thermal Vision 지표의 간소화된 버전으로, 거래량 강도를 실용적이고 효율적으로 분석하려는 트레이더를 위해 설계되었습니다. 총 6가지 생생한 색상 수준을 제공하며, StealthMode, NightVision, FrostVision 모드를 통해 거래량 데이터를 명확하고 전략적으로 시각화할 수 있습니다. 이 인디케이터는 가볍고 직관적인 인터페이스로 초보자에게 이상적이며, 숙련된 트레이더의 분석 도구로도 매우 유용합니다. MQL5 Market에서 전체 버전으로 업그레이드하면, 고급 기능과 다양한 시각화 옵션을 통해 트레이딩 결정을 보다 효과적으로 내릴 수 있습니다. 거래 전략 최적화에 유용한 도구입니다.
FREE
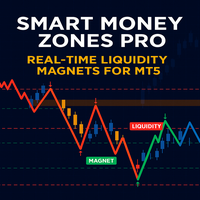
SM Zones Pro 지표의 기능을 더 자세히 알아보고 싶으시다면, 다양한 시간대의 단일 EURUSD 상품에 맞춰 조정된 무료 SM Zones 지표를 먼저 다운로드하여 사용해 보시는 것을 권장합니다. 이 시장에서 SM Zones를 다운로드할 수 있습니다. SM Zones Pro는 SM Zones와 달리 최대 10개의 상품을 동시에 분석할 수 있습니다.
스마트 머니 관리 전략의 원칙에 따라 개발된 SM Zones Pro 지표는 MetaTrader 5(MT5) 플랫폼 트레이더에게 매우 편리한 도구입니다. SM 전략에 사용되는 모든 주요 존(시장 구조, 유동성 증가 가격 수준, "가격 자석" 존 - 불균형, 주문 블록, 선가 변동(fvg), 브레이커 블록, 완화 블록)을 차트에 그래픽으로 표시합니다. 강세장에 영향을 미치는 존은 녹색, 약세장에 영향을 미치는 존은 갈색으로 표시됩니다. 이러한 레벨은 대형 기관 및 은행의 주문에 의해 영향을 받는 가격 변동 가능성이 있는 영역을 반영합
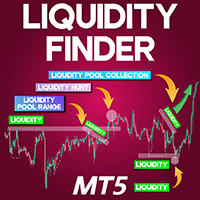
Liquidity Finder Indicator MT5
The Liquidity Finder Indicator MT5 is a specialized tool developed for the MetaTrader 5 platform, created to detect zones of market liquidity. This indicator functions by plotting both fixed and dynamic liquidity levels on the price chart. Blue-colored lines indicate zones of liquidity near recent highs, while red lines mark zones near significant lows. Static lines often align with common chart structures such as Double Bottoms and Double Tops, giving visual clar
FREE
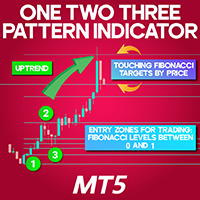
1-2-3 Pattern Indicator for MetaTrader 5
The 1-2-3 Pattern Indicator for MetaTrader 5 is a strategic analytical tool designed to pinpoint potential reversal zones in the financial markets. This indicator automatically identifies three significant swing points, forming a ZigZag structure that outlines the price path and calculates Fibonacci levels based on those decisive pivots. «Indicator Installation & User Guide» MT5 Indicator Installation | One Two Three 123 Pattern Indicator MT4 | ALL
FREE

Welcome. This tool is designed to help traders monitor the critical price level at which the account's margin level reaches 100%, providing valuable insights for risk management in trading. Advisor Description The "Margin Level 100%" indicator is a custom technical indicator for MetaTrader, designed to calculate and display the critical price level for a specific symbol where the account's equity equals its margin, resulting in a margin level of 100%. This level is crucial as it indicates the
FREE
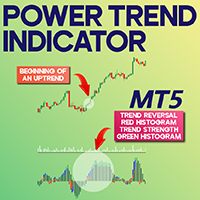
Power Trend Indicator for MetaTrader 5 The Power Trend Indicator for MetaTrader 5 is a dynamic trading utility designed to help traders pinpoint both the direction and momentum of ongoing market trends. This oscillator uses a color-coded histogram to visually represent trend strength. A red bar signifies a trend shift, blue indicates mild trend activity, green denotes strong momentum, and black reflects a flat or indecisive market. It's particularly useful for spotting trend reversals and rapid
FREE
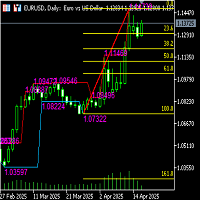
Functional description of automatic Fibonacci line indicator (including high and low channel lines) Indicator name Automatic Fibonacci retracement line + high and low channel auxiliary
Functional introduction This indicator combines the automatically identified high and low points of the band, automatically draws the Fibonacci retracement/extension line, and draws the highest and lowest price channel lines of the current analysis interval to provide traders with clearer support/resistance refe
FREE
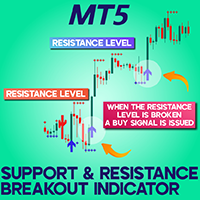
Support Resistance Breakout Indicator (SRBAI) download for MetaTrader 5 The Support Resistance Breakout Arrows (SRBA) indicator serves as a precision tool for mapping key price areas based on pivot structures. Specifically designed for MetaTrader 5 (MT5), the SRBAI indicator marks support zones with blue and resistance zones with red lines. Upon a confirmed breakout beyond these zones, it signals buying opportunities with blue arrows or selling opportunities with red arrows, accompanied by on-sc
FREE
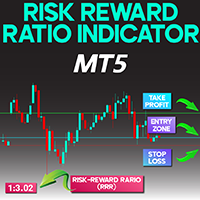
Risk Reward Indicator for MetaTrader 5
The Risk Reward Indicator for MetaTrader 5 is crafted to evaluate and display the Risk-to-Reward Ratio (RRR) with precision, placing the calculated value directly onto the trading chart.
This advanced risk assessment tool showcases the RRR in the upper-left corner of the screen and marks essential trade levels using three clearly defined horizontal lines:
• Green Line: Target Profit (TP)
• Red Line: Protection Stop (SL)
• Blue Line: Entry Point (EP) «Indic
FREE
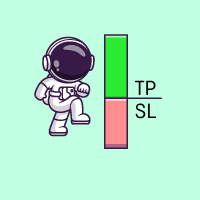
A simple plotting box for your TP and SL markers. The best use case is showcasing signals to your community. I also have MT2DC, which can be used to submit signals to Discord via webhook. By utilizing this indicator, your followers can quickly see the open position along with its TP and SL levels. The indicator also displays the average open price, allowing you to set SL above the average for a safer trade Kindly leave 5-star rating and share with your friends if you like this indicator.
FREE
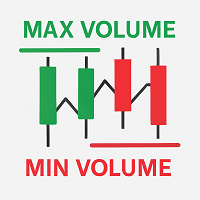
MaxVolumeTrendLines
This indicator visualizes the bars with the highest tick volume for each trading day, highlighting price levels where buyers or sellers showed notable activity. Description MaxVolumeTrendLines automatically detects the bar with the highest tick volume within each day (for a selected number of days) and displays horizontal lines on the chart: Green line at the Low — for bullish bars (close above open). Red line at the High — for bearish bars (close below open). Line thicknes
FREE

Discover the power of harmony in the markets with this advanced harmonic pattern indicator. Designed for demanding technical traders, this indicator automatically detects 11 of the most popular harmonic patterns, including the Gartley, Bat, Crab, Butterfly, Shark, Cypher, and many more.
Thanks to its dynamic dashboard, you can easily manage the visibility of patterns on the chart, activating or deactivating the ones you want in real time without overloading your platform. This flexibility allo
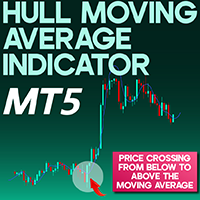
Hull Moving Average Indicator MetaTrader 5
The Hull Moving Average (HMA), developed by Alan Hull, offers a refined alternative to conventional moving averages by delivering faster responsiveness and improved trend accuracy. Integrated into the MetaTrader 5 (MT5) platform, this indicator is tailored to help traders better recognize short-to-medium-term market directions. By using the Hull MA, traders can fine-tune their trade entries and exits with enhanced timing. «Indicator Installation & User
FREE
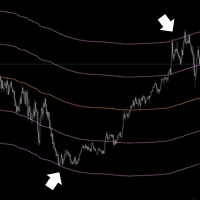
Elevate Your Trading with Advanced Anchored Volume Weighted Average Price Technology Unlock the true power of price action with our premium Anchored VWAP Indicator for MetaTrader 5 - the essential tool for precision entries, strategic exits, and high-probability trend continuation setups. Write me a DM for a 7 day free trial. Anchored VWAP Plus gives traders unprecedented control by allowing custom anchor points for Volume Weighted Average Price calculations on any chart. With support for 4 sim
FREE

Welcome to the "Breakeven Line" indicator, version 1.1, developed by Sergei Ivanov in 2025. Visualize breakeven price levels for your trades with precision and ease. Advisor Description The "Breakeven Line" is a MetaTrader (MQL5) indicator that displays breakeven price levels for open buy and sell positions on the current symbol, factoring in commissions and swaps for accurate risk management. Key Features: Dual Lines: Plots Buy Breakeven (Dark Violet) and Sell Breakeven (Deep Pink) lines, show
FREE
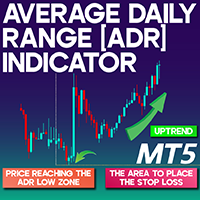
Average Daily Range (ADR) Indicator for MetaTrader 5 The Average Daily Range (ADR) Indicator for MetaTrader 5 is a powerful analytical tool developed for monitoring average price fluctuations within a trading day. It serves as an essential asset for evaluating market dynamics and intraday volatility. A price movement reaching the ADR High can indicate a potential exhaustion among buyers, often hinting at an upcoming pullback. Conversely, when the price moves toward the ADR Low, it might represen
FREE
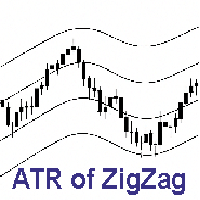
ZigZag Channel Indicator – A Simple Way to Read Market Structure! This indicator automatically calculates the average distance of ZigZag waves and draws a visual channel:
The upper line reflects the average distance of upward waves.
The lower line reflects the average distance of downward waves. Instantly understand market rhythm and price swings.
Use it to identify targets, exits, reversals, and false breakouts.
Perfect for trend analysis, pattern recognition, and measuring move str
FREE
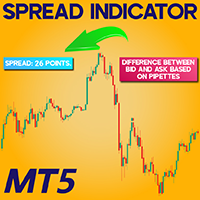
Spread Indicator download For Meta Trader 5
The Spread Indicator is a practical utility designed for MetaTrader 5 (MT5) that highlights the gap between the Bid and Ask prices directly on the chart. Positioned in the upper-left corner of the screen, it presents the current spread in real-time using pipettes (points), providing traders with a clear view of market costs. «Indicator Installation & User Guide» MT5 Indicator Installation | Spread Indicator Download for MT4 | ALL Products By Trad
FREE

RSI Heatmap Indicator for MetaTrader5
The RSI Heatmap Indicator for MetaTrader5 is a powerful visual tool designed to measure the momentum of multiple currency pairs based on the Relative Strength Index (RSI). It detects and highlights overbought and oversold conditions across several timeframes and displays them in a heatmap located at the bottom left section of the chart. This visual representation helps traders quickly assess the overall market sentiment. Green tones signal potential buying
FREE
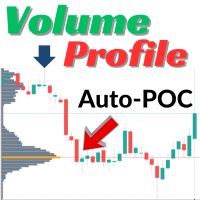
Crystal Volume Profile Auto POC Indicator by Muhammad Jawad Shabir
Version: 1.74 Crystal Volume Profile — Smart Volume Visualization for Precise Trading Decisions Crystal Volume Profile is a lightweight yet powerful indicator developed for MetaTrader 5, designed to provide traders with a clear and insightful view of market volume activity. Whether you're a day trader or swing trader, this tool enables you to identify high-impact price levels by highlighting where trading volume is most conc
FREE

The VIX Index, or CBOE Volatility Index, is an indicator designed for MetaTrader 5 that transforms historical volatility into an easy-to-interpret oscillator, placing the volatility range between 0 (minimum) and 100 (maximum) based on a configurable normalization period.
Unlike a simple ATR, this oscillator shows you on the chart when volatility is abnormally low or high compared to its recent behavior. Additionally, the indicator provides context and information about the famous VIX Volatility
FREE
As the suggested, with this indicator you are able to switch from one symbol or timeframe to another in the same single chart. So forget about opening tons of chart on your screen! It's not designed for ICT or SMC trader, but if you are that kind of trader you still can use it. Imagine you have a strategy containing various indicators and settings, on a single chart you can screen the entry opportunity then move to the next symbol or timeframe.
FREE
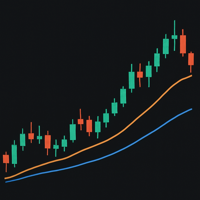
The 13- and 21-period exponential moving averages (EMA) on a 15-minute gold chart are used to identify short-term trends and potential trading signals. When the 13-period EMA crosses above the 21-period EMA, it is considered a bullish signal indicating a possible price increase. Conversely, when the 13-period EMA crosses below the 21-period EMA, it is considered a bearish signal indicating a possible price decline.
These crosses are used to determine entry and exit points. For example, when a
FREE
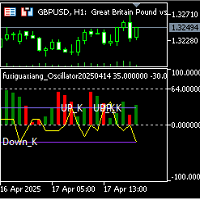
Fuxi Hexagram Oscillation Signal Alert Indicator — An Innovative Trading Tool Combining I Ching Philosophy with Modern Quantitative Analysis 1. Product Overview The Fuxi Hexagram Oscillation Signal Alert Indicator is a cutting-edge technical analysis tool that integrates ancient Chinese I Ching (Book of Changes) philosophy with modern financial market data analysis. By converting K-line (candlestick) chart behavior into dynamic hexagram structures, the indicator provides traders with real-time t
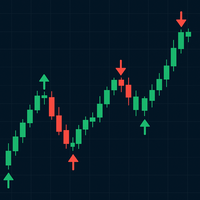
Trend Mark is a versatile trading indicator designed to highlight high-probability entry points using visually intuitive arrows directly on the chart. It analyzes price action and market momentum to identify potential trend reversals or continuations, displaying upward or downward arrows when specific trade conditions are met. Suitable for both beginners and experienced traders, Trend Mark can be used across multiple timeframes and instruments, making it a powerful tool for scalping, day trading

AstroBias Indicator: Precision in the Angle of Your Trend The AstroBias Indicator is more than just a trend direction tool. It also tracks the change in the angle of the price slope , allowing traders to filter signals using angular filters . This makes it especially useful for building automated trading bots based on its signal logic. Key Benefits of AstroBias Indicator Highly Sensitive to Price Action AstroBias responds quickly to real-time price movements, providing clear and timely sign

Sonic Edge Meter: Precision for Reversals and Price Surges Sonic Edge Meter is a powerful indicator built on original algorithms for extremum detection . It’s specifically designed to identify market reversals and sharp directional moves , giving you a clear signal before they happen. How Does Sonic Edge Meter Work? The indicator notifies you of potential turning points or price spikes by displaying visual markers directly on the chart:
Blue dot — signal to buy
Red dot — signal to sell
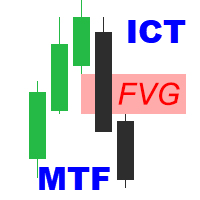
ICT Fair Value Gaps MTF Unlock the power of Fair Value Gaps (FVGs) across multiple timeframes using the ICT Fair Value Gaps Multi - Timeframe Indicator —a precision tool built for traders who follow the Smart Money Concept (SMC) . Key Features : Multi-Timeframe FVG Detection : Automatically identifies Fair Value Gaps from higher timeframes (M15, H1, H4, etc.) and plots them on your active chart for immediate insight. Break of Structure (BOS) & Change of Character (CHoCH): Clearly marked BOS

Candle Confirm Color
What Is It?
The Candle Pattern Confirmations is an advanced indicator for MetaTrader 5 (MT5) designed to identify and confirm candlestick patterns with high probability of trend reversal or continuation. It visually highlights candles that form Engulfing (Bullish/Bearish) and Inside Bars patterns, assisting traders in making more assertive decisions with real-time confirmation.
Main Features
Automatic Pattern Detection
- Detects Bullish Engulfing and Bearish Engulfin
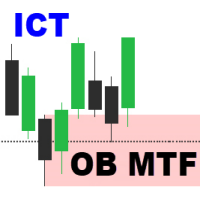
Order Block Multi Timeframe The Order Block Multi Timeframe is a powerful tool for Smart Money Concept (SMC) traders, combining high-accuracy Order Block detection with real-time Break of Structure (BOS) and Change of Character (CHoCH) analysis across multiple timeframes. Smart Money Insight, Multi-Timeframe Precision This indicator automatically identifies institutional Order Blocks —key price zones where large players have entered the market—and plots them directly on your chart. It also track

This MT5 indicator provides real-time updates of classic Renko charts. Renko charts focus on price movement, filtering out noise and highlighting trends. What are Renko candles? Renko charts display price movement using "bricks" of equal size, ignoring time. A new brick is drawn only when the price moves by a specified amount. They help visualize trends by removing time-based noise.
Parameters - BrickSizePoints (20): Renko brick size in points - HistoryDepthSec (3600): Historical data to ini
FREE

Multi-MA Ribbon Overlay (6 EMAs + 250 SMA)
This indicator displays six exponential moving averages (15, 25, 35, 45, 60, 70)(YOU CAN CHANGE THE VALUES) and a slow 250-period simple moving average to help visualize market momentum and trend structure. It’s designed as a clean trend-ribbon for scalpers, intraday, and swing traders. ️ Disclaimer:
Trading forex and CFDs on margin carries a high level of risk and may not be suitable for all investors. Leverage can work for or against you. Always u
FREE

This is a Free Display Dashboard for The ArbitrageATR Recovery MT5 EA. This indicator is used to track existing Total hedge positions (Account Summary) , Balance, Equity, P/L and Symbols, Correlation Status. Please adjust size and colours according to your desired preference. Feel free to message me if there are any queries required. Please note that this an indicator and not a Utility or Expert Advisor.
LINK TO THE EA: https://www.mql5.com/en/market/product/131269?source=Site+Market+Product+
FREE

Pivot Points Indicator – Your Technical Compass in the Market Unlock powerful levels of market structure with our Pivot Points Indicator – a classic tool enhanced for modern trading! Designed for MetaTrader5, this indicator automatically calculates and displays daily, weekly, or monthly pivot levels along with key support and resistance zones. Whether you're a scalper, day trader, or swing trader, pivot levels help you identify potential reversal points , entry zones , and take-profit targ
FREE
Fractal Model Indicator for Metatrader , meticulously crafted around the renowned Fractal Model by TTrades. This powerful tool empowers traders to navigate price action with precision, leveraging multi-timeframe analysis to anticipate momentum shifts, swing formations, and trend continuations. Designed for MetaTrader , the Fractal Model Indicator combines advanced algorithmic insights with customizable features, making it an essential addition for traders seeking to capitalize on expansive mar

This indicator is converted from Pinescript to MQL5 and consisting of buffers for the range lines as well, its not only object.
The Range Detector indicator aims to detect and highlight intervals where prices are ranging. The extremities of the ranges are highlighted in real-time, with breakouts being indicated by the color changes of the extremities.
USAGE Ranging prices are defined by a period of stationarity, that is where prices move within a specific range.
Detecting ranging marke

The Accumulation and Distribution indicator is a volume-based indicator that was essentially designed to measure underlying supply and demand. This is accomplished by trying to determine whether traders are actually accumulating (buying) or distributing (selling). This is accomplished by plotting a cumulative total of the money flow volume for each period. This indicator can reveal divergences between volume flow and actual price to primarily affirm a current trend or to anticipate a future reve
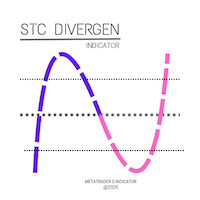
Overview The Stochastic Divergence Indicator is a powerful tool designed to detect potential market reversals by combining the popular Stochastic Oscillator with divergence analysis. Divergence occurs when the price moves in the opposite direction of the indicator, signaling a possible trend exhaustion or reversal. This indicator visually marks bullish and bearish divergences on the chart, helping traders make informed decisions with greater confidence. Key Features • High Accuracy (No Repaint)

Alwinson Active Trades Info Simple. Informative. Instantly Visible on Your Chart. Alwinson Active Trades Info is a lightweight custom indicator that displays a real-time summary of your currently open trades —right on your chart. No more switching tabs just to see what pairs are active and how much lot size is in play. Key Features: Displays a list of all symbols with open positions in your trading account. Shows the dominant position type (BUY or SELL) per symbol. Calculates and displays t

To get access to MT4 version please contact via private message. This is the exact conversion from TradingView: "3rd Wave" by " LonesomeTheBlue ". The screenshot shows similar results from tradingview and Metatrader when tested on ICMarkets on both platforms. This is medium-load processing indicator and updates are available per bar close. This is a non-repaint indicator. All input options are available. Buffers are available for processing in EAs. You can message in private chat for further cha

Zone to Zone Indicator for MT5 Unleash the full potential of your trading strategy with the "Zone to Zone" indicator for MetaTrader 5. This advanced tool provides unparalleled precision and versatility, making it an essential addition to any trader's toolkit. Key Features: MT5 Compatibility : Seamlessly integrates with the MetaTrader 5 platform for a smooth and efficient trading experience. Accurate Historical Resistance/Support Zones : Effortlessly draw and identify key resistance and support

Do you find it difficult to track and manage your open positions across multiple different symbols in MetaTrader 5? Do you need a quick and comprehensive overview of your current market exposure and the performance of each symbol individually? The "Dynamic Exposure Table" indicator is your ideal tool! This indicator displays a clear and detailed table in a separate window below the chart, summarizing all your open positions and intelligently grouping them by symbol, giving you a complete view of

When there is no position, when changing the color, you can consider opening an order. With the fluctuation of the market, when the current color changes again, you need to close the position and leave. Suitable for different cycles, the trading rules are simple and require friends to explore on their own.
I hope friends who use this indicator can make a lot of money, rolling bigger and bigger like a snowball. thank you!

The TrendKiller Oscillator is a custom MetaTrader 5 (MT5) indicator designed to help traders analyze price deviations from a moving average, displayed in a separate window. It calculates the difference between a chosen price (e.g., close) and a moving average (default: 14-period SMA), producing a detrended value that oscillates around a zero line. Dynamic maximum and minimum levels, computed over a user-defined period (default: 50 bars), provide context for identifying overbought/oversold condi

SpectralEdge Periodogram - Cycle Analysis Indicator
Overview
The SpectralEdge Periodogram is a powerful technical analysis indicator for MetaTrader 5, designed to uncover hidden price cycles in financial markets using Fast Fourier Transform (FFT). By transforming price data into the frequency domain, this indicator reveals the dominant cycles driving market movements, enabling traders to identify repeating patterns and make informed trading decisions. Whether you're a day trader, swing trader

Este indicador calcula e exibe no gráfico o preço justo do mini índice (WIN) com base em dados fundamentais do mercado. Além disso, ele traça automaticamente linhas de suporte e resistência percentuais , ajudando você a visualizar zonas importantes de preço. É como ter uma régua financeira no gráfico, mostrando onde o preço "deveria estar", de forma objetiva, considerando o cenário macroeconômico!
O indicador usa uma fórmula de precificação de contratos futuros baseada em: O preço à vista do Ib

이 지표를 구매하신 분께는 다음과 같은 혜택이 무료로 제공됩니다:
각 거래를 자동으로 관리하고, 손절/익절 수준을 설정하며, 전략 규칙에 따라 거래를 종료하는 전용 도우미 툴 "Bomber Utility" 다양한 자산에 맞게 지표를 설정할 수 있는 셋업 파일(Set Files) "최소 위험", "균형 잡힌 위험", "관망 전략" 모드로 설정 가능한 Bomber Utility의 셋업 파일 이 전략을 빠르게 설치, 설정, 시작할 수 있도록 돕는 단계별 영상 매뉴얼 주의: 위의 모든 보너스를 받기 위해서는 MQL5 개인 메시지 시스템을 통해 판매자에게 연락해 주세요. 독창적인 커스텀 지표인 “Divergence Bomber(다이버전스 봄버)”를 소개합니다. 이 지표는 MACD 다이버전스(괴리) 전략을 기반으로 한 올인원(All-in-One) 거래 시스템입니다.
이 기술 지표의 주요 목적은 가격과 MACD 지표 간의 다이버전스를 감지하고, **향후 가격이 어느 방향으로 움직일지를 알려주는

NOTE: CYCLEMAESTRO is distributed only on this website, there are no other distributors. Demo version is for reference only and is not supported. Full versione is perfectly functional and it is supported. CYCLEMAESTRO , the first and only indicator of Cyclic Analysis, useful for giving signals of TRADING, BUY, SELL, STOP LOSS, ADDING. Created on the logic of Serghei Istrati and programmed by Stefano Frisetti ; CYCLEMAESTRO is not an indicator like the others, the challenge was to inter

Candle Volume Strength는 매수자와 매도자 간의 진행 중인 전투에 대한 통찰력을 제공하는 고급 볼륨 분석 지표입니다. 실시간 볼륨 변화를 계산하고 시각화하여 트레이더가 브레이크아웃, 트렌드, 리트레이스먼트 및 반전을 더 정확하게 확인할 수 있도록 도와줍니다.
주요 특징: 거래량 기반 확인 – 이 지표는 틱 거래량 변화를 모니터링하고 매수자와 매도자 간에 시장 지배력이 변할 때 경고합니다. 추세 및 돌파 검증 – 거래량 분포를 분석함으로써 트레이더는 시장 추세와 돌파 신호의 강도를 확인할 수 있습니다. 반전 및 되돌림 감지 – 볼륨 패턴은 가격 움직임의 잠재적인 전환점을 식별하는 데 도움이 됩니다. 지원 및 저항에 대한 통찰력 – 주요 수준 근처에서 거래량이 증가하면 신뢰성에 대한 확신이 커집니다. 간단하고 효과적인 시각화 – 쉽게 해석할 수 있도록 매수 및 매도 강도를 히스토그램 막대로 표시합니다. 캔들 볼륨 강도는 거래자가 볼륨 분석을 활용하여

제로 랙 EMA 인디케이터 (AI 최적화) – 전문가용 트레이딩 도구
기존 이동평균의 지연을 제거한 AI 최적화 알고리즘으로 빠른 시장 신호를 포착하세요. 주요 기능: AI 초고속 처리 : 지연 없이 트렌드 전환 감지. 다중 시장 호환 : 외환, 주식, 암호화폐, 원자재 지원. 명확한 트렌드 : 노이즈 제거 후 핵심 신호 강조. 조기 신호 탐지 : 일반 EMA보다 빠른 강세/약세 신호. 시각적 신호 : 초록/빨강 색상 전환으로 방향 인식. 맞춤 설정 : 기간 및 가격 소스 조정 가능. 다중 타임프레임 : 1분 차트부터 월봉까지. 전략 유연성 : RSI, MACD, 피보나치와 병용 가능. 장점: 실전 검증 알고리즘 : 라이브 시장에서 신뢰성 입증. 초보자부터 전문가까지 : 간편한 사용 + 강력한 성능. 시장 변화 적응력 : 모든 페이즈에서 유효. 추천 대상: 빠른 신호 확인을 원하는 트레이더. 지연으로 인한 손실 감소를 목표로 하는 투자자. 기술적 분석 도구 업그레이드 희망자. AI
FREE

I am a trader specializing in the development of rare , exclusive , high-performance trading bots designed for serious traders who are committed to achieving consistent profitability and success. This free indicator is more than just a visual tool—it powers the Midnight Throttle EA , an automated trading system that executes trades based on the precise market conditions this indicator observes. Midnight Watch : A Pro-Level Tool for Precision Market Analysis. An advanced , multi-functional MetaTr
FREE

RSI ABCD 패턴 파인더: 기술적 전략 1. 지표 작동 방식 클래식 RSI 와 ABCD 하모닉 패턴 자동 감지를 결합합니다. 주요 구성 요소 표준 RSI (조정 가능한 기간) 고점 및 저점 마커 (화살표) ABCD 패턴 (초록/빨강 선) 과매수 (70) 및 과매도 (30) 필터 2. MT5 설정 period = 14 ; // RSI 기간 size = 4 ; // 최대 패턴 크기 OverBought = 70 ; // 과매수 수준 OverSold = 30 ; // 과매도 수준 Filter = USE_FILTER_ YES ; // 확인 필터 3. 트레이딩 전략 3.1. 매수 진입 (강세 ABCD) 조건: RSI가 다음을 형성: 저점 ( A ) → 고점 ( B ) → 더 높은 저점 ( C ) D 는 과매도 (30) 위지만 C 아래 확인: A-B-C-D 연결 초록 선 목표: TP1: B-C의 61.8% TP2: B-C의 100% 손절: D 아래 3.2. 매도 진입 (약세 ABCD) 조건:
FREE
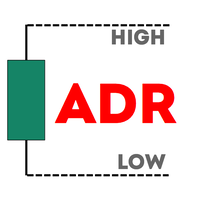
Haven Average Daily Range 는 외환 및 기타 금융 시장의 금융 자산에 대한 평균 일일 가격 범위를 계산하고 표시하는 지표입니다. 다른 제품 보기 -> 여기 주요 특징: 5일, 10일, 20일 등 여러 기간을 기반으로 한 ADR 계산 범위에 도달하면 스타일이 자동으로 변경되는 ADR 레벨 표시 하루의 거래 시작과 종료를 명확하게 시각적으로 표시 색상 및 선 두께와 같은 사용자 지정 가능한 표시 설정 더 나은 시각화를 위한 가격 라벨 표시 이 지표는 트레이더가 자산의 변동성을 평가하고, 잠재적인 반전 수준을 식별하며, 하루의 거래 목표를 계획하는 데 도움을 줍니다. D1 이하의 모든 시간대 및 모든 거래 자산에 적합합니다. 거래에서의 활용: ADR은 여러 방식으로 거래 결정에 효과적으로 사용할 수 있습니다. 가격이 ADR의 상단 경계에 도달하면, 이는 특히 다른 과매수 신호와 함께 나타날 경우 잠재적인 매도 영역을 나타낼 수 있습니다. 마찬가지로 ADR의 하단 경계
FREE
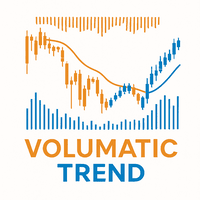
Volumatic Trend is a powerful, trend-following indicator that merges directional analysis with real-time volume behavior. By combining adaptive trend logic and volume overlays, it gives traders a detailed snapshot of market conviction and potential turning points. From instant trend shift detection to volume-weighted candle visuals, this tool brings deeper context to price movement. MT4 Version - https://www.mql5.com/en/market/product/136210/ Join To Learn Market Depth - https://www.mql5.co
FREE
“소품 회사에서 금지한 이 비밀 거래 도구(그들은 당신이 알기를 원하지 않습니다!)”
EA 없이 궁극의 트레이딩 에지를 발견하세요! (트레이더를 위해, 트레이더에 의해 만들어졌습니다. 로봇이 아닌 순수한 트레이딩 파워!)
가짜 돌파, 급반전, 시세 조작으로 어려움을 겪고 계신가요? 이 강력한 트레이딩 도구는 시장이 빠르게 움직일 때에도 레이저처럼 정확한 신호를 제공하므로 전문가처럼 높은 확률의 진입을 포착할 수 있습니다! ---------------------------------------------------------------------------------------------------
나의 추천 :-최적의 신호 강도 설정 모든 종류의 (FX 쌍 / 금 / 지수 / 암호 화폐) 등... 백 테스트 전에 입력 탭에서 원하는 TF를 선택하고 신호 값을 변경하십시오. >> ( 4 또는 5 ) >> 1m / 5m / 15m / 30m / 1H / 4H의 경우 >> (2 또

멀티 타임프레임 캔들 지표는 트레이더가 하위 타임프레임 분석을 상위 타임프레임 구조에 맞춰 조정할 수 있도록 설계된 강력한 시각화 도구입니다. 선택한 상위 타임프레임(H1, H4, D1 등)의 캔들을 현재 차트에 직접 표시하여 차트를 전환하지 않고도 전반적인 시장 흐름을 더욱 명확하게 파악할 수 있도록 도와줍니다.
이 지표는 누구에게 필요한가요? 이 도구는 다음과 같은 경우에 적합합니다. 스마트 머니 컨셉트(SMC) / ICT 트레이더는 낮은 시간대에서 거래를 실행하면서 높은 시간대 편향에 의존합니다. 일일 또는 세션별 모멘텀과 동기화를 유지하고자 하는 스캘퍼와 당일 거래자. 작은 차트에서 진입 항목을 구체화하는 동안 HTF 구조를 빠르게 살펴보고 싶어하는 스윙 트레이더.
가격 움직임, 수요와 공급 또는 추세 추종 시스템을 이용해 거래하든, 이 지표는 상위 시간대의 강점에 의해 진입이 뒷받침되도록 보장합니다.
전략 개선 다중 시간대 캔들은 다음을 개선하는 데 도움이 됩니다
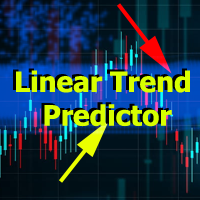
Linear Trend Predictor - 진입 지점과 방향성 지원선을 결합한 추세 지표입니다. 고가/저가 채널을 돌파하는 원칙에 따라 작동합니다.
지표 알고리즘은 시장 노이즈를 걸러내고 변동성과 시장 역학을 고려합니다.
표시기 기능
평활화 방법을 사용하여 시장 추세와 BUY 또는 SELL 주문을 시작하기 위한 진입 시점을 보여줍니다. 모든 기간의 차트를 분석하여 단기 및 장기 시장 움직임을 파악하는 데 적합합니다. 어떠한 시장과 시간대에도 적용할 수 있으며, 입력 매개변수를 통해 거래자는 자신에게 맞게 지표를 독립적으로 사용자 지정할 수 있습니다. 설정된 지표 신호는 사라지거나 다시 그려지지 않습니다. 이는 캔들 마감 시 결정됩니다.
여러 유형의 알림이 화살표와 결합되어 있습니다. 이 지표는 독립적인 거래 시스템으로 사용할 수도 있고, 다른 거래 시스템에 추가하는 용도로도 사용할 수 있습니다. 모든 수준의 경험을 가진 거래자가 사용할 수 있습니다.
주요 매
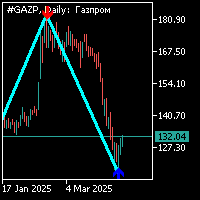
지그자그 표시기는 34 의 주기로 표준으로 추가 화살표 신호가 있습니다. 추가 신호는 지그재그 표시기와 별도로 계산됩니다.이 표시기에 대한 작업은 다음과 같습니다. 지그재그 표시기의 세그먼트를 형성하고 추가 화살표 신호가 나타날 때 화살표 방향으로 위치를 열어야합니다. 이전 팔의 상단에 있는 추가 신호(화살)의 반대 방향으로 지그자그 표시기의 다른 팔을 형성할 때,대기 중인 순서의 위치를 설정하는 것이 가능해집니다.3. 반대쪽 지그재그 어깨에서 추가 신호(화살표)로 형성이 완료되면 이전에 열린 위치에 추가하거나 정지 손실을 이 수준으로 이동할 수 있습니다;4. 보수적 인 거래 모드에서 거래하는 경우 가격 움직임의 첫 번째 철수 전에 추가 포지션을 열 수 없습니다. 정확하게 시장에 진입하려면 지그재그 표시기 세그먼트의 형성과 수석 시간대에 추가 신호의 출현을 기다릴 수 있으며 열린 위치에서 40 점보다 더 가까운 정지를 배치 할 수 있습니다. 6. 당신이 무역에 추가 위치를 추가 한

MACD Scalper Zero Lag is a fast, accurate, and reliable indicator designed to give traders the real-time edge they need. By eliminating the lag found in traditional MACD indicators, it delivers instantaneous divergence alerts on both forex and cryptocurrency markets. With its robust algorithm and user-friendly interface, this tool not only detects early trend reversals but also provides clear and actionable signals. The indicator offers customizable settings so that you can adjust sensitivity a
FREE

FREE
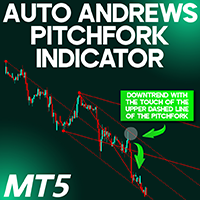
Auto Andrews Pitchfork indicator MT5
The Auto Andrews Pitchfork indicator MT5 is a specialized technical tool on the MetaTrader 5 platform that automatically plots three equidistant, parallel trendlines by using three selected pivot points (significant highs and lows). These lines serve as evolving zones of support and resistance, providing actionable trade signals when price interacts with them. This tool simultaneously generates two pitchfork patterns—one outlined in dotted lines and the othe
FREE
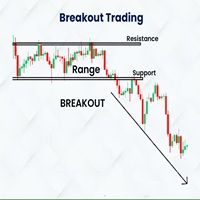
Indicador Basado en la estrategia de ruptura del rango de londres de Amaury Benedetti.
Este indicador dibuja automaticamente el rango, el maximo y minimo y sus correspondientes lineas de stoploss, entrada y takeprofit.
SE RECOMIENDA USAR EN M1 EN EL US30 (DE ACUERDO A LA ESTRATEGIA)
Los valores se pueden modificar de acuerdo a la necesidad del usuario, tambien se tienen mas configuraciones para dibujar cualquier rango en diversos horarios y con diferentes configuraciones de sl, tp, etc
Detal
FREE

# Wave Trend Oscillator (WTO) User Guide
## Overview Wave Trend Oscillator is a powerful technical analysis tool used to analyze price momentum and trend direction. It visualizes market conditions using two main lines (WT1 and WT2) and a histogram.
## Components 1. **WT1 (Green Line)**: Main trend indicator 2. **WT2 (Red Line)**: Signal line 3. **Histogram (Blue)**: Shows the difference between WT1 and WT2 4. **Arrows**: Mark crossover points - Green Arrow: WT1 crosses above WT2 (Buy signa
MetaTrader 마켓은 거래로봇과 기술지표를 판매하기에 최적의 장소입니다.
오직 어플리케이션만 개발하면 됩니다. 수백만 명의 MetaTrader 사용자에게 제품을 제공하기 위해 마켓에 제품을 게시하는 방법에 대해 설명해 드리겠습니다.
트레이딩 기회를 놓치고 있어요:
- 무료 트레이딩 앱
- 복사용 8,000 이상의 시그널
- 금융 시장 개척을 위한 경제 뉴스
등록
로그인
계정이 없으시면, 가입하십시오
MQL5.com 웹사이트에 로그인을 하기 위해 쿠키를 허용하십시오.
브라우저에서 필요한 설정을 활성화하시지 않으면, 로그인할 수 없습니다.