MetaTrader 5용 새 기술 지표

우선, 이 트레이딩 인디케이터는 재탐색되지 않으며, 다시 그려지지 않고, 지연이 없는 점을 강조할 가치가 있습니다. 이는 수동 트레이딩과 알고리즘 트레이딩 모두에 이상적입니다. 사용자 매뉴얼, 프리셋 및 온라인 지원이 포함됩니다. AI Trend Pro Max는 정밀도, 강력함, 단순함을 추구하는 트레이더를 위해 설계된 정교한 올인원 트레이딩 시스템입니다. 이전 지표들의 개발을 바탕으로 만들어졌으며, 현재까지 가장 진화된 버전으로, 여러 신호 층, 전문 필터 및 스마트한 사용자 인터페이스가 장착되어 있습니다. 초보자든 전문가든 상관없이, AI Trend Pro Max는 어떤 시장 상황에서도 자신감을 가지고 거래할 수 있도록 필요한 모든 것을 제공합니다. 주요 전략 및 시스템 로직: 다층 신호 엔진: 트렌드 모멘텀, 가격 강도, 거래량, RSI, 볼린저 밴드 및 캔들 색상 논리를 결합하여 고확률의 진입 신호를 제공합니다. 트렌드 모멘텀: 트렌드가 강화되고 있는지 약화되고 있는지

CONTACT US after purchase to get the Indicator Manual. Download Now! Offer valid only for next 10 Buyers. Price will increase gradually !
Download the Metatrader 4 Version Read the product description carefully before purchasing the product. Due to regulatory restrictions, our service is unavailable in certain countries such as India, Pakistan, and Bangladesh. Disclaimer: • Our products are available only on mql5.com. • We never contact anyone or sell our products privately. • We d

그만큼 ICT 아시아 범위 표시기 ICT Asian Range Trading Strategy를 기반으로 트레이더가 주요 시장 구조와 유동성 구역을 식별하는 데 도움이 되도록 설계된 강력한 도구입니다. 아시아 세션(오후 7시부터 자정까지 뉴욕 시간)의 최고 및 최저 가격 수준을 표시하고 이후 거래 세션의 시장 움직임에 대한 중요한 통찰력을 제공합니다. 이 지표는 유동성 스윕과 공정 가치 갭(FVG)을 강조하여 거래 정확도를 높여 ICT 트레이더에게 필수적인 도구입니다.
아시아 산맥이 중요한 이유는 무엇입니까? 아시아 세션은 이후 거래 세션에서 가격 움직임을 위한 기반을 마련합니다. 이 범위를 이해하면 트레이더는 시장 심리를 예측하고, 유동성 구역을 찾고, 전략적 거래 진입 및 종료를 설정할 수 있습니다.
ICT 아시아 범위 지표의 주요 장점 및 사용 방법 ICT Asian Range Indicator는 트레이더에게 초기 시장 통찰력을 제공하여 런던과 뉴욕

Stats Probability (CStatsBoard) MQL5 지표는 가격 변동을 백분율로 통계적으로 측정하고, 서브 윈도우 내에서 전문적인 테이블 형식으로 실시간으로 표시하도록 설계된 첨단 분석 도구입니다. 빠른 업데이트와 뛰어난 정확성을 자랑하며, 시장 동향을 이해하고 정보에 기반한 결정을 내리고자 하는 트레이더에게 필수적인 자원입니다. 주요 기능:
이 도구는 서브 윈도우 내에서 세련되고 전문적인 테이블(CStatsBoard) 형태로 표시되며, 실시간으로 업데이트되어 빠른 성능과 높은 정확성을 보장합니다. 가격 변동성을 평가하기 위해 네 가지 분석 옵션을 제공합니다: 최대 범위 통계 (Max Range Stats): 한 달 내 최고 가격과 최저 가격 사이의 백분율 범위를 계산합니다. 시가-고가 통계 (Open - High Stats): 해당 월의 시가에서 해당 월의 고가까지의 백분율 차이를 측정합니다. 시가-저가 통계 (Open - Low Stats): 해당 월의 시가에서

Overview:
"TrendLine Alerts" is a dynamic, multi-functional trading tool designed to monitor and alert traders in real-time when price action touches or breaks critical technical levels. Built for precision, it seamlessly tracks trendlines, horizontal support/resistance, vertical time-based lines, and equidistant channels , ensuring you never miss a key market movement. Whether you’re scalping, swing trading, or managing long-term positions, this indicator acts as your 24/7 market sentinel. K

- Real price is 80$ - 50% Discount (It is 39$ now) Contact me for instruction, any questions! - Lifetime update free - Non-repaint - I just sell my products in Elif Kaya Profile, any other websites are stolen old versions, So no any new updates or support. Advantages of M1 Scalper Pro Profitability: M1 Scalper Pro is highly profitable with a strict exit strategy. Frequent Opportunities: M1 Scalper Pro takes advantage of numerous small price changes. Minimal Market Risk: Limited exposure redu
High Low Tracker는 주요 가격 수준을 식별하는 데 있어 정확성과 명확성을 중시하는 모든 트레이더에게 필수적인 지표입니다. ICT(Inner Circle Trader) , BTMM(Bank Trading Market Maker) , SMC(Smart Money Concepts) 와 같은 기관 전략을 사용하는 트레이더를 위해 설계된 이 도구는 중요한 최고점과 최저점을 현재 차트에 직접 표시하여 다중 시간대 분석을 간소화합니다. 스캘핑, 데이 트레이딩 또는 스윙 트레이딩을 하든 이 지표는 차트를 계속 전환하지 않고도 주요 지지선과 저항선에 즉시 액세스할 수 있도록 해줍니다.
이 지표는 누구에게 필요한가? 이 도구는 다음과 같은 거래자에게 적합합니다. 낮은 타임프레임 항목(예: ICT 및 SMC)에는 더 높은 타임프레임 편향을 사용합니다. 정지 사냥과 트랩 설정을 위한 유동성 구역을 식별해야 합니다. 주문을 할 때는 주요 지지/저항 수준을

Multi Currency Multi Time Market Scan Signals It is an Advanced multi-utility dashboard which works with full customization of signal settings and graphical interface. It works with Multi Symbols and Multi-Time frames from 1 SINGLE CHART TEMPLATE. It will automatically open the charts where the latest signals had formed- showing the important levels (Entry, Targets, Stop Loss) Many types of sorting methods for the scanner. A robust ENTRY based on TREND OF MULTI-TIME FRAMES ( Complex Signals
RSI 다이버전스 스위트 프로 - 메타트레이더 5 고급 지표 개요 RSI 다이버전스 스위트 프로는 가격과 RSI 간의 다이버전스를 자동으로 감지하여 고정밀 거래 신호를 제공하는 메타트레이더 5용 고급 기술 지표입니다. 이 전문 지표는 RSI의 강력한 기능과 다이버전스 분석, 다중 시간대 지지/저항 및 완벽한 경고 시스템을 결합합니다. 주요 기능 고급 다이버전스 감지 4가지 유형의 다이버전스: 일반 상승 다이버전스: 가격은 저점을 낮추지만 RSI는 저점을 높일 때의 상승 신호 일반 하락 다이버전스: 가격은 고점을 높이지만 RSI는 고점을 낮출 때의 하락 신호 숨겨진 상승 다이버전스: 상승 추세 확인 (지속) 숨겨진 하락 다이버전스: 하락 추세 확인 (지속) 통합된 품질 필터: 최소 거래량 필터 ATR 변동성 필터 RSI 레벨 필터 (과매수/과매도) 캔들 거리 필터 2. 강도 분류 시스템 신호 자동 분류: 강함: 설정 가능한 임계값보다 큰 RSI 차이를 보이는 다이버전스 보통: 최소 기

ZigZagMCPro enhances the traditional ZigZag by combining precise turning point detection with Monte Carlo simulations and GARCH-based dynamic volatility . This indicator helps traders: Visualize potential reversal zones with probabilistic projections. Estimate confidence levels for trend continuation or exhaustion. Adapt to changing market volatility in real time. Make smarter decisions backed by statistical modeling.
FREE

The POC_Levels indicator calculates and displays the 3 most frequently occurring price levels (Points of Control – POC) based on historical candles. It is useful for identifying areas of high market interest (like support/resistance zones) across any timeframe. How It Works
The indicator analyzes the last LookbackBars candles. It counts how many times each price level (based on the selected price type) appears. Then it selects the top 3 most frequent prices and draws horizontal lines at those l
FREE
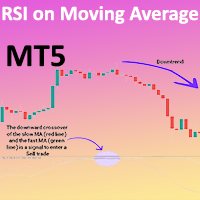
RSI On Moving Average Indicator for MT5 The RSI On Moving Average Indicator Merges Moving Average Crossovers with the Relative Strength Index (RSI) to provide a powerful tool for assessing market momentum and trend direction. By integrating these two analytical methods, this indicator enhances trading precision, helping traders identify potential buy and sell opportunities more effectively. This indicator operates with two oscillating lines fluctuating between 0 and 100 , which signal optimal en
FREE
MFI Divergence is a technical indicator that detects regular bullish and bearish divergences between price and the Money Flow Index (MFI) at swing highs and lows. It highlights potential reversal points by drawing clean green (bullish) and red (bearish) arrows directly on the chart. The indicator uses configurable swing detection, customizable MFI period, and an optional MFI threshold filter to show signals only in oversold/overbought zones. Alerts are triggered only once per bar on candle close
FREE
English:
Anchored Linear Regression Channel (ALRC)
Description:
The Anchored Linear Regression Channel (ALRC) is an advanced technical analysis tool that enhances the traditional linear regression channel by allowing it to be anchored to a confirmed pivot point. This provides a more accurate and reliable reading of price behavior in relation to key structural points on the chart.
Key Features:
Anchoring to Confirmed Pivots: Manually select a significant pivot to fix the channel, ensuring t
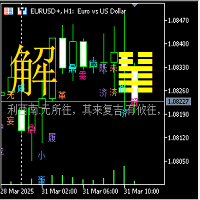
I Ching 64 Hexagram Change Indicator
1. Hexagram Indicator Description: (1) This 64 Hexagram Change Indicator is based on the Yin-Yang transformation thought of the "I Ching" philosophy in ancient Chinese culture, integrating the results of the long and short game of each candlestick K-line period of the financial trading K-line chart, using China's oldest prediction coding method, in the form of the I Ching 64 hexagrams, combining the Yin-Yang of each line of the hexagram with the Yin-Yang of
FREE
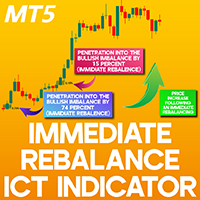
Immediate Rebalance ICT Indicator for MT5 The Immediate Rebalance Indicator is an advanced tool designed to pinpoint price rebalancing zones within MetaTrader 5 . Market imbalance arises when supply and demand are uneven, often triggering sharp price movements. This indicator identifies gaps by analyzing three consecutive candles. If a gap is present between the first and third candle wicks, and the third candle’s wick overlaps the first candle’s wick, it signals a trend continuation. Such price
FREE

AZ_custom_daily_candle The indicator allows you to draw the contours of daily candles on small timeframes, plus you can customize the display of, for example, an H1 candle and see how it looks on the M5 chart (I think this is a useful setting for scalping). Further, it is possible to shift the beginning/end of drawing candles, change the background color, line thickness. Suggestions and wishes are welcome. v 1.05 (31/03/2025)
By demand, I have added the ability to turn on/off daily maximum/mini
FREE

Volume Profile Indicator – User Guide Description: The Volume Profile Indicator is a powerful tool designed for MetaTrader 5. It visualizes market activity using volume distribution across price levels, showing: Histogram of volume at each price bin POC (Point of Control) – the price with the highest traded volume Value Area – the range covering a configurable percentage of volume (e.g. 70%) Support levels: Min, Max, and Pivot Average tick size for BUY and SELL movements Inputs and Parameters:
FREE

Identify key support/resistance levels and potential breakouts with the HighestOpenIndicator! Based on daily, weekly, and monthly high/low/open prices, it provides clear signals for informed trading decisions. Featuring the iconic "HO" from the logo, this MT5 version is ported from the original MT4 indicator by TooSlow on ForexFactory, with contributions from Dave (4xtrader2009). Disclaimer: This indicator is provided for educational purposes only. The author is not responsible for any losses in
FREE
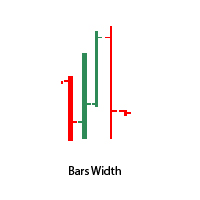
This indicator will allow you to change the thickness of the lines and the stroke color, due to which you can get a thicker bar on the chart. By default, the indicator has a bar thickness of 2. There is also an option in the input parameters to select the color of the bullish and bearish bars. When an indicator is added to the chart, the chart immediately changes its rendering style to "bar".
FREE

I greatly appreciate your interest in my product and this document will serve as an explanation and guide to my indicator. (DmRO indicator) This is a visual indicator that spots potential incoming trends/continuations. Like any other indicator/strategy, nothing plays out 100 percent all the time. But this tool offers high probability outcomes and is something that is useful to have no matter what your strategy is. The levels are really specific to a time and condition that proved to be pretty c
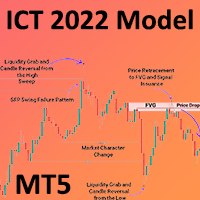
ICT 2022 Model Indicator for MetaTrader 5 The ICT 2022 Indicator is developed based on essential trading principles such as liquidity grabs (Sweep), Change of Character (CHoCH), fake breakouts (SFP), and Fair Value Gaps (FVG) .
By integrating these concepts, the indicator visually represents them on the price chart, making it an invaluable resource for traders and analysts following the ICT trading methodology . Indicator Specifications The table below highlights the key features of this indic
FREE
Full Functionality of the MT5
"TWR DERIV MTF BREAKOUT" INDICATOR
FOR APP SOURCE CODE: t.me/KingRennie
APP SOURCE CODE WORKS FOR MT4 AND MT5
FEE =$1500 The MT5 " TWR DERIV MTF BREAKOUT " INDICATOR is a comprehensive trading tool designed to help traders make informed decisions by utilizing Fibonacci levels, time-based analysis, and demarcating major trading sessions. This INDICATOR is ideal for both novice and experienced traders who want to enhance their trading strategies with advanced tech

Chaikin Money Indicator (CMF) – Free Trading Indicator
The Chaikin Flow Indicator (CMF) is a technical analysis tool based on the original Chaikin Money Flow (CMF) indicator, developed by Marc Chaikin in the 1980s. It is designed to track capital flows into an asset and helps identify buying and selling pressure. This indicator is useful for both intraday trading and medium-term analysis .
How CMF Works CMF analyzes price action and volume over a given period by calculating the Money Flow Mult
FREE
EquiPeak Drawdown Tracker is an indicator designed to monitor and log your account’s maximum drawdown in real-time. It's not just a simple drawdown notifier: its primary purpose is to visually compare your current drawdown against a manually input historical maximum drawdown, ensuring your Expert Advisors (EAs) stay within their expected risk boundaries. Special offer: If you've already purchased any of our EAs and left a review on the Market, you can get this indicator completely free. Just sen
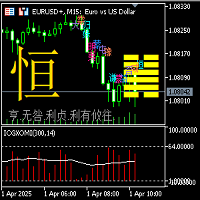
Indicator description of Yijing Guaxiang Oscillation Mean Indicator: (1) This Yijing Guaxiang change indicator is based on the Yin-Yang transformation thought of the "I Ching" philosophy in ancient Chinese culture, integrating the results of the long-short game in each candlestick K-line period of the financial trading K-line chart, using China's oldest prediction coding method, in the form of the 64 hexagrams of the I Ching, combining the Yin-Yang of each line of the hexagram with the Yin-Yang

Expert Advisors often use a channel around standard MAs. The indicator builds such a channel and has three buffers: MA, MA Channel Top and MA Channel Bottom.
Now with the help of this single indicator you can plot a channel around the MA on the chart similar to similar Envelopes or Bollinger Bands.
There are a lot of strategies for using it: on the breakout of borders or on the bounce from them.
FREE

RTS5Pattern Profi Professional Pattern Detection for MetaTrader 5 RTS5Pattern is a professional indicator for MetaTrader 5, created specifically for Price Action traders who rely on clean charts and the key importance of support/resistance levels. This tool combines the simplicity of Price Action with intelligent analysis of recurring price structures. It is designed to quickly and accurately identify price patterns in important contexts—without cluttering the chart with unnecessary indicators
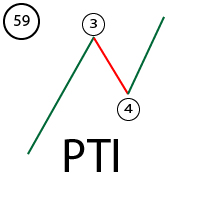
PTI is an index developed by Tom Joseph, which compares the points of Purchase/Third Wave Sales with a Buying Momentum/Sales of The Fourth Wave. This comparison will then be transferred to an algorithm that calculates the VALUE of the PTI INDEX. You can learn more about this index by reading his book Simplified Wave Analysis.
This indicator is an example of my understanding of this index.
This index should be used as follows: 1) You need to click on the "Start Calculation" chart 2) Make the

The Elephant Candle is an indicator for MT5. It draws arrows when strong bullish or bearish candles appear. Strong candles frequently initiate a new trend. The arrows can be used in expert advisors. This indicator can improve already existing trading strategies. The indicator is very fast and doesn't repaint.
Inputs Period Candle Multiplier Candle Niceness [%] Arrow Size Enable Alert Enable Push Notification Enable Email

An indicator displaying the levels of the previous candle, any time frame, opening, closing, minimum, maximum. If the candle closes above the opening, the opening and closing lines are displayed in green, implying that the trend is upward. If the closing is below the opening, the lines are painted red, signaling that the trend is downward. The quotes for these levels are displayed in the right corner.

Free forever simple pip meter for MT5 with customizable font color. Display profit or loss in both points count and currency value. Supports 4 currency symbols ($,€,£ ,¥). For unsupported currencies, it shows a 3-character currency short form. Enhance your trading interface with clarity and precision. Easy to use and tailored for diverse Forex traders. Perfect for MT5!
FREE

- Displays horizontal lines for Previous Day High (PDH) and Previous Day Low (PDL) on the chart. - Customizable line colors via input parameters. - Sends sound alerts, pop-up notifications, and mobile push notifications upon the initial crossover of PDH or PDL. - Alerts are triggered only once per crossover event; they re-trigger only if the price moves away and re-crosses after a specified minimum interval. - Automatically updates the PDH/PDL levels at the start of each new day. - All indicator
FREE
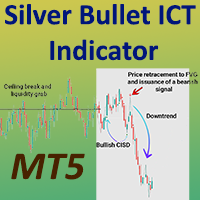
Silver Bullet ICT Indicator in MetaTrader 5 The Silver Bullet ICT Indicator is an advanced tool for MetaTrader 5 , designed to analyze market liquidity and key price levels during New York trading hours based on ICT (Inner Circle Trader) principles . This indicator identifies potential trade zones by monitoring high and low price movements and detecting liquidity absorption . When the price reaches a support or resistance level and then retreats to its prior range after capturing liquidity, the
FREE
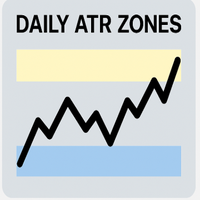
Daily ATR Zones – Precision Intraday Range Mapping Daily ATR Zones is a clear tool that plots intraday high/low targets using the Average True Range (ATR) of the previous days. These zones help traders anticipate potential price extremes , identify liquidity pockets , and define reversal or breakout levels — all based on objective volatility data. Key Features: Flat Zone Logic — Based on Open ± ATR , not bands around price
Custom Zone Thickness — Adjustable via ATR ratio ( ZoneHeightRatio )
FREE

The indicator shows your profit and loss (PnL) for the current day right on your trading chart. Anchored at the top-right corner, it displays "PnL: [amount]"—green if you’re up, red if you’re down, white if it’s zero. Every time you close a trade, it updates instantly, adding up your profits, commissions, and swaps from all buys and sells trades since midnight. No fuss, no extra charts—just real-time feedback on how your day’s going.
FREE
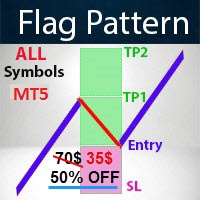
- Real price is 70$ - 50% Discount (It is 35$ now) Contact me for instruction, any questions! Related Product: Gold Trade Expert MT5 , Professor EA - Non-repaint - Lifetime update free I just sell my products in Elif Kaya Profile , any other websites are stolen old versions, So no any new updates or support.
Introduction Flag patterns are an important tool for technical traders in the stock market. When interpreting a flag pattern, it is important to wait for the pattern to pick a directi

Local Time Scale Overlay is a technical indicator for MetaTrader 5 that enhances chart readability by overlaying a local time scale on the trading chart. It calculates the difference between your local system time and the server time and uses this difference to display time labels that reflect your local time at predefined intervals. The time interval is customizable via a drop‐down menu with options such as 5, 10, 15, 20, 30, 60, 120, and 480 minutes (with 15 minutes as the default).
Key Featu
FREE
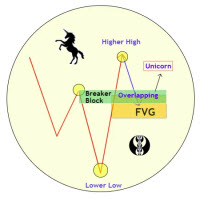
Unicorn Model ICT Indicator — Smart Trading with Precision The Unicorn Model ICT Indicator is a powerful and intelligent tool designed for traders who follow Smart Money Concepts (SMC) and Inner Circle Trader (ICT) methodologies. This indicator simplifies complex price action by visually identifying key market structures and providing high-probability trade setups. Key Features: A Bullish Unicorn Pattern A Lower Low (LL), followed by a Higher High (HH) A Fair Value Gap (FVG), overlapping
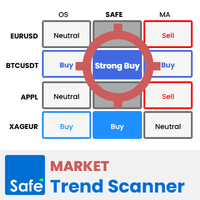
Market Trend Scanner is a trend analyzer or trend screener indicator that helps you know the trend in selected timeframe of all symbols you're watching .
This indicator provides clear & detailed analysis results on a beautiful dashboard, let you able to use this result right away without need to do any additional analysis. How it works
Step 1: Calculate values of 23 selected & trusted technical indicators (Oscillator & Moving Average indicators)
Step 2: Analyze all indicators using best prac
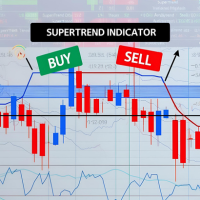
The Machine Learning Supertrend is a highly effective trading indicator specifically designed to identify and illustrate potential buy and sell signals through the use of clearly marked arrows.
One of the key advantages of this indicator is that it operates as a leading indicator, meaning it anticipates market movements rather than following them. Unlike many traditional indicators, the Machine Learning Supertrend does not lag or repaint, ensuring the signals provided are timely and reliable.
QQE Divergen – Advanced Trading Indicator
Overview
The QQE (Quantitative Qualitative Estimation) indicator is a powerful trading tool designed to enhance trend detection and market momentum analysis. QQE is an advanced version of the RSI (Relative Strength Index) that utilizes smoothed moving averages and dynamic trailing levels to generate highly accurate signals.
QQE Divergen improves upon the traditional QQE by integrating divergence detection, making it even more effective for identif

Full Functionality of the MT5
"TWR MTF BREAKOUT" INDICATOR
FOR APP SOURCE CODE: t.me/KingRennie
APP SOURCE CODE WORKS FOR MT4 AND MT5
FEE =$1500 The MT5 " TWR MTF BREAKOUT " INDICATOR is a comprehensive trading tool designed to help traders make informed decisions by utilizing Fibonacci levels, time-based analysis, and demarcating major trading sessions. This INDICATOR is ideal for both novice and experienced traders who want to enhance their trading strategies with advanced technical analys

Pro Period Separators For MetaTrader 5 The built-in period separators feature doesn’t allow users to specify the time period, so you can use this indicator to create advanced period separators, you can add daily, weekly, monthly, yearly separators on any time frame. Default Inputs DAILY SEPARATOR SETTINGS show daily separators = Yes hour of the separators = 04 minute of the separators = 00 color of the separators = Silver width of the separators = 1 style of the separators = STYLE_DOT

The Auric Pulse Indicator is a powerful MetaTrader 5 (MT5) tool designed to identify trends (uptrend, downtrend, and consolidation) in financial markets. It is particularly effective for trading Gold (XAUUSD) due to its sensitivity adjustments and multi-timeframe capabilities. Indicator Overview The indicator provides: Three trend states (color-coded): Green = Uptrend (strong bullish momentum) Red = Downtrend (strong bearish momentum) Yellow = Consolidation (sideways market) Mul
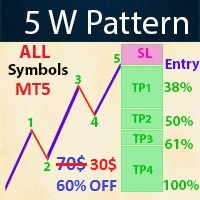
- Real price is 70$ - 60% Discount (It is 30$ now) Contact me for instruction, any questions! - Lifetime update free - Non-repaint - I just sell my products in Elif Kaya Profile, any other websites are stolen old versions, So no any new updates or support. Introduction The Elliott Wave in technical analysis describes price movements in the financial market that are related to changes in trader sentiment and psychology. The 5 W Pattern (Known as 3 Drives) is an Elliott Wave pattern that is forme
Swap Monitor Indicator v1.0 by @marekfleisi Swap Monitor is a clean, lightweight MetaTrader 5 indicator that displays real-time swap values and open position swap data for the current symbol — directly on your chart. Whether you're a swing trader optimizing overnight holds or just want clear insight into swap costs and income, Swap Monitor gives you instant transparency on: LONG & SHORT swap values Color-coded swap profitability Open positions summary (including total swap profit/loss)
FREE

ReversalRadar: Precision Trend Identification Indicator Trade With Confidence, Trade With The Trend ReversalRadar is a powerful trend identification tool designed to give traders the edge in spotting high-probability trading opportunities. By accurately identifying the current market direction, this indicator allows you to align your trading strategy with the prevailing trend, significantly increasing your potential for profitable trades. Key Features: Real-time Trend Analysis : Dynamic visual s

Indicator Statistics MultiPairs
1. Current Openning Ords
- Symbols Openning
+ Buy Orders
+ Buy Volume
+ Sell Orders
+Sell Volume
- Floating by Symbols
2. Closed Orders
- Statistics by Today, Week, Month, YTD and Volume
- Sum of Closed Orders by Symbol
3. Statistics by Day
- Statistics by Day and Volume
4. DrawDown by Day
- Each day DrawDown in Week
- Percent of DrawDown
Contact me at Telegram @MaiMew68

A state-of-the-art trading indicator, designed with advanced analytical and mathematical programming, delivers top-tier buy and sell signals. Simply enter a small buy position when a green arrow appears and a small sell position when a red arrow is shown. While signals from this indicator are infrequent, they boast exceptional accuracy when generated. Please apply your own stop-loss and take-profit levels as needed.
Camarilla Pivot Points Indicator A professional-grade indicator that displays Camarilla pivot points directly on your chart. These specialize d pivot points help identify potential support and resistance levels based on previous price action. Key Features Calculates multiple pivot levels (R6 to S6) with customizable colors Option to display previous day's pivot points Adjust able line width for better visibility Top and Bottom Channel lines (TC/BC) for range analysis Real-t

Indicador "Precision Entry Timer" - O Relógio do Timing Perfeito Este indicador revoluciona sua estratégia de trading ao identificar o momento exato para entrar em uma operação , combinando análise técnica e temporização de mercado. Ele utiliza um algoritmo avançado que cruza dados de: Volume Real (fluxo de ordens institucionais) Padrões de Candles (sequências de alta/procura com confirmação) Convergência de Médias (EMAs rápidas e lentas em alinhamento) Fuso Horário de Liquidez (períod

A utility indicator which displays account balance, equity and P&L of the current account on Chart.
Indicator parameters: Balance_Color : Change the color of the balance text Equity_Color : Change the color of the equity text Text_Size : Adjust the font size (8-20) Corner : Select which chart corner to display the text (0=top-left, 1=top-right, 2=bottom-left, 3=bottom-right) X_Offset/Y_Offset : Adjust the position from the selected corner Show_Background : Toggle the background rectangle Backg

A utility indicator which displays account balance of the current account on Chart.
Indicator parameters: Balance_Color : Change the color of the balance text Text_Size : Adjust the font size (8-20) Corner : Select which chart corner to display the text (0=top-left, 1=top-right, 2=bottom-left, 3=bottom-right) X_Offset/Y_Offset : Adjust the position from the selected corner Show_Background : Toggle the background rectangle Background_Color : Change the background color Show_Shadow : Add a shado
FREE

Hey, check out this Support and Resistance Zones indicator I’ve been working on. It’s a useful tool for tracking key price levels in the market. Here's the deal: Tiered Zones: It breaks the market into three levels of support and resistance, so you get a clearer view of where price might bounce or reverse. Multi-Timeframe: You can pull zones from higher timeframes (like H1, H4, etc.) even if you're on a lower timeframe chart – super useful for seeing the bigger picture. Dynamic Updates: The zon
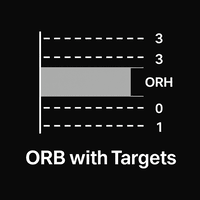
Unlock the power of the Opening Range Breakout (ORB) strategy with this highly visual, customizable MT5 indicator! Designed for intraday and session-based traders, this tool automatically plots: ️ Opening Range High & Low
️ Multi-Level Target Lines (Above & Below)
️ Clean Range Highlight (Grey Fill Box)
️ Session Timing Fully Customizable
️ Color Customization for Every Level Why You’ll Love It: Perfect for London/NY Open Breakouts ️ Adjustable number of target levels (1 to 10+)

Swing Detector — When You Think You Know Swings, Think Again
One of the key reasons many traders fail is their inattention to seemingly simple details they believe they’ve mastered. One such critical detail is the accurate identification of market swings (Swing Highs / Lows) on the chart. If you ask a group of traders to manually and consistently mark swing points on a chart, you'll find that more than half struggle to do it correctly . Not due to lack of knowledge, but because of mental fatigu

FLAT ADVANCED TREND V1.2 – Identifica Tendencias con Precisión Profesional ¿Cansado de indicadores complejos o señales falsas? ¡Flat Advanced Trend es tu solución definitiva! Combina el poder del ADX, ATR y RSI en una herramienta visualmente intuitiva y fácil de usar, diseñada para traders serios. Características Clave: Detección inteligente de tendencias – Filtra el ruido del mercado usando ADX + DI/DI- y muestra solo señales confiables.
Filtros avanzados – I

This is an indicator that includes the best basic forex indicators , without redrawing. Based on this data, a sell or buy signal is generated. It does not disappear anywhere after the signal, which gives us the opportunity to see the results on the history.
It can be used on any currency pair, crypto, metals, stocks
It is best used on an hourly chart, but other periods are also acceptable.
The best results for the period H1,H4,daily
If customers have any questions, I will answer them and af
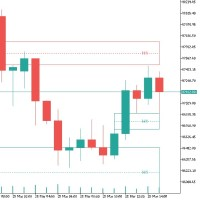
트레이딩의 임밸런스: 기본 및 전략 트레이딩의 임밸런스란 시장에서 수요와 공급 간의 불균형이 발생하는 현상을 의미합니다. 이는 매수 주문 과다(강세 임밸런스) 또는 매도 주문 과다(약세 임밸런스)로 나타날 수 있으며, 비효율적인 가격 책정으로 이어져 트레이더에게 기회를 창출합니다. 기술적 측면 "캔들 패턴" : 임밸런스는 종종 3개의 캔들 패턴으로 표시되며, 두 번째 캔들이 다른 캔들보다 길고 움직임의 방향을 결정합니다. "캔들 그림자" : 임밸런스의 주요 기준은 첫 번째와 세 번째 캔들의 그림자가 겹치지 않는 것입니다. 임밸런스 거래 방법 기본 전략 "임밸런스 식별" : 충분한 거래량 없이 가격이 급격하게 변한 영역을 찾습니다. "진입점" : 지정가 주문을 사용하여 임밸런스의 부분적 또는 전체적 중첩 이후에 거래를 시작합니다. "위험 관리" : 임밸런스 영역 외부에 스톱로스를 설정하고 임밸런스 크기의 1.5~2배로 이익을 확보합니다. 전략 예시 "임밸런스의 부분적 또는 전체적 채우
FREE
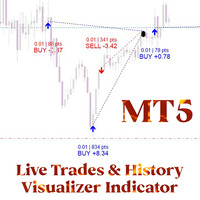
실시간 및 과거 거래 시각화로 트레이딩 경험 향상
실시간 거래 및 과거 거래 시각화는 트레이더가 선명한 시각적 신호로 개설 및 청산 포지션을 추적할 수 있도록 설계된 강력한 메타트레이더 5 보조지표입니다. 실시간 거래를 모니터링하든 과거 수익률을 분석하든 이 도구는 진입/청산가, 수익/손실, 거래 통계를 직관적이고 사용자 지정 가능한 방식으로 차트에 바로 표시해 줍니다.
(프로필 방문 및 다른 모든 MT4/MT5 상품 확인) (리뷰 작성 잊지 마세요)
주요 특징:
실시간 거래 추적
진입과 현재 가격을 연결하는 동적 선으로 활성 거래 시각화
사용자 정의 가능한 색상 및 크기로 명확한 매수/매도 화살표
실시간으로 즉시 수익 / 손실 업데이트
과거 거래 분석
진입 / 종료 마커 및 추세선으로 과거 거래 표시
거래 세부 정보 (수익, 획득 / 손실 포인트, 포지션 크기) 한눈에보기
거래 유형별 필터 (매수 / 매도) 및 표시 내역 제한
모든 차트 배경을위한
FREE
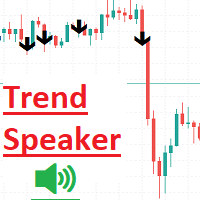
Trend Speaker 지표 는 실시간으로 시장 동향을 쉽게 추적하고 분석하려는 트레이더를 위해 설계된 강력한 도구입니다. 차트에서 명확하고 신뢰할 수 있는 매수 및 매도 신호를 제공하여 시장의 현재 추세를 매우 편리하게 평가할 수 있습니다. 사용자 친화적인 인터페이스를 갖춘 Trend Speaker는 잠재적인 거래 기회를 놓치지 않도록 도와주며, 정보에 기반한 결정을 내리고 거래 전략을 향상시키는 데 도움을 줍니다. 이 지표는 모든 매수 및 매도 신호에 대해 Stop Loss와 Take Profit을 표시합니다. 스크린샷에서: 초록색 점은 TP1에서 TP7까지의 Take Profit을 나타냅니다 빨간색 점은 Stop Loss를 나타냅니다. 사용법: 모든 시간대에서 실행할 수 있습니다. 매수 및 매도 화살표의 색상과 두께를 쉽게 변경할 수 있습니다. 이 지표를 사용하는 것은 매우 간단하고 쉽습니다. 편안하게 앉아 있고 모든 것이 잘 될 것입니다. 속성을 변경하여 TP와 SL을 쉽게
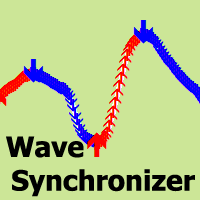
파동 동기화 장치 - 파동 분석의 시각적 표시기. 촛대 움직임 시퀀스를 결합하고 방향성 파동 패턴을 생성하여 시장과 동기화된 움직임을 생성합니다.
각 웨이브의 시작은 신호 화살표로 시작하며, 알림도 있습니다.
이 표시기는 과거 기록에 있는 화살표를 다시 그리거나 이동하지 않습니다.
캔들 마감 시점에 신호 화살표가 나타납니다.
모든 거래 수단 및 시간대에 맞게 조정 가능합니다.
사용 및 구성이 쉽고, 선택한 매개변수와 함께 사용할 시간 프레임 선택 및 MA 라인 계산 방법의 2가지 입력 매개변수만 포함합니다.
권장 매개변수는 1~2주기만큼 변경될 수 있습니다.
거래 자산을 매수하기 위한 빨간색 화살표 방향입니다.
거래 자산을 판매할 때의 파란색 화살표 방향입니다. -----------------------------------------------------------------

Trade Hunter MT5 - Buy and Sell Indicator
Unlock precise trading opportunities with Trade Hunter MT5! This powerful indicator identifies potential buy and sell signals by analyzing price movements over a customizable period. Blue arrows mark buy opportunities below key lows, while red arrows highlight sell signals above critical highs. With adjustable parameters like bar range, percentage offset, and alert settings, Trade Hunter adapts to your strategy. Optional alerts and notifications ensur
FREE
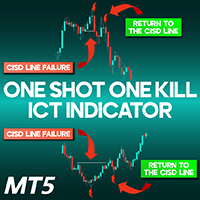
One Shot One Kill Indicator for MetaTrader 5 The One Shot One Kill ICT trading tool is specifically developed for MetaTrader 5 , designed to analyze price movements by assessing the highest and lowest points of previous candles. It identifies liquidity zones while integrating fundamental data, such as CPI and NFP reports , to detect potential reversal areas or confirm ongoing trends. One Shot One Kill Indicator Specifications Category ICT – Smart Money – Liquidity Platform MetaTrader 5 Skill L
FREE
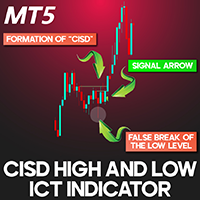
CISD - CSD + High & Low ICT Indicator in MetaTrader 5 The CISD – CSD + High and Low Indicator is a powerful tool that plots key High and Low-price levels while highlighting CISD formations on the chart. Designed based on the ICT trading strategy , this MT5 indicator helps identify false breakouts at major price levels and marks CISD occurrences with arrows to signal trade opportunities. CISD + High/Low Indicator Features Below is a breakdown of the CISD - CSD + High and Low Indicator specifica
FREE
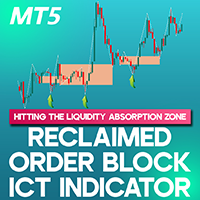
Reclaimed Order Block ICT Indicator MT5 Built upon the ICT trading principles, the Reclaimed Order Block ICT Indicator MT5 for MetaTrader 5 pinpoints essential price areas where an order block is initially breached, leading to a structural shift and the formation of a new trend. As the price revisits these levels post-breakout, the indicator generates strategic buy and sell signals, assisting traders in making data-driven decisions. «Indicator Installation & User Guide» MT5 Indicator Installatio
FREE
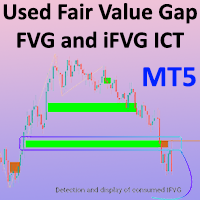
Used Fair Value Gap FVG and iFVG ICT SMC MT5 The Used Fair Value Gap (Used FVG-iFVG) is a sophisticated and efficient tool tailored for ICT and Smart Money traders , specifically for use on MetaTrader 5 (MT5) . This indicator pinpoints and visualizes market imbalance zones ( FVG ), helping traders spot crucial supply and demand areas . It marks bullish FVG zones in green and bearish FVG zones in brown . As the price revisits these regions, the indicator dynamically adjusts by shrinking the recta
FREE
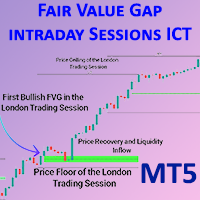
Intraday Fair Value Gap Sessions ICT Indicator for MT5 The Intraday FVG Sessions Indicator is a powerful analytical tool designed to help traders spot Fair Value Gaps (FVGs) within the New York, London, and Tokyo trading sessions. This indicator automatically highlights the high and low levels of each session using horizontal markers while identifying the first Fair Value Gap that appears within these timeframes. By differentiating between bullish and bearish Fair Value Gaps , this tool aids tra
FREE
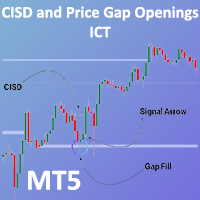
CISD - CSD + Price Gap Openings Indicator for MetaTrader 5 The CISD CSD + Price Gap Openings indicator highlights newly formed daily price gap openings (NDOG) with purple boxes. This advanced Smart Money tool for MetaTrader 5 detects "CISD" levels based on significant price fluctuations and marks them with directional arrows. These "CISD" levels often indicate a potential market reversal or trend continuation. CISD – CSD + Price Gap Openings Indicator Specifications The table below provides ke
FREE
MetaTrader 플랫폼 어플리케이션 스토어에서 MetaTrader 마켓에서 트레이딩 로봇을 구매하는 방법에 대해 알아 보십시오.
MQL5.community 결제 시스템은 페이팔, 은행 카드 및 인기 결제 시스템을 통한 거래를 지원합니다. 더 나은 고객 경험을 위해 구입하시기 전에 거래 로봇을 테스트하시는 것을 권장합니다.
트레이딩 기회를 놓치고 있어요:
- 무료 트레이딩 앱
- 복사용 8,000 이상의 시그널
- 금융 시장 개척을 위한 경제 뉴스
등록
로그인
계정이 없으시면, 가입하십시오
MQL5.com 웹사이트에 로그인을 하기 위해 쿠키를 허용하십시오.
브라우저에서 필요한 설정을 활성화하시지 않으면, 로그인할 수 없습니다.