YouTubeにあるマーケットチュートリアルビデオをご覧ください
ロボットや指標を購入する
仮想ホスティングで
EAを実行
EAを実行
ロボットや指標を購入前にテストする
マーケットで収入を得る
販売のためにプロダクトをプレゼンテーションする方法
MetaTrader 5のためのエキスパートアドバイザーとインディケータ - 38

Get it FREE while you can! Will be increased to $100 very shortly after a few downloads!!
Join my Discord and Telegram Channel - Max's Strategy For any assistance and help please send me a message here. https://t.me/Maxs_Strategy https://discord.gg/yysxRUJT  ;
The Max Hercules Strategy is a part of a cross asset market making strategy (Max Cronus) built by myself over years of analysis and strategy building. It takes multiple theories and calculations to trade the market in order to cov
FREE

Stochastic Color Alerts
Stochastic Color は、動的な色の変化と統合されたアラートシステムを備えたカスタム・ストキャスティクス・オシレーターで、モメンタムの方向とクロスオーバーシグナルを識別します。 メインライン (%K) は自動的に色が変わります:
緑:上昇モメンタム
赤:下降モメンタム
オレンジ:現在形成中のローソク足 このインジケーターは、クラシックな %K、%D、Slowing パラメータに基づき、期間は設定可能で、標準レベルは 20 と 80 です。 含まれるアラートタイプ:
買われすぎ・売られすぎゾーンでの %K と %D のクロスによる Buy/Sell アラート
任意のレベルでのクロスオーバーアラート
色の変化アラート(モメンタムの変化) すべてのアラートはローソク足確定後に生成され(リペイントなし)、1本のローソク足につき1回のみ通知され、モバイルプッシュ通知も利用可能です。
すべての銘柄と時間足で、スキャルピング、デイトレード、スイングトレードに適しています。
FREE
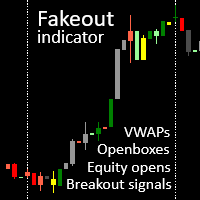
akeout candle indicator with session VWAPs, openboxes and openbox breakout signals. Check out our other products for fxer.net:
https://www.mql5.com/en/market/product/114888
https://www.mql5.com/en/market/product/114890 Main features 1. VWAPS for Tokyo, London and NY sessions 2. Openboxes for Tokyo, London and NY sessions 3. Colored candles for breakouts, fakeouts and inside candles 4. Equity open line 5. Openbox expansions 6. Unmitigated equity open prices for Tokyo, London and NY sessions 7
FREE

Magic Histogram MT5インジケーターは、スキャルピングや中期取引に適したユニバーサルツールです。 この指標は革新的な公式を使用しており、トレンドの方向性と強さを判断することができます。 Magic Histogram MT5は再描画されないため、履歴データを使用してその効率を評価できます。 M15、M30、H1、H4に最適です。
インジケーターの利点 優れたインジケーター信号! 初心者や経験豊富なトレーダーに適しています。 柔軟なインジケーター設定を使用して、インジケーターを取引スタイルに合わせて調整できます。 すべての時間枠で動作します。 あらゆる金融商品で動作します。 再描画/再描画しません。 電子メールおよびモバイルデバイスへの信号の送信。
推奨される使用法
買いシグナル:インジケーター値が負から正に変化しました。 売りシグナル:インジケーター値が正から負に変化しました。 Magic Histogramは、位置入力信号を直接提供します。したがって、適切なストップロスを計算して利益値を取得するだけで済みます。 推奨される記号: AUDUSD、EURUSD、USD

H1 Momentum Guardian: Professional Algo-Trading System H1 Momentum Guardian is a high-precision automated trading system engineered specifically for the H1 timeframe . It utilizes a sophisticated "Dual-Confirmation" logic to exploit medium-term market trends while filtering out the low-volatility noise common in smaller timeframes. Institutional-Grade Data & Validation Confidence in an EA comes from the quality of its testing. This system has been developed and stress-tested using the most rigor
FREE
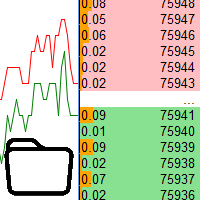
Using data from the order book in the strategy tester Key features: Simultaneous use of several symbols, up to 7 pieces DOM visualization With the visualization of order books, real-time simulation is available, as well as acceleration or deceleration Working with the library: This product also requires a utility to save data: https://www.mql5.com/en/market/product/71642 Speed control utility: https://www.mql5.com/en/market/product/81409 Include file: https://c.mql5.com/31/735/Market_book_s
FREE

RSI ABCDパターンファインダー:テクニカル戦略 1. インジケーターの仕組み 古典的RSI と ABCD調和パターン の自動検出を組み合わせたものです。 主要コンポーネント 標準RSI (調整可能な期間) 高値・安値マーカー (矢印) ABCDパターン (緑/赤の線) 過買(70)・過売(30)フィルター 2. MT5設定 period = 14 ; // RSI期間 size = 4 ; // 最大パターンサイズ OverBought = 70 ; // 過買水準 OverSold = 30 ; // 過売水準 Filter = USE_FILTER_ YES ; // 確認フィルター 3. 取引戦略 3.1. 買いエントリー(強気ABCD) 条件: RSIが以下を形成: 谷( A )→ 山( B )→ より高い谷( C ) D が過売域(30)より上だが C より下 確認:A-B-C-Dを結ぶ緑色の線 目標: TP1: B-Cの61.8% TP2: B-Cの100% ストップロス: D より下 3.2. 売りエントリー(弱気ABCD) 条件: RSIが以下を形成: 山( A
FREE

Simple ATR (Average True Range) Channel to find your Stop Loss and/or Take Profit. Indicator allows to draw a second multiplier if you need different values for SL and TP. Leave the second multiplier to 0 if not used.
Settings + Length
+ Smoothing
+ Multiplier #1 (default 1.5)
+ Multiplier #2 (set to 0 if not used)
+ High price
+ Low price
+ show price line
+ colors can be changed
Please leave wishes in the comments. Reviews are also welcome.
FREE

前日の終値とバーのシフト - MetaTrader用のツール! 前日の終値とバーのシフトインジケーターは、テクニカル分析とトレードの意思決定を向上させるために設計されたツールです。このインジケーターを使用すると、任意のバーのオープン、ハイ、ロー、クローズの詳細な情報にアクセスでき、市場の動きを正確かつ包括的に分析することができます。 自分のチャート上でタイムフレームを重ねることができると想像してみてください。これにより、現在のタイムフレーム内でさまざまな時間枠の各バーを詳細に分析することができます。前日の終値とバーのシフトインジケーターを使用すると、この素晴らしい機能が手の届くところにあります。 前日の終値がサポートとレジスタンスとしての重要性は、トレーダーのコミュニティで広く認識されています。このツールを使うことで、前回の終値で価格が停止したレベルを明確かつ正確に確認できるため、購入と売却の意思決定に貴重な洞察を提供します。 インジケーターをチャートに適用すると、前日のオープン、ハイ、ロー、クローズの重要な情報にすぐにアクセスできます。これらの情報は視覚的に魅力的に強調表示されます。
FREE
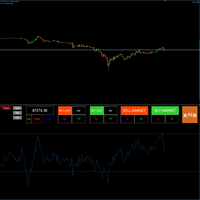
Hello friends, I want it to be large so mouse clicks are faster and more accurate. Scalpers like this. Please click the resize button to fit your screen (it looks better on a 4K monitor)
I would like to introduce a very convenient trading tool designed to meet the needs of fast and high-frequency trading. Its main advantages are convenience and accuracy, with virtually no delay. In particular, it allows traders to easily update and manage Stop Loss and Take Profit levels, and quickly calculate
FREE

The Range Filter Buy and Sell indicator is a trend-following technical analysis tool designed to identify optimal entry and exit points in the market. It filters out market noise by creating dynamic bands around price movements, generating clear buy and sell signals when price breaks through these bands. Key Features Dynamic Range Filtering : Uses a sophisticated algorithm to calculate adaptive bands that adjust to market volatility Trend Identification : Clearly visualizes the current trend dir
FREE

The Pending Order Grid is a multi-symbol multi-timeframe script that enables multi-strategy implementation based on pending order grids. General Description
The Pending Order Grid allows the performing of a user-defined strategy through the creation of pending order grids. The script places pending orders of a given type (Buy Limit, Sell Limit, Buy Stop, or Sell Stop) at equidistant price levels to form each grid. The beginning and finish of every grid are defined by the Start Price and Sto
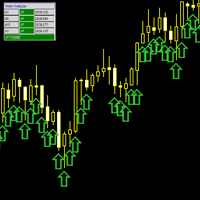
The MultiFrameTrendAnalyzer is a versatile MetaTrader 5 (MT5) indicator designed to provide multi-timeframe trend analysis using Moving Average (MA) crossovers. This indicator synchronizes trend signals across multiple timeframes (M1, M5, M15, M30, H1, H4, D1, W1, MN1) and displays them with intuitive visual cues, including a colored trend line, signal arrows, and a customizable dashboard. Features Multi-Timeframe Analysis : Evaluates trends across up to nine timeframes, allowing traders to conf
FREE

SMC Confluence Engine – Institutional Market Structure Intelligence for MT5 SMC Confluence Engine is a professional-grade Smart Money Concepts (SMC) indicator designed to identify real-time market structure shifts, Break of Structure (BOS), and deep liquidity penetrations with precision. Built for serious traders, this tool delivers clean, rule-based structure analysis combined with confluence filtering to help eliminate noise and highlight only meaningful institutional moves. This is not a repa
FREE
Indicator Automator EA: The Ultimate Indicator Automation Tool Tired of being chained to your desk, waiting for signals from your favorite indicator? Do you want to eliminate emotional trading and unlock the true potential of your manual strategy? Indicator Automator EA is a powerful and highly versatile Expert Advisor for MetaTrader 5 designed to automate ANY trading indicator that provides clear Buy and Sell signals through its indicator buffers. You don't need to be a programmer. If you have

Hello, Every one
A script to close all market positions and/or pending orders.
-----------------------------------------------------------------------------------
This is Close All market positions and/or pending orders button
You can close all orders in 1 second by one click
For advanced version: Advanced: https://www.mql5.com/en/market/product/77763
https://www.mql5.com/en/market/product/89311 Key:
1 Close all button: The script will close All orders market + pending
FREE

King_Expert EA - Professional Trading System Overview King_Expert EA is a sophisticated automated trading system for MetaTrader 5 that combines trend-following strategies with intelligent risk management. The EA uses a multi-layered approach to identify high-probability trading opportunities while incorporating advanced features like grid averaging and dynamic position management. Core Trading Strategy Primary Signal Generation EMA Crossover System : Uses dual Exponential Moving Averages (21/50
FREE

>>>>> The Ultimate Safety Net for Your Trading Account <<<<< Simple Risk Manager is a professional utility EA that automatically protects and enhances your trading with sophisticated risk management - without interfering with your trading strategy. Key Features: Automatic Stop Loss & Take Profit Management - Instantly applies your predefined SL/TP to every new position, even those opened manually or by other EAs. Intelligent Trailing Stop System - Secures your profits with a customizable tr

Trendline Targets Dashboard MT5 Trendline Targets Dashboard MT5 は、MetaTrader 5 用のインジケーターで、完全なビジュアル・トレードプランを表示します。 シグナル 、 エントリー価格(Entry) 、 ストップロス(Stop Loss) 、および 利確目標(Take Profits) を、リスク比率 R に基づいて自動的に計算します。 このツールは注文を出すものではありません。トレードの分析と視覚的管理を目的としたツールであり、自動売買ロボット(EA)ではありません。 リリース記念特典: 購入者全員に、私の MQL5 プロフィールにあるお好きな インジケーターを1つ無料でプレゼント します。 ※ 注意: Market Structure Order Block Dashboard MT5 は特典対象外です。 特典を受け取るには、購入後に MQL5 メッセージ機能でご希望の製品名をお送りください。 主な機能 ネオンエフェクト付きトレンドライン(強気/弱気) ローソク足確定時のトレンド反転による BUY/SELL

Time your Entry and Exits with Average True Range (ATR) Trailing Stops ATR Trailing Stops are primarily used to protect capital and lock in profits on individual trades but they can also be used, in conjunction with a trend filter, to signal entries. The indicator will help make your calculation of stop loss easier as it will be visually aiding you in choosing where to put your stoploss level on the chart by calculating the current value of ATR indicator. For those who are unfamiliar with ATR, i
FREE

If you have the opportunity to read the book " Trend Trading - A Seven-Step Approach to success " by Daryl Guppy, you will have a great deal of information about how to "read" the market. In his book Daryl show, among other things, how can we use a visual tool to measure the volatility and trend between Long and Short-term periods: The GMMA - Guppy Multiple Moving Averages .
Instead of using his original idea of having 12 Exponential Moving Averages in your chart - which could be very CPU-deman
FREE

バックテスト セットアップ: ファイルとガイダンスを受け取るために私に連絡してください。 現在販売されているのは1 のコピーのみです。価格は各10コピーの後に上昇します。お見逃しなく。次の価格: 136 トライアル版はリクエストに応じて利用可能です(私に連絡してください)。
Myniqは、不要なパラメータで圧倒されることなく、一貫した実行を提供するように設計されています。明確さを念頭に置いて構築されており、複雑なシステムに見られる混乱を取り除きます。
購入後にボーナスEAを受け取るために私に連絡してください
主要保護機能: 最大ドローダウン制限: ドローダウンのしきい値を定義でき、それに達するとすべてのトレードがクローズされ、EAが一時停止します。 ニュースフィルター: リスクの高いトレードを避けるための詳細なオプションのニュースフィルター。
実行のシンプルさ: 複雑なオーバーレイや多数の条件はありません。ただXAUUSDにM15のタイムフレームでEAを取り付けるだけで、残りは自動で行います。すべてのポジションを内部で管理するには、1つのチャートが必要です。
取引方法: モメ

Fimathe Indicator The Fimathe Indicator is a tool for MetaTrader 5 designed to help traders identify support, resistance, neutral zones, and price channels. It features an interactive interface for drawing and managing support and resistance levels, generating take-profit channels and neutral zones, and providing visual and sound alerts for breakouts. Key Features Support and Resistance Lines: Dynamic and draggable lines to identify key levels. Reference Channel: Creates a channel between su
FREE

We present to you ShtencoNeuralLink - a revolutionary trading advisor with a unique idea that has been under development since 2022. ShtencoNeuralLink is based on a neural network, fully written in the MQL5 language. Its idea is absolutely new and has no analogues on the market, operating in completely different price and time coordinate systems, going beyond the classical Japanese candlesticks or bars. The heart of the advisor is a trainable neural network, whose weights are automatically selec
FREE

VWAP Fibo Bands RSJ is an indicator that traces the lines of the daily VWAP and from it creates bands using Fibonacci proportions. This spectacular indicator creates 10 band levels through the selected VWAP period using Fibonacci ratios.
It is fantastic how the prices respect each level of the bands, where it is possible to realize that almost every time the price closes above / below a level of the bands he will seek the next one. If close above will seek to reach the level above and if close
FREE

Show Pip Value and Spread on Chart as Object or Comment. User can select to display Pip Value and/or Spread by object on main Chart, or show both only as Comment lines on chart. Object Color, Font face and Size and also which corner to show, may change by user. Pip Value calculated in accordance of input Lot size , Default is 1 lot . Can use at all currency pairs , Gold , Silver and most other charts.
FREE

驚くべきClear Horizon
ブレイクアウトボックス戦略: 価格の統合とブレイクアウトを活用するインテリジェントな取引システムです。最近の価格範囲に基づいて動的サポートおよびレジスタンスボックスを描き、マーケットがタイトなゾーンからブレイクアウトする際に取引を行います。このロジックは、手動トレーダーによって見逃されることが多い高モメンタムの動きをターゲットにしています。
特別ローンチ価格 期間限定で、Clear Horizonは 99 で入手可能です。標準価格は間もなく $150 USD に調整されます。この高性能エキスパートアドバイザーをその価値の一部で手に入れるチャンスをお見逃しなく。
なぜClear Horizonを選ぶのか? 隠れたクラシックMACDダイバージェンスを自動的に検出 プロプファームチャレンジと個人取引口座の両方に最適 最小限の設定で組み込みの資本保護ルールを使用 ほとんどのブローカーおよび口座タイプと互換性あり
クイックスタートガイド ユーザーガイド: https://www.mql5.com/en/blogs/post/762793
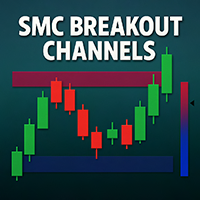
SMC Breakout Channels Anticipate market breakouts with precision.
SMC Breakout Channels automatically detect accumulation and distribution ranges where professional traders (“smart money”) are most active. By combining volatility-based range detection with real-time volume analysis, this tool highlights the key breakout zones that often precede strong directional moves. Advantages Clarity: No clutter, just clean breakout boxes with clear bullish/bearish bias. Early Signals: Detect hidden ac
FREE
This EA is a flexible and powerful metatrader expert advisor that trades using the MACD indicator and implements many useful features. It can trade using the MACD indicator alone, or donchian breakouts confirmed by the MACD indicator from any timeframe. Additionally, it offers a martingale feature and forex session filters. [ Installation Guide | Update Guide | Troubleshooting | FAQ | All Products ] Easy to use and supervise Fully configurable settings Customizable break-even, SL, TP and traili
FREE

Bohemia Gold MT5 is Trend & Volatility EA trading system designed specifically for Gold (XAUUSD) . It combines higher-timeframe trend filtering , trend detection , volatility-based SL management , and advanced trade management to adapt market conditions. It uses style logic focused on trend strength, volatility, and capital protection. NOTE: Based on backtests, I found better trading results with the following setup: D1/H4/H2 (Trend/ADX/ATR & trade). The SET file can be downloaded here … bohe
FREE
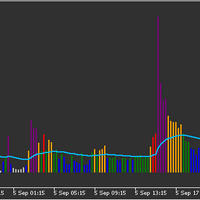
Volume indicator judging level of volume per bar accordingly to Volume Spread Analysis rules. It allows either to set static volume levels or dynamic ones based on ratio comparable to Moving Average. Bars are coloured based on ratio or static levels, visually presenting level of Volume (low, average, high, ultra high). Release Notes - Fixed and optimised calculations of Session Average Volume
- added predefined settings for time to calculate Session Average for EU and US markets
FREE

This indicator visually highlights the Asian, London, and New York trading sessions on your chart using colored rectangles. It automatically calculates and displays the high, low, and price range (in pips) of each session for the most recent day. The session ranges are drawn for a configurable lookback period, allowing you to review session price action over multiple previous days. Key features include: Customizable session start and end times for Asian, London, and New York sessions. Colored se
FREE

Pro tren entri premium
Logika TZ Trade, menehi sampeyan, versi apik saka entri tren Premium
Rilis iki, bakal nggawa sampeyan kahanan dagang sing luwih santai kanthi fitur canggih kanggo nyaring tren lan wektu mlebu sinyal premium.
Kanggo kita, dudu nggawe produk sing penting! nanging pangopènan lan pendhidhikan terus kanggo pangguna. liwat sarana khusus kanggo nggayuh kita, sampeyan bakal nemokake pandhuan cedhak babagan cara nggunakake produk lan latihan liyane sing gegandhengan karo dagang
FREE

EURO Binder EA is a fully automatic trading advisor which contains several trading systems mainly based on Stochastic, Moving Averages, Standard Deviation, Momentum, Envelopes, Bollinger Bands, Awesome Oscillator, Accelerator Oscillator, CCI, ATR, ADX, OSMA, MACD, RSI, WPR, Bulls Power, Bears Power, Support Resistance, and Candlestick Formations. Each trading system has it own entry with fixed stop loss and take profit. This forex robot can be used for all pairs and all time frames, but
Reversal Pattern AI — an absolute breakthrough in the world of indicator development, combining artificial intelligence algorithms, multi-level market analysis, and classical methods of technical analysis. It not only detects reversal patterns but also evaluates market inefficiencies, generating highly accurate trading signals. Thanks to a hybrid model that uses price action analysis, Volumes, Volatility, VWAP, and Volume AVG %, the indicator easily adapts to any market conditions.
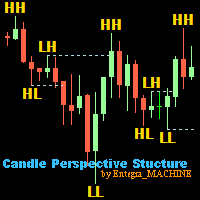
Candle Perspective Structure Indicator MT5 is a simple indicator that defines and displays the candlestick structure of the market. This indicator will suit both experienced traders and beginners who find it difficult to follow the structure visually.
If you want to see more high-quality products or order the development/conversion of your own products, visit my partners' website: 4xDev
Get 10% OFF on manual strategies automation services or indicator development/conversion services at 4xDev
FREE

VR ティックは、 スキャルピングベースの戦略のための特別なインジケーターです。このインジケーターのおかげで、トレーダーは金融商品のメインチャート上でティックチャートを直接見ることができます。ティック チャートを使用すると、できるだけ正確に市場にポジションを入力したり、市場でポジションを決済したりできます。 VR Ticks は、方向に応じて色が変わる線の形で目盛りデータをプロットします。これにより、目盛りの状況を視覚的に理解し、評価することができます。ティック チャートの利点は、時間枠を考慮せず、価格の変化に基づいて構築されることです。 VR Ticks は可能な限り最小限のチャートを作成します。 設定、設定ファイル、デモ版、説明書、問題解決方法は [ブログ] でご覧いただけます
[リンク] でレビューを読んだり書いたりできます。
[MetaTrader 4] のバージョン ティックは 1 つの値動きです。 1 つの価格変動に対して、価格は 1 ポイントまたは数ポイント変化する可能性があります。 ティックは動きである ことを理解することが重要です。 このインジケーターには、右下にアス
FREE

DAX Falcon is a pending-order system built for the early movement of the DAX. The EA reads the initial structure of the session and places buy and sell stops at predefined levels. No grid, no martingale, no averaging. Each position has fixed and independent risk. The logic focuses on the morning range and the reversals at the end of the European session.
Core Characteristics: Pending orders only Defined stop loss and take profit
CFD vs Futures Pricing Warning: This model depends on accurate p
FREE

This utility is used to visually choose an indicator for trailing stop and select its parameters. The Expert Advisor modifies the Stop Loss order position opened for the instrument of the current chart based on indicator values. Uses indicators Parabolic SAR , NRTR (Nick Rypock Trailing Reverse) , Moving Average or linear regression channel. The indicators are added to or removed from the chart using the 'show' checkbox.
The following options are available: Parabolic - trailing stop based on th

取引の世界での究極のスキャルピング仲間である Scalpie をご紹介します。相対強度指数 (RSI) の力を活用するように設計された Scalpie は、単なる専門アドバイザーではありません。正確かつ自信を持って市場をナビゲートするための戦略的な味方です。
ヘッジ口座向けに調整された Scalpie には、潜在的な利益を最大化しながら投資を保護するための高度なストップロスとテイクプロフィットのメカニズムが組み込まれています。主要な外国為替ペア、マイナー通貨、暗号通貨、または市場のその他のシンボルを取引する場合でも、Scalpie は多様な取引環境にシームレスに適応します。
多用途性が Scalpie のデザインの中核です。 Scalpie は、短期的なバーストから長期的なトレンドまで、さまざまな時間枠にわたって運用できる機能を備えており、いつでも市場の動きを利用することができます。さらに、ユーザーフレンドリーなインターフェイスにより簡単にカスタマイズでき、設定のわずかな調整でも最適な結果が得られます。
お客様の最小限の労力で安定したパフォーマンスを一貫して提供する Scalp
FREE
If you love this indicator, please leave a positive rating and comment, it will be a source of motivation to help me create more products <3 How to use Gann High-Low Activator? The Gann HiLo Activator helps the trader identify the current trend of the market. When the indicator is below the closing price, it can indicate that an uptrend is taking place. Conversely, when the indicator is above the closing price, it can indicate a downtrend. The Gann HiLo Activator also generates buy and sell sig
FREE

スキャルピングスキルは、静かな時間のための安全なスキャルピングエキスパートアドバイザーです。経験豊富なトレーダーと初心者の両方に適しています。 FIFO要件のあるアメリカのブローカーを含むすべてのブローカーと連携します-まず第一に、以前に開かれた取引を成立させます。 EAはマーチンゲールや注文グリッドを使用しません。すべての注文には、実質的なストップロスが伴い、1ポイントからピップで利益を得るだけでなく、損益分岐点とトレーリングストップ機能も伴います。チャートには、注文の実行速度とスリッページに関する情報が表示されます。計算の時間枠はEA設定で設定されます。
MT4バージョン:https:// www.mql5.com/en/market/product/36925
推奨事項 リアルマネーで使用する前に、セント取引口座で最小限のリスクでアドバイザーをテストします。 最低保証金-0.01ロットで300ドル。
アドバイザーはあなたの預金を保護します: EAは、連続した不採算注文の数が指定された値を超えると、不採算取引を停止します。 ブローカーがプラグインを使用し、意図的
The Higher timeframe candle tracker is used to get a glimpse of what the selected higher time frame candle is like. It plot the candle after the current price. It can come in handy for day traders and short term traders that often worry about how the current higher timeframe candle may look like. You can select the higher time frame or lower time frame from the options provided: By default the color for bears is red and for bulls is green. You are able to change the width of the candle, its wick
FREE

This is just a MACD with multi symbols, multi timeframes, and multi colors. features. different symbols and timeframes from the main chart. draw main line, signal line, and histogram. each line can be erased. the ascent and descent can be distinguished. Due to the above features, this MACD is suitable for multiple lineups in a single chart. This can be used in the same way as MiniCandles.
FREE

Pare de lutar contra o terminal. Comece a operar com precisão cirúrgica. O Profit Station Pro não é apenas um painel; é uma reformulação completa da experiência de trading no MetaTrader 5. Desenvolvido para traders que exigem agilidade, este utilitário transforma o gráfico em um Cockpit Operacional , eliminando a necessidade de boletas complexas e cálculos manuais lentos. Seja você um Scalper ou Day Trader, o Profit Station oferece as ferramentas que faltavam para sua consistência. Funcion
FREE

HiLo Activator is a technical analysis indicator developed by Robert Krausz, a renowned hungarian trader with a career in the USA.
It is a trend indicator that helps you to predict the cange of the current trend. In an uptrend it is displayed at the bottom of the candles; in a downtrend it is displayed at the top.
Its only setting is the calculation period.
It is possible to have alerts when a new trend begin. Enjoy! This is a free indicator, but it took hours to develop. If you want to pay me a
FREE

Trading Session Indicator The Trading Session Indicator visualizes the high and low points as well as the start and end times of the Asian, London, and New York trading sessions directly on your chart. Features: Visualization of major trading sessions Highlighting of high and low points Display of start and end times for each session Customizable session times User-friendly and efficient Customizability: Each trading session (Asian, London, New York) can be individually customized to match speci
FREE

Lot by Risk tradingパネルは、手動取引用に設計されています。 これは、注文を送信するための代替手段です。
パネルの最初の特徴は、管理線を使用した注文の便利な配置です。 第二の特徴は、ストップロスラインの存在下で与えられたリスクのための取引量の計算です。
制御線はホットキーを使用して設定されます:
利益を取る-デフォルトではTキー;
価格-デフォルトではPキー;
ストップロス-デフォルトでは、Sキー;
取引パネルの設定で自分でキーを設定できます。
操作のアルゴリズム:
1)-レベルを希望の場所に配置します(すべてのレベルを配置する必要はありません);
2)-リスクを指定します(オプション);
3)-緑の送信注文ボタンをクリックします;
4)-注文が行われるのを待っているか、エラーメッセージ付きのアラートが表示されます;
5)-マジックでExpert Advisorにリンクされている現在のシンボルのすべての注文を閉じる場合は、注文を閉じるボタンをクリックします。
注文を送信ボタンを何度も押すべきではありません。 一度で十分です。 注文後、ボタンは「
FREE

ขอบคุณ แรงบันดาลใจ จากโค้ชแพม ที่ทำให้เริ่มทำ Close all ตัวนี้ และขอขอบคุณทุกคนที่ให้ความรู็มาโดยตลอด ไม่ว่าจะทางตรงทางอ้อม ขอบคุณทุกคนที่ให้ความรู้เพื่อนร่วมเทรด ทั้งนี้เพื่อให้นักเทรดทุกคนได้มีเครื่องมือในการควบคุมการปิดการซื้อขาย จึงขอพัฒนาโปรแกรม close all version 5 ได้ใช้ทุกคน Close all and update profit Version 1.00 (MT5) Full version Give you free
For MT4 Click https://www.mql5.com/en/market/product/79252
Fix TPSL calculate
Program function
Tab 1 Close order function and show br
FREE
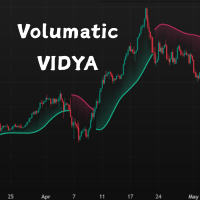
This is a custom VIDYA-based trend-following indicator for MetaTrader 5 (MT5), enhanced with ATR-band logic to adapt to market volatility. It provides dynamic trend zones and intelligent direction switching to support better trading decisions.
Unlike traditional moving averages, this indicator uses a momentum-adjusted VIDYA (Variable Index Dynamic Average) and combines it with ATR-based bands to detect trend shifts with greater precision. Features
Volatility-Adaptive Trend Logic – Uses ATR ban
FREE
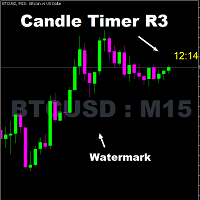
Timer remaining to finish the candle. A simple informative indicator of how much time is left until the current candle ends. In a simple, easy and objective way. In the input parameters, enter the desired color of the clock, the font size and the displacement to the right of the candle. I hope I helped with this useful and free tool. Make good use and good business. The other EA, Smart Trade R3, has also been a great help to many users. https://www.mql5.com/pt/market/product/164163?source=Site
FREE
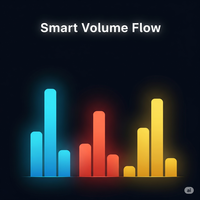
Smart Volume Flow (スマート・ボリューム・フロー) Smart Volume Flow は、注文フローの解釈を次のレベルへと引き上げるプロフェッショナルな出来高分析ツールです。単にバーの数を数えるだけでなく、 ハイブリッド出来高 、 トレンドの背景 、 マルチタイムフレーム・フィルター 、そして 方向性のある強さ(ADXと+DI/-DI)による検証 を組み合わせています。 その目的は、市場の活動を 分解し、重み付けし、文脈化 することで、生のデータをより高い精度で意思決定を行うための戦術的な情報に変えることです。 他のツールとの違い MetaTrader 5の標準の出来高インジケーターは、各バーの総出来高のみを表示しますが、Smart Volume Flowは 出来高がどのように、どこで発生したか を分析します。これにより、買占め、売却、クライマックス、吸収といった機関投資家のパターンを特定し、トレンドの方向と強さでそれらを裏付けます。 主な特徴 加重ハイブリッド出来高 実際の出来高とティック出来高を組み合わせ、以下の要素に基づいた補正係数を適用します。 バーのレンジ

HMA Color – Master Smoothed A clean, high-precision visual Hull Moving Average indicator with fully smoothed trend color display. Designed for professional scalpers and algorithmic traders who want a simple, fast, powerful trend view without noise. This indicator is built with a " true double smoothing system" , making the Hull curve extremely soft and responsive.
When the trend is bullish, the HMA line automatically switches to Green and shows upward candles.
When the trend is bearish, the HM
FREE

Grebenka - помощник для разметки графика.
Функционал: 1. позволяет непрерывно рисовать линии ZigZag в ручном режиме, используя клики мышкой. 2. позволяет включать режим, при котором любая трендовая линия с которой в данный момент проводится манипуляция, выравнивается по горизонтали.
Горячие клавиши: [Z] - включение/выключение режима рисования линий ZigZag вручную [X] - включение/выключение режима горизонтальной трендовой линии [C] - быстрая смена цвета линий ZigZag [Del] - стандартная клавиш
FREE

SMC Order Block Zones (MT5) is a Smart Money Concept (SMC) analytical indicator specially designed and optimized for Gold (XAUUSD) .
It automatically detects Order Blocks and displays them as Supply & Demand zones , helping traders identify potential institutional price levels on Gold. The indicator uses volatility-adaptive logic , making it highly suitable for the fast and aggressive movements of XAUUSD. Key Features (XAUUSD Optimized) Specially designed for Gold (XAUUSD) Automatic Order Block
FREE

The Supertrend indicator is a trend-following technical analysis tool designed to help traders identify the direction of market trends and potential entry/exit points. It operates based on price data and Average True Range (ATR) to create a dynamic signal line that changes color depending on the current trend. Green color: Indicates an uptrend. Red color: Indicates a downtrend. Supertrend is a useful indicator for both short-term and long-term trading, helping to filter out market noise and focu
FREE

Automatically sends real-time notifications about trade opening, closing, and partial closing from MT5 to Telegram. The utility supports 16 languages : English, French, German, Indian (Hindi), Indonesian, Italian, Kazakh, Korean, Dutch, Polish, Portuguese, Russian, Spanish, Turkish, Ukrainian, and Vietnamese. The product is designed for traders who need to receive Telegram notifications without constantly monitoring the terminal. It is suitable for Expert Advisor users who want to track their a
FREE
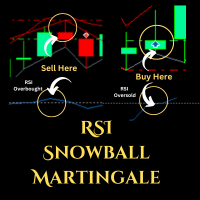
Expert Advisor (EA) that utilizes the basic Dow Theory strategy along with RSI for opening positions, and employs support and resistance levels from the Zigzag indicator as stop-loss and take-profit points, you can follow these guidelines: Dow Theory Strategy : This involves analyzing trends using the Dow Theory principles, mainly focusing on identifying primary trends (bullish or bearish) and secondary trends (corrections). You'll need to implement rules for identifying these trends based on pr
FREE
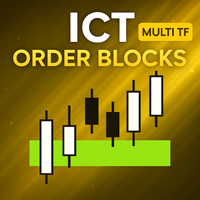
[ MT4 Version ] [ Kill Zones ] [ SMT Divergences ] How to trade using Order Blocks: Click here User Interface Performance: During testing in the strategy tester, the UI may experience lag. Rest assured, this issue is specific to the testing environment and does not affect the indicator's performance in live trading. Elevate your trading strategy with the Order Blocks ICT Multi TF indicator, a cutting-edge tool designed to enhance your trading decisions through advanced order block analysis
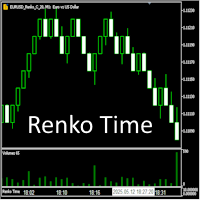
Индикатор предназначен для работы с ренко-графиками, построенными Renko Maker PRO или Renko Maker DEMO . Особенность реализации ренко-баров в терминале MetaTrader 5 такова, что из-за их вневременной природы (формирование новых баров зависит исключительно от изменения цены, а не от временных интервалов), время открытия каждого ренко-бара в истории оказывается искусственно сдвинутым в прошлое. Поэтому, чтобы видеть время открытия ренко баров, нужно воспользоваться этим индикатором Renko Time.
FREE

プロモーションを開始: 199 ドルで2部のみ入手可能 最終価格: 999$ NEW: 今すぐ購入して EA を 1 つ無料で手に入れましょう! (2取引口座の場合) ライブ結果: https://www.mql5.com/en/signals/1836525 high risk account
外国為替取引ロボットの最新製品である Apex Trader を紹介します。 エキスパートアドバイザーの作成における長年の経験を使用して開発された Apex Trader は、外国為替市場向けの強力な取引ツールです。 開発者として、私はこのロボットの研究と作成に多くの時間とリソースを費やしてきました。 Apex Trader があらゆる市場状況に適応できるようにするために、平均回帰やトレンドフォローなど、さまざまな戦略を使用してきました。 その結果、最も困難な市場条件にも対応できるロボットが誕生しました。
Apex Trader は、AUDCAD、AUDNZD、および NZDCAD の通貨ペアの取引を専門としており、テイクプロフィット レベルが可変のスマート グリッド シ

MetaTrader 5用Crypto Ticks – 暗号通貨のリアルタイムティックデータと板情報の統合 概要
Crypto Ticksは、主要な仮想通貨取引所からのリアルタイムティックデータとオーダーブック(板情報)をMetaTrader 5に直接ストリーミングします。スキャルピング、アルゴリズム戦略、ストラテジーテストを必要とするトレーダー向けに設計されています。 対応取引所 Binance:現物 と先物 KuCoin:現物と先物(チャート板サポート) Bybit:先物およびインバース先物 XT.com:現物と先物 主な機能 WebSocketによるリアルタイムティックデータ Binanceのデータストリーム対応:@ticker, @bookTicker 取引所APIを使用したOHLCV履歴の完全更新 オーダーブックの可視化(最良の買値/売値と深さ) 自動再接続で安定性を確保 キャンドル精度向上のためのデータ置換 MT5再起動時に履歴を自動更新 ティックベースのデータを使ったStrategy Testerに対応 外部DLL不要でVPS対応 補足情報
高精度データを必要とするス

Another request from my brotherhood was putting the name of the Symbol being seen - a little bigger - on the Chart, just to get sure that they are seeing the correct one... Mistakes pay a high price on the market... It is a very effective, and almost resource-null-consuming indicator that displays the current Symbol Name and Timeframe in almost any position of your Chart, with any color, and any Font Size... And also you can change the divisor character that is presented between the Symbol Name
FREE

FREE Bookmap Volume Heatmap Indicator Overview The Bookmap Volume Heatmap is a custom MetaTrader 5 (MQL5) indicator that creates a visual heatmap of trading volume distribution across price levels, similar to professional trading platforms like Bookmap. It provides traders with a clear visualization of where significant trading activity has occurred within a specified price range. Key Features 1. Volume Distribution Visualization Creates color-coded rectangles on the chart representing vol
FREE

This indicator forms a channel based on the readings of the ADX (Average Directional Movement Index) indicator, displays and informs the trader of a price reversal at the boundaries of this channel, and can also report when the price touches the channel boundaries. It also draws additional dotted lines, which depend on the readings of the + DI and -DI of the ADX indicator. It also has an option for filtering signals depending on the readings of the stochastic. The channel drawn by this indicato
FREE

ジャッカルエキスパートアドバイザー – トレーディング戦略 4ヶ月間の実稼働 購入後、全製品が永久無料で利用可能
設定ファイルをダウン ロード
金1分足 | ECN口座:全ブローカー対応
ジャッカルEAは、多層かつインテリジェントなブレイクアウト戦略に基づいており、高度なリスク管理と利益管理を組み合わせて市場のダイナミクスに適応します。 1. ブレイクアウトトラップ戦略 市場条件が確認されると、EAは同時に反対方向に2つのペンディング注文を出します: Buy Stop :現在の価格の上に Sell Stop :現在の価格の下に 強い方向性の動きが発生した際に、予測せず即座に市場に参入します。 2. スマートトレード管理 初期ストップロス(SL): リスクを制限するために固定のストップロスを設定します。 トレーリングストップ: 利益が出た際にストップロスが価格に追従し、利益を確保します。 リスクフリーモード: 取引が定義された利益閾値に達すると、ストップロスをエントリーポイントの少し上に移動し、最悪の場合でも純利益で終了します。 3. リカバリー&利益保護システム スマートクロ

スタイルが重要だから
キャンドルの色や背景の明暗を変えたり、グリッドを付けたり消したりするために、いちいちプロパティをクリックするのが面倒なのはよくわかります。ここでは、1つのクリックで解決策です。 トレーダーが望むキャンドルのスタイルを選択するための3つのカスタマイズ可能なボタン。 昼と夜のモードを切り替えるには、1つのボタン。 チャート上のグリッドを表示または非表示にするには、1つのボタン。 ***** 設定で、ボタンを画面上のどこに表示するかを選択できます*****。 私の他の製品をチェックすることを検討してください https://www.mql5.com/en/users/javimorales.fer/seller
ストキャスティックRSIとは何ですか?
ストキャスティックRSI(StochRSI)は、テクニカル分析で使用される指標で、ゼロから1(または一部のチャートプラットフォームではゼロから100)の範囲で、標準の価格データではなく、相対強度指数(RSI)の値の集合にストキャスティックオシレーター式を適用して作成されたものです。
執筆者
ハビエル・モラレス
FREE

速度の抵抗ラインは傾向および抵抗ラインを定めるための強力な用具である。 この指標は、チャートの極値と特別な数式を使用して線を構築します。 指標は、トレンドの方向とピボットポイントを決定するために使用することができます。
<---------------------------->
指標パラメータ:
"Depth of search" -チャートの極端な検索の深さ(バー単位) "Back step of search" -極端な間の最小距離(バー単位) "Deviation of price" -同じタイプの両極端間の許容価格差 "Line color" -対応するインデックスを持つ線の色 "Line style"-対応するインデックスを持つラインスタイル "Line width"-対応するインデックスを持つ線幅 <---------------------------->
あなたは本の中でより多くの情報を見つけることができます"エドソン*グールドによる希少な著作のコレクション"またはプライベートメッセージで私
<---------------------------->
FREE
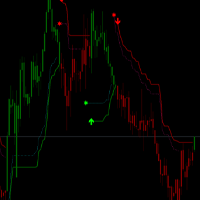
OV-VCS_ATR Trading Rules The OV-VCS_ATR indicator is a popular trend-following technical analysis tool that helps traders identify the current market trend and potential entry/exit points. Below are the general trading rules for using the OV-VCS_ATR indicator: 1. Indicator Overview The OV-VCS_ATR indicator consists of a line plotted on the price chart, which changes color to indicate the trend direction: Green Line: Indicates an uptrend (buy signal). Red Line: Indicates a downtrend
FREE

Unlock the Rhythm of the Markets: Automated Backtesting for Price Action Strategies Experience the power of our revolutionary price action concept backtesting product, capable of conducting years' worth of backtesting in a matter of seconds. Say goodbye to hundreds of hours of manual analysis and hello to instant insights. Our automated backtesting tool empowers traders to create and test strategies from scratch, optimize and refine their current strategies. No more manual constraints - propel
FREE
MetaTraderマーケットは、開発者がトレーディングアプリを販売するシンプルで便利なサイトです。
プロダクトを投稿するのをお手伝いし、マーケットのためにプロダクト記載を準備する方法を説明します。マーケットのすべてのアプリは暗号化によって守られ、購入者のコンピュータでしか動作しません。違法なコピーは不可能です。
取引の機会を逃しています。
- 無料取引アプリ
- 8千を超えるシグナルをコピー
- 金融ニュースで金融マーケットを探索
新規登録
ログイン