YouTubeにあるマーケットチュートリアルビデオをご覧ください
ロボットや指標を購入する
仮想ホスティングで
EAを実行
EAを実行
ロボットや指標を購入前にテストする
マーケットで収入を得る
販売のためにプロダクトをプレゼンテーションする方法
MetaTrader 5のためのエキスパートアドバイザーとインディケータ - 37

An indicator for visualizing time ranges of key trading sessions: Asian, European, and American. The indicator features functionality for setting the start and end times of each trading session, as well as an adjustable timezone of the trading server. The main advantages of the indicator include the ability to operate with minimal CPU load and memory usage. Moreover, it offers the option to specify the number of displayed historical days, providing the user with flexible market dynamics analysis
FREE

Quantic MultiIndices Introducing Quantic MultiIndices, meticulously engineered to operate on four assets: US500, US30, Nasdaq, and DE30. Built upon the renowned concepts of breakout strategies, it is crafted to ensure precision and long term reliability . Key Features and Operational Insights: Timeframe: 1-hour (1H) timeframe.
Robust Risk Management: risks a user-specified amount of money per trade. (Default: $50).
Strategic Use of Trailing Stop and Stop Loss: Employs a volatility-based tra
FREE

The name Aroon means “ Dawn's Early Light ” in Sanskrit. His creator Tushar Chande chose this name because the indicator is designed to catch the beginning of a new trend. At first sight it seems a little confusing all those jagged lines but after you understand the basics of it, you will find this indicator pretty cool and use it in a variety of ways, i.e.: Trigger, Trend Filtering System, and so on. The Aroon indicator was created in 1995 so it is a "modern" indicator compared to the Jurassic
FREE

PLEASE HELP REVIEW/ SUPPORT/ SHARE THIS OTHER INDICATOR HERE https://www.mql5.com/en/market/product/51637 AS YOU DOWNLOAD THIS ONE FOR FREE. THANKS.
This Indicator is based on four moving averages and the PIVOT points. The indicator provides clarity to trading, especially in ranging markets when price is very slow and tight. You can trade intensively daily, every day with this indicator. You may decide to trade with this indicator alone and get the maximum out of the market. The indicator
FREE

If you have difficulty determining the trend as well as entry points, stop loss points, and take profit points, "Ladder Heaven" will help you with that. The "Ladder Heaven" algorithm is operated on price depending on the parameters you input and will provide you with signals, trends, entry points, stop loss points, take profit points, support and resistance in the trend That direction.
Helps you easily identify trends, stop losses and take profits in your strategy! MT4 Version: Click here F
FREE

This is a free version of the indicator, the period between the vertical lines is always 30 bars. In the paid version the period can be set by user, so a configuration with many ThreePointsChannel indicators with different periods is possible.
The principle of construction - on top of any number of bars set by the user, a channel is constructed with maximum and minimum lines so that the bars touch the maximum and minimum of the channel at exactly three points. The name of the indicator follows
FREE

ゴールドターゲットは最良のトレンド指標です。 このインジケーターの独自のアルゴリズムは、テクニカル分析と数学的分析の要素を考慮して資産価格の動きを分析し、最も収益性の高いエントリーポイントを決定し、矢印の形でシグナルと価格レベル(買いエントリー/売りエントリー)を発行します。 注文を開きます。 このインジケーターには、ストップロスの価格レベルとテイクプロフィットの 5 つの価格レベルもすぐに表示されます。
注意: このインジケーターは非常に使いやすいです。 ワンクリックでチャートにインジケーターをインストールし、そのシグナルと価格レベルに基づいて取引します。
インジケーターの利点:
1. インジケーターは高精度の信号を生成します。 2. インジケーター信号は再描画されません。 価格が各ラインを超えた場合に音声通知(アラート&メッセージ)を搭載しています。 3. どのブローカーの MetaTrader 5 取引プラットフォームでも取引できます。 4. あらゆる資産(通貨、金属、暗号通貨、株、指数など)を取引できます。 5. 任意の時間枠で取引できます (M15-M30

About the indicator: DALA Forecast is a universal tool for predicting the dynamics of time series of any nature. For prediction, modified methods of nonlinear dynamics analysis are used, on the basis of which a predictive model is built using machine learning methods. To get the trial version of the indicator, you can contact me in private messages.
How to use the indicator: Apply the indicator to your chosen financial instrument or indicator with the settings you need. The prediction will b
FREE

Indicator can be used for dxy correlation trading. it calculates the dollar index (USDX or DXY) using the EUR/USD, USD/JPY, GBP/USD, USD/CAD, USD/CHF and USD/SEK currency pairs. In order to trade them, you need to find a confirmed technical analysis pattern on the DXY chart and look for a correlated currency pair that has the same picture on its price chart.
The formula used for calculation is the following: USDX = 50.14348112 × EURUSD -0.576 × USDJPY 0.136 × GBPUSD -0.119 × USDCAD 0.09
FREE
Aydmaxx Trade Tracker Description: Aydmaxx Trade Tracker is a powerful and user-friendly tool for traders, allowing you to monitor the current profit or loss for each trade in real-time. The indicator displays the information directly on the screen, helping traders quickly assess the results of their trading operations. Key Features: Displays the current profit or loss for all open positions in real-time. Customizable corner of the screen for displaying information (default is the bottom right c
FREE

Harmonic patterns are characteristic series of price movements with respect to Fibonacci levels, which statistically precede price reversals. This indicator searches for harmonic patterns. It is capable of recognising 26 classical and non-classical harmonic patterns : Classical Gartley Butterfly Alternate Butterfly Bat Alternate Bat Crab Deep Crab Three Drives Non-classical Shark Alternate Shark Cypher 5-0 Anti Gartley Anti Butterfly Anti Alternate Butterfly Anti Bat Anti Alternate Bat Anti Crab

Seeing and interpreting a sequence of Candlesticks is easy to spot when you are a human... Higher Highs, Higher Lows, are the panorama of a Buying trend, at least in a short period of time... Seeing a current candlestick higher high and a lower candlestick low, as a human, you can immediately spot a "divergence", an "alert", a "starting range", but in the end and based on other analysis a human trader can understand and behave accordingly to this kind of candlestick data... But what about EAs (r
FREE

A very useful Price Action point is the previous day Closing VWAP. We call it Big Players Last Fight . This indicator will draw a line showing on your chart what was the last VWAP price of the previous trading session. Simple and effective. As an additional bonus, this indicator saves the VWAP value on the Public Terminal Variables, so you EA could read easily its value! Just for the "Prefix + Symbol name" on the variables list and you will see!
SETTINGS How many past days back do you want to
FREE

You probably heard about Candlesticks behaviors, which in most of the times could denote and trace Volume behaviors even if you are not watching Volume itself... Well, this indicator will do this. Naked traders love to rely solely on candlesticks patterns and with Candle Zones you can trap special patterns and DRAW THEM on your chart. As simple as that. There are several filters you can tweak in order to achieve the analysis you want. Just give it a try. After several months of testing, we think
FREE

The Martinware Manual Trading Helper indicator is aimed at helping people start their lives in manual trading. It can be used to display both some generic images at the right side of the graph, where custom operational remarks may be displayed or just a blank rectangle hiding the chart while backtesting. Moreover, it can periodically play a list of sounds. To show a blank rectangle, let the first image name input field empty and select the desired color. To show one or more custom images inste
FREE
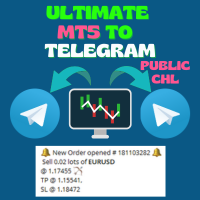
Ultimate MT5 to Telegram Public Channel sends controlled trades (via symbol, magic, comment) to a public telegram channel. It sends open and closed trades, including pending orders and TP/SL modifications, along with chart screenshots, to this public telegram channel. Additionally, you can send trade reports of open trades and summary profit/pip reports for day, week, or month. You can customize the design of the trade actions or reports with variables and emoticons.
A beautiful panel allow
FREE

Elevate your trading with this Metatrader 5 expert – the Position Volume Calculator. This tool takes the guesswork out of risk management and profit optimization. Simply input your desired stop-loss points with dragging the stop-loss line, and let the expert advisor compute the optimal position volume for your trade. Plus, with customizable reward ratios, it's easier than ever to set your take-profit points for maximum gains. Trade with confidence and precision. Try the Position Volume Calculat
FREE

Everyone knows that the best way to make money in the markets is by knowing the future.
Have you ever wished to know the future price of something in advance?
Even if it were just a few days, hours, or minutes ahead?
What if it were possible to know it but with less than a second of advance notice? That's precisely what the PZ Latency Arbitrage EA robot does. PZ Latency Arbitrage EA is your personal time machine: but it can only travel into the past by less than a second. The robot is like Bi

The Angle Prices indicator is a tool that calculates the price angle based on price analysis, interpreting the time vector in the form of price points on the price chart. In other words, the X axis and Y axis are represented as price points, so you can actually calculate the angle with two axes of the same dimension. This allows traders to obtain information about the direction of price movement and possible entry or exit points for trades. Let's look at the main characteristics and interpretat

To download MT4 version please click here . The Volume Oscillator measures volume by analyzing the relationship between two Moving Averages. The Volume Oscillator indicator subtracts a fast MA from slow MA. The fast and slow MA periods are configurable via input tab. Volume indicators are an ingredient of trading systems to avoid entry in thin liquidity markets. Having set a threshold on Volume Oscillator you can avoid entering chop. Buffers are available to access via EA.
FREE

This is the demo version of "All Harmonics 26" indicator . "All Harmonics 26" searches for 26 types of harmonic patterns and outputs them in a convenient way. You can check out the documentation here . This demo version has the following limitations: The indicator searches only for one type of harmonic patterns out of 26:- Gartley. The indicator outputs new patterns with a lag of 10 bars.
FREE

Trade Aide is an MT5 utility to help Forex traders easily open their trades, calculate the correct position size, automatically manage open positions, or limit daily losses. All of this using just a few clicks or keys. The overall purpose of Trade Aide is to allow you, the trader, to solely focus on your technical analysis and setups , instead of worrying about calculations, setting the Stop Loss to Break Even, or any other trade management activities.
How does Trade Aide?
If you norma
FREE
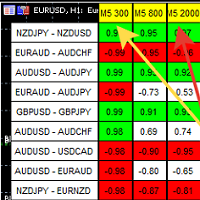
A script showing the correlation for three selected zones at once (TF-bar) In the parameters, select 3 options The data is displayed sorted by the first zone The script also creates a file in which it writes all the data without sorting. In this way, you can expand the number of zones to any number and perform the analysis in exsel
Parameters:
TF_Trade1 =PERIOD_M5; BarsCor1 = 300; TF_Trade2 =PERIOD_M5; BarsCor2 = 800; TF_Trade3 =PERIOD_M5; BarsCor3 = 2000; K = 0.8; WindSize
FREE

シームレスな注文エントリーと自動化されたロットサイズ計算のために設計されたポジションサイジングエキスパートアドバイザーで、プロップファームのあらゆる課題をうまく乗り切りましょう。後で私たちに感謝することになるでしょう!
特徴 成行注文を発注します: SLとTPを設定し、買いまたは売りをクリックします。 未決済注文(逆指値注文と指値注文)を発注します: SLとTPに加えてエントリー価格を設定し、買いまたは売りをクリックします。 ブレイクイーブン: 価格が不利に動いた場合、SLは自動的にエントリー価格に調整されます。これにより、潜在的な損失から資金を保護します。また、リスクレベルを上げることにより、リスク選好度に合わせて調整することもできますし、ブレークイーブン機能を完全に無効にすることもできます。一貫性が取引成功の鍵です。 ポジション統計: 取引を開始すると、EAはすぐにポジションの種類とそれに対応する損益を米ドルとポイントの両方で表示します。
PROの特徴 スケールイン/ヘッジ: 新規ポジション "ボタンを使って、簡単に成行注文や未決済注文を追加し、現在のポジショ

この指標は、トレーダーが市場の方向性を特定するのに役立つように開発されました。取引では、上昇トレンド、下降トレンド、横向きの 3 種類の動きがあります。市場の横方向の動きは、ほとんどのトレーダーが閉じ込められる場所です。統合、これは単に方向性がないことを意味します。スキャルパーにとって、資産クラスがこの期間にいつあるかを特定する方法を知っている場合にのみ、これは彼らにとって有利になる可能性があります.
トレンドを特定するためにくわを開発する試みがこの指標のすべてです。価格が緑の点を上回っている場合に固執し、2 つの連続した点が発生した後に買い取引を行います。または、価格が赤の点を下回った場合は、売りポジションに焦点を当てます。 .
私がこの指標で行ったことは、市場が範囲内にあるとき、価格が赤い点を下回っていないとき、価格が緑の点を上回っていないときは売らないことを避けることです。
私のエントリのほとんどは、価格がドットより上になるのを待ってから、2 回連続してローソク足でトレンドの方向を示します。
FREE

This indicator is a straight port of a well known MetaTrader 4 indicator that is freely available on the Internet. It does not redraw at all. It implements a type of breakout strategy. The arrows indicate market direction. Use the indicator on M15 charts and higher. The indicator draws two bands near price action and generates signals when the price closes below the lower band and also above the upper band. The indicator uses periodic highs and lows to calculate upper and lower threshold bands.
FREE

サイレントトレーダー
完全に自動化されたサイレントトレーダーEAは、マネーフローインデックス、フォースインデックス、アリゲーター、標準偏差の4つのインジケーターからシグナルを受信した後にポジションをオープンします。ストップロスとテイクプロフィットも含まれています。
GBPJPY M30
エントリーロット:最小0.1
ストップロス:162ピップ
利益を得る:197ピップ
最小数:500-1000 $
最大スプレッド:20ポイント
アカウントのレバレッジ-1:500から。
ターミナル-MetaTrader5
勧告:
üMaxLotSize-最大許容取引ロット。このパラメーターは、自分が何をしているかを本当に理解している場合にのみ変更してください。
üTakeProfit-ポイントで利益を取ります。
üStopLoss–ポイントの損失を停止します。
üEAMagic-EAのマジックナンバーであり、アドバイザーがそのポジションでのみ作業できるようにします。グラフごとに異なる値を設定する必要があります。
üこの
FREE

Эксперт, способный приносить прибыль при открытии позиций случайным образом. Показывает хорошие результаты при долгосрочном трейдинге – на периодах от H12.
Особенности
Доступен полностью автоматический режим работы. Открытие позиций производится случайным образом. Применяется Мартингейл – в случае, если предыдущая позиция закрылась с убытком, текущая открывается с объемом, компенсирующим данный убыток. Параметры
Mode – режим работы Эксперта: Automatic – автоматический (рекомендуется); Ma
FREE

This is a Forex Scalping Trading Sytem based on the Bollinger Bands. Pairs:Major Time frame: 1M or higher. Spread max:0,0001. Indicators (just suggestion) Bollinger bands (20, 2); ADX (14 period); RSI (7 period ). Y ou should only trade this system between 2am to 5am EST, 8am to 12am EST and 7.30pm to 10pm EST. Do not scalp 30 minutes before a orange or red news report and not for a hour afterwards. Setup: is for price to move above the lower or lower Bollinger Bands, RSI raise above the
FREE

The YK-SMART-EMA is an indicator that displays multiple Exponential Moving Average (EMA) lines on a price chart to help analyze price trends. This indicator features five EMA lines: EMA14 (red line): Calculated based on the closing prices of the last 14 candles. EMA30 (blue line): Calculated based on the closing prices of the last 30 candles. EMA50 (green line): Calculated based on the closing prices of the last 50 candles. EMA100 (orange line): Calculated based on the closing prices of the last
FREE

Provlepsisインジケーターへようこそ。
「Provlepsis」は、MQLマーケット向けに設計された高度なインジケーターです。 同じ時間帯の過去のローソク足を分析することで、市場の動きの潜在的な範囲を正確に計算し、将来の価格変動に関する貴重な洞察を提供します。 従来のATRインジケーターとは異なり、「Provlepsis」は時間の要素を考慮に入れており、異なる市場状況に適応するより強力なツールとなっています。 夜間には狭い範囲を予測し、活発な取引時間帯ではより広い範囲を予測します。 「Provlepsis」による包括的な範囲分析で、トレード戦略に競争力を持ちましょう。 Provlepsis インジケーターの長さとシフトを変更できるフルバージョンはこちらでご確認いただけます!
https://www.mql5.com/ja/market/product/98802
なぜProvlepsisを使用するのか
レンジベースのトレード:市場の動きの潜在的な範囲を特定する能力は、レンジベースのトレード戦略にとって価値があります。トレーダーは、指標を使用して予測される範囲内の主
FREE

Functional in the Forex market. Functional on the B3 market - Bolsa Brasil Balcão. Motivation The Price Guide indicator is a tool that helps you insert support and resistance points at the chosen price and in the quantity you want, it depends on the agility of its configuration. This DEMO version will work on the Meta Trader 5 Demo account and Strategy Tester. Get the Full version that works with a Real account click: https://www.mql5.com/pt/market/product/111897 Operation The methodology publi
FREE

Signal provider based on RSI Divergences
from a higher timeframe.
First 3 buffers export a signal.
Timeframe for which divergences are detected is optional, see
'RSI divergences timeframe' parameter.
The indicator uses different algorithms for divergences detection:
'Fast' algorithm is the simplest solution that works the fastest.
'Strict' algorithm filters out more noise but works slower than the previous one.
'Full' algorithm uses recursive functions and provides with lots of d
FREE

Indicator introduction:
The indicator is calculated by volumes and prices, It is a single side indicator, only has up arrow signals. It is better to use it in conjunction with other trend indicators, and you need to find the most efficient time to use it in order to acquire a high winning probability. The indicator can send emails, alerts and notifications to you when the indicator before k line has an up arrow. The indicator's parameters can be changed, including the computation period of the
FREE

Transform your financial chart analysis with our innovative Candle Coloring Indicator. This powerful tool allows you to instantly visualize market trends based on closing prices relative to a customized average. Customized Coloring: Choose colors that best suit your analysis style. Highlight candles above the average in a vibrant color of your choice and candles below the average in another distinctive color. Adjustable Average: Tailor the indicator to your trading strategies by setting the aver
FREE

Baby WPR opera automáticamente en base al algoritmo oscilador WPR. Es capaz de llegar a generar resultados alcistas en las pruebas realizadas con el par de FX GBPUSD en el marco temporal H1 Se puede testear en otros instrumentos ajustando sus diversas opciones. Diseñado para operar con un capital mínimo de 100 USD y un apalancamiento de 1:30 Ideal para los iniciados. Con Baby WPR no esperes grandes beneficios con la configuración conservadora por defecto, por el contrario habrán DD significativo
FREE

Expert advisor based on your own personal moving average strategy. Whatever your strategy is, it's him. You can use it on all parities. No restrictions. Settings Buy Settings : 1.Moving Average Period 1.Moving Average Method 2.Moving Average Period 2.Moving Average Period Buy Lot Size Buy Stop Loss Level Buy Take Profit Level
Sell Settings : 3.Moving Average Period 3.Moving Average Method 4.Moving Average Period 4.Moving Average Period Sell Lot Size Sell Stop Loss Level Sell Take Profit Level
FREE

Profitable Scalper EA - Rôla Scalper! Tested on EURUSDm Symbol on Micro Account created in XM Broker, but you can try it in any market or broker, any way I recommend that you use it on markets with volatility similar to EURUSD.
This EA can open a lot of positions, so I recommend that you use a broker that don't have comission fee and provide low spread.
You can use settings on 5 minutes timeframe, since I started to use it, and in tests, the maximum drawdown with this settings and M5 timefr
FREE

Promo price: 179.99 (first 10 purchases)
J# (Jay Sharp) is an EA that has been a result of careful analysis of the cross pair behaviors which results into a strong performing EA with the risk tailored to your appetite. J# uses Grid in its strategy: primarily to escape bad entries which are not frequent, however happen along with the 2 level grid mechanism for a better protection. J# is a fully testable and reproducible advisor where the real trades fully matching historical ones so it can be

Colors generated according to trading volume and market direction.
The analysis is carried out following the direction of the price and volume traded if the traded value exceeds the calculation base the system changes the color to green, informing you that the price direction is strong to buy, if the traded value is less than the calculation base the system changes to red, indicating that the price is strong for sale.
FREE

Resistance and Support is an easy to use indicator to apply horizontal lines of resistance and support. There are two windows for adding levels. When you press the button, a line appears on the price chart. It is possible to move this line with the mouse, thereby changing the indicator readings. In the indicator menu there is a choice of possible alerts - no alert, alert on touching the level and an alert for closing the candle after the level.
FREE

In this indicator you choice a data to be used from yesterday (high, low, open, close, etc) to automatically draw an line to be the zero. And, from that a percentage deviation ("Percentage to be used") is calculated and used to draw others line to both side until a limit be reached.
Both sides can have diferrent colours as show in screenshots. Also, more than one indicator can be used at same time.
FREE
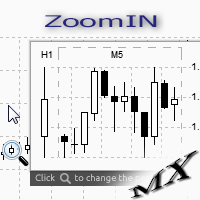
The ZoomIN MT5 indicator is designed for quickly viewing the selected bar on the smaller timeframes in a pop-up window. Once launched, the indicator works in the background, does not take up space on the chart and does not consume system resources. When the indicator is activated by the Shift + i combination (can be changed in the settings), a pop-up window with a chart of a smaller timeframe is created. The displayed timeframe can be changed by a left-click on the magnifying glass icon. To hide
FREE

Ever wanted to use MACD like you see in TradingView??? Now you can use this indicator to use same MACD in your MetaTrader5 and enjoy more time in Trading.. You can change MACD settings if you want to change and it will be ready to use for you... Now you will not spend time in TradingView to use only indicator there... Open charts , load Indicator and you are ready to do analysis in MetaTrader5 and Put Trades when you feel okay with your analysis.
FREE

This indicator displays MTF (Multi-Time Frame) Candles on your Chart. It helps to see the overall Trend of Market. You can specify 2ndLast, Last or Current Candle of any timeframe to show to get a better picture of Trend.. You get 4TF Bars/Candles on your current chart ..
Customizable Settings are : 1. Where to place MTF Candles.. 2. Show or Hide for each Candle 2. Time-Frame for each Candle 3. Current/ Last / 2nd Last of Each Candle
FREE
This MQL5 Expert Advisor is an adaption of the trading strategy made famous by trading legend Larry Conners. The EA essentially buys on the dips and sells on the rises. Buy Signal
Current candle is above the 55 EMA
RSI 2 period is below 10 Sell Signal
Current candle is below the 55 EMA
RSI 2 period is above 90 This strategy has been adapted into a scalping strategy. Default settings are for EURUSD 1H time-frame 2018/01/01 - 2020/05/30
FREE

The Candle High Low Exit indicator uses the highest high and the lowest low of a range to draw trailing stop lines (orange under buys, magenta over sells) that advance with the trend until the trend changes direction. Moreover, the trailing stop lines are generated to support the order’s trend direction (long or short): In an upward trend, the long trailing stop line (orange line under buy) appears and advances upward until the close crosses under the line.
In a downward trend, the short tra
FREE

The Nasdaq is an index with a lot of movement, and at the moment, the technology sector not only has a future but, with the emergence of AI, it becomes increasingly powerful and indispensable. The foundations of the new society will be based on technological development. As for the expert, performs buying operations in DAILY TIMEFRAME using price reversal with RSI, accompanied by MACD. He also closes operations through RSI overbought conditions. He does not use stop loss, so it is not suitable
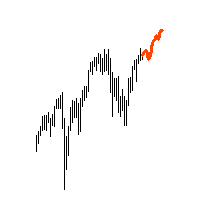
"AV Forecast MT5" is a preview or forecast indicator for MetaTrader 5, which draws forecast future price changes on the chart based on historical data. To do this, it primarily uses the everyday rhythm and the seasonality of the year. For timeframes below H1 closer dates can be selected. The lines for calculation can be made visible.
Settings:
- Draw line for x candles: draw x candles in the future
- Show all lines: yes/no
- Look back years or mixed (> H1 same): one year back or less b
Boom Trader This robot is developed to trade Boom 1000 which is available on Deriv. Boom 1000 is one of other many indices which its behaviour is to form the spike of few pips, Those spikes always happen after 1000 ticks. To avoid spikes i came up with idea of develop the robot which take sells and few buys. IMPORTANT! After the purchase please send me a private message to receive the installation manual and the setup instructions.
•All settings on this robot are adjustable but if you want t

Simple ATR breakout is a product that capitalizes on ATR (Average True Range) breakout points as entry points in the market. The product can be utilized in most diverse currency pairs but the most recommended is CADCHF. This adviser is designed to capitalize on morning breakouts as entry points and trade their consequent trends. You can still trade on other breakouts during the day. For live trading you can use a lot size of 0.02 but this can be increased.

RSI Entry Points is the upgrade of the standard RSI indicator to avoid lagging. Indicator draws the clouds and the arrows to have clear picture where price is and what to wait for. Why standard RSI is lagging? because mostly we do not use it correctly and it is with very weak visual flexibility, less informativity. With my current upgrade I tried to Fix both problems same time and I got much better results and more exact entries than standard RSI has. To make yourself sure check out the screens

Volatility Doctor Basic Editionのご紹介:究極の市場の達人!
真の精密トレードの潜在能力を解き放つ旅に出る準備はできていますか?私たちがVolatility Doctorをご紹介いたします。これは外国為替市場の絶えず進化する世界での信頼のおける仲間です。この非凡な多通貨専門家アドバイザーは、ただのトレードツールにとどまらず、あなたの投資を比類のない精度と洗練さで指揮するバーチュオーゾの指揮者です。
ゲームを変える機能をご紹介します:
1. 無類のトレンド分析:Volatility Doctorは市場の堅牢なトレンドを特定するために実戦済みの方法を採用しています。推測的な当てずっぽうにさようならし、情報に基づいた決断の新時代を迎えましょう。
2. あなたの手に完全なマスタリー:組み込まれた資金管理ツールで、トレード戦略を完全にコントロールしましょう。いつでも開くポジションの数とトレードサイズの増幅度を決定します。それはあなた自身のプレイブックであり、あなたの独自の好みに合わせて調整されています。
3. Volatility Maestr
FREE

Elliot Waves Analyzer Pro calculates Elliot Waves to Help Identify Trend direction and Entry Levels. Mainly for Swing Trading Strategies. Usually one would open a Position in trend direction for Wave 3 or a Correction for Wave C . This Indicator draws Target Levels for the current and next wave. Most important Rules for Elliot Wave Analysis are verified by the Indicator. The Pro version analyzes Multiple Timeframes and shows the Subwaves and Target-Levels. For an Overview " Elliot Waves Anal

Mount Gold EA MT5 is based on combinations of classic indicators that include trend following as well as oversold/overbought strategies for trading the XAUUSD pair and is suitable to trade on Prop firms account. It includes furthermore a powerful flexible configurable recovery mechanism as well as the option to place and close orders manually. For active Traders it makes it even more flexible for trading of further instruments than XAUUSD. All the trade entries and exits are provided by virtual

The Strat を使用して取引する場合、複数の時間枠に注意することが重要です。 このインジケーターは、各時間枠の現在のローソク足の毎日、毎週、毎月、および四半期ごとの状態を示します。 円のアイコンは、その時間枠のろうそくが現在インサイド、または TheStrat 用語でタイプ 1 であることを示します。 Inside Day ローソク足が値動きを強化しており、レンジのブレイクアウトを探しています。 上向きまたは下向きの三角形のアイコンは、トレンド キャンドル、または TheStrat 用語ではタイプ 2 です。トレンドろうそくは強気または弱気のいずれかであり、以前のろうそくの範囲を突破し、現在一方向にトレンドになっていることを示します. 正方形のアイコンはアウトサイド キャンドル、またはストラト用語でタイプ 3 です。これは 2 つのことを示しています。1 つはその時間枠での方向性について価格が未定であり、おそらく非常に途切れ途切れであるということです。もう 1 つは、より短い時間枠では短い反転取引を行う良い機会がある可能性が高いということです。正方形は強気または弱気の色になり、ど

This indicator draws the prior Highs and Lows for multiple timeframes, and can display potential Take Profit and Stop Loss levels. In Rob Smith's # The Strat terms, these are potential entry points, or alternatively potential targets for open positions. I like to use them in both ways. On a lower timeframe, say 5 minutes to get a good entry on a daily or weekly level, and then as a potential target. Very small stops required giving an excellent risk/reward ratio. Key Features
- Levels from Ho

Tax Buddy creates a simple, sortable trading report which you can send to your local tax authorities alongside your annual declaration. I've been using this kind of report for the German Finanzamt in order to declare my capital gains ("Kapitalerträge") in a readily comprehensible manner. For testing purposes, the Demo version places random trades in the Strategy Tester on the symbol of your choice and creates a demo report for them.
Conveniently, all reports are stored in the common path for a

The Trend Quality Indicator (by David Sepiashvili) is intended to measure trend activity. Some benchmarks can be used to determine the strength of a trend.
In the range of values from -1 to +1 ( Ignored zone parameter) , the trend is buried beneath noise. It is preferable to stay out of this zone.
The greater the value, the less the risk of trading with a trend, and the more reliable the trading opportunity.
The range from +1 to +2, or from -1 to -2, may be treated as zone of weak tr

Introducing the Order Block Indicator , the pinnacle of trading technology. Order blocks, the large cluster of buy or sell orders placed by institutional traders, significantly influence market direction. They form at critical price levels and can act as robust support and resistance zones. Our cutting-edge indicator allows you to harness the full potential of these influential market dynamics, providing a never-before-seen level of precision and customization. Here's why this tool stands apart:
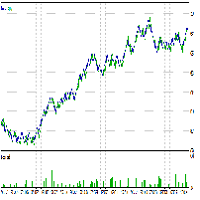
To access the MT4 version of this EA you can contact via private message. Also you can contact for further modifications. strategy description: - Detect underlying trend using the BxTrender indicator in daily time frame. - Trigger entry using supertrend indicator in M15 time frame. - Also use supertrend indicator to set SL and TP accordingly. EA setup - Nasdaq and other indices(like DAX40) are suggested to be traded. - Risk per trade is hard coded to 0.5%. - Risk:Reward ratio is hard coded to 1:
FREE

Description Helps you detect the structure of the market, using different types of Smart Money concepts. This should help you to upgrade your trading strategy in every way. Smart Money Features: Color candle to signal the type of structure Shows CHOCH and BOS Equal Lows and Highs Order Blocks Internal and Swings Weak and strongs high and lows Fair Value Gaps High and Lows in daily weekly and monthly timeframes Premium and discount Zones KEY LINKS: How to Install – Frequent Questions - All

KT Momentum Arrows Indicator is based on a momentary breakout which is calculated using the bands deviation and emerging volatility in a certain direction. A buy signal is generated when the price closes above the upper band and a sell signal is generated when the price closes below the lower band. A magnitude coefficient is used as the input which affects the band deviation and volatility at the same time. The coefficient value should be carefully selected and analyzed based on the instrument a

このツールは、ポジションにストップを配置します
Metatrade Strategy Tester ですばやくテストします。 ロング ポジションの場合、ストップは最後の底になります。 または、ショート ポジションの場合、ストップは最後のトップになります。
さらに、このツールはオープン ポジションのトレーリングを管理します。 常に最後に形成された高値または最後に形成された底にストップを置きます
上値と下値を作成するには、このリンクからダウンロードできる無料のインジケーター「サポートとレジスタンス ライン」を使用します: メタトレード 5 の無料の上下インジケーターをダウンロード
このツールは、挿入された資産のすべてのオープン ポジションのストップを移動します。
ストップロスとテイクプロフィットレベルの自動設定のためのユーティリティ。トレーダーのためにプロのトレーダーによって作成されました。ユーティリティは、トレーダーが手動で、またはアドバイザーを使用して開いたすべての成行注文で機能します。魔法数で取引をフィルタリングできます。ユーティリティは、同時に任意の数の注文を処理できます。
MT4バージョン https://www.mql5.com/en/market/product/56485
ユーティリティでできること:
仮想ストップロスを設定し、1ピップから利益を得る 本当のストップロスと利益を取る 各注文を個別に処理します(ストップロスとテイクプロフィットは各注文に個別に配置されます) 一方向注文のバスケットで作業します(ストップロスとテイクプロフィットはすべての注文に共通に設定され、購入と販売は別々に設定されます) 多方向注文のバスケットで作業します(ストップロスとテイクプロフィットはすべての注文に共通に設定され、一緒に購入と販売します) テストと作業には、チャートのボタンを使用できます。
オプション:
STOPLOSS
Introducing the Boom and Crash Indices Killer EA for MT5 Welcome to the next evolution in trading with the Boom and Crash Indices Killer EA, specifically designed for MetaTrader 5 (MT5). This expert advisor (EA) is engineered to trade Boom and Crash indices with unparalleled precision, leveraging advanced price action strategies. Here’s a comprehensive overview of what makes this EA a must-have tool for traders looking for consistent profitability and robust performance. Key Features and Benefi

Fair Value Gap (FVG) Indicator: Master the ICT Method in Forex Trading
What Traders Are Saying: " Transformed my trading approach with its precise gap spotting ..." – J. Doe " The alert feature is a lifesaver, never miss a trading opportunity.. ." – Alex P. " A crucial tool for anyone following the ICT methodologies in Forex. .." – Samantha R. Unlock the secrets of price movement in the Forex market with the revolutionary Fair Value Gap (FVG) Indicator. Designed for precision and ease of use,

チャート同期インジケーター - ターミナル ウィンドウのグラフィック オブジェクトを同期するように設計されています。 作業するには、オブジェクトのコピー元のチャートにインジケーターをインストールします。このチャート上で作成されたグラフィック オブジェクトは、インジケーターによって同じシンボルを持つすべてのチャートに自動的にコピーされます。インジケーターは、グラフィック オブジェクトの変更もコピーします。 入力パラメータ: exception - コピーする必要のないグラフィック オブジェクトの名前の接頭辞。複数のプレフィックスを指定するには、「;」で区切って入力します。 SyncVLINE - 垂直線を同期します。 SyncHLINE - 水平線 SyncTREND - トレンドライン SyncTRENDBYANGLE - 角度別のトレンド ライン SyncCYCLES - 循環ライン SyncCHANNEL - 等距離チャネル。 SyncSTDDEVCHANNEL - 標準偏差チャネル SyncREGRESSION - 線形回帰チャネル。 SyncPITCHFORK - アンドリュー

THE LEGENDARY AND THE ONE AND ONLY ORIGINAL PROP MASTERS EA!!!
Prop Masters EA for GBPUSD H1 Chart: The Epitome of Precision and Performance Embark on a revolutionary trading journey with Prop Masters EA, meticulously engineered for the GBPUSD H1 chart. Dive into the financial currents with a formidable win rate of 96% and a prudent risk management system maintaining a maximum drawdown of just 2.6%. With over 4600+ trades since March 2021, this expert advisor is a testament to consistency and

Swiss VWAPsimple Motivation Did not find free VWAP that works, the one that I found craseh. So I created a VWAP which calculates values only for the actual day. So computer resouces are not over stressed.
What is VWAP, how is it used? VWAP stands for Volume Weighed Average Price, it calculates the running sum of tick volume and the runnung sum of price times tickvolume. The division of these sums result in a weighed price (Sum P*V/Sum V). The calculation starts normally at midnight. The value
FREE
MetaTraderマーケットは自動売買ロボットとテクニカル指標を販売するための最もいい場所です。
魅力的なデザインと説明を備えたMetaTraderプラットフォーム用アプリを開発するだけでいいのです。マーケットでプロダクトをパブリッシュして何百万ものMetaTraderユーザーに提供する方法をご覧ください。
取引の機会を逃しています。
- 無料取引アプリ
- 8千を超えるシグナルをコピー
- 金融ニュースで金融マーケットを探索
新規登録
ログイン