Смотри обучающее видео по маркету на YouTube
Как купить торгового робота или индикатор
Запусти робота на
виртуальном хостинге
виртуальном хостинге
Протестируй индикатор/робота перед покупкой
Хочешь зарабатывать в Маркете?
Как подать продукт, чтобы его покупали
Торговые роботы и индикаторы для MetaTrader 5 - 42

Day Points
Indicadtor that shows the points considered important for X days. (Open,Close, High, Low) Used a lot by those who do day trade. These points can be used for decision making by a trader. You will choose the amount of days ago for it to show.
Settings High/Low/Close/Open Show - True/False. Days - Number of days that will show on the chart. Color - Line Color. Style - Line Style.
FREE

Советник - скальпер использует стратегию на основе торговли внутри бара на таймфрейме Н1 и Н2. Также используется много фильтров для обнаружения правильных сигналов для открытия ордера. \советник использует отложенные ордера BuyStop и SellStop. Советник торгует на двух парах: EURUSD, USDJPY и двух таймфреймах H1, H2. Также советника можно установить и на другие валюты используя инструкцию: https://www.mql5.com/ru/blogs/post/750726 Советник устанавливает защитный стоп-приказ на все ордера.

[ MT4 Version ] Advanced Bollinger Bands RSI EA MT5 Advanced Bollinger Bands RSI EA is an Expert Advisor based on the worldwide known strategy BB & RSI. This strategy uses the Bollinger Bands indicator in combination with the RSI, the signal triggers only when both the BB and the RSI indicate at the same time overbought or oversold conditions. Both indicators make a great combination to anticipate big explosive moves. Advanced Bollinger Bands RSI EA grants the user the posibity to use 3 differen

What are Donchian Channels? Donchian Channels are three lines generated by moving average calculations that comprise an indicator formed by upper and lower bands around a mid-range or median band. The upper band marks the highest price of a security over N periods while the lower band marks the lowest price of a security over N periods. The area between the upper and lower bands represents the Donchian Channel. Career futures trader Richard Donchian developed the indicator in the mid-twentieth c
FREE

Sharing-Is-Caring Trade Copier
Features Local & Remote copy One tool can act as provider or receiver of trades Co-exist with other positions opened manually or from other expert advisors Can be stopped and restarted at any time without any issues such as deals getting closed mysteriously Copy same lot or adjust according to your balance and leverage Partial close/open Manage max funds to use One provider can copy to unlimited number of receivers One receiver can copy from unlimited number of
FREE

AMPV Reversals — идеальный индикатор как для начинающих, так и для опытных трейдеров. Благодаря простоте и удобству каждый пользователь может попробовать его и выбрать тот паттерн, который ищет.
Индикатор анализирует структуру рынка и определяет модели свечевых паттернов, чтобы помочь трейдерам найти лучшие точки для входа в сделку. Рекомендую использовать в паре с индикаторами тренда для достижения наилучших результатов.
Преимущества:
Работает на всех парах и таймфреймах
FREE

Утилита Market Grid View заменяет стандартное окно "Обзор рынка". Утилита позволяет пользователю быстро переключаться между символами одним щелчком мыши, просматривать изменение цены или последние сделки. Для использования утилиты включите необходимые символы к Обзоре рынка, а затем Обзор рынка можно закрыть. Затем запустите утилиту на графике. Настройте параметры: Columns: количество отображаемых столбцов ShowInfo: тип отображаемой информации значение последней сделки по символу изменение цены
FREE

Инструмент защиты средств на счете является необходимым инструментом, предназначенным для защиты вашего чистого счета. Когда на вашем счете одновременно запущено несколько программ автоматической торговли, особенно когда вы спите ночью, возможны непредвиденные потери из-за чрезвычайных событий или сбоев в программе торговли. Этот инструмент эффективно поможет вам избежать таких проблем. Настройка инструмента очень проста - вам нужно только ввести желаемую сумму для защиты. Мы рекомендуем определ
FREE

The utility places a grid of pending orders . You can select the number of orders in the grid, the step between orders, multiplier for the order size, SL and TP levels and the magic number. MT4 version of the utility is avaliable by the link - https://www.mql5.com/en/market/product/73490 If you like this utility, take a look at my other products - https://www.mql5.com/en/users/nina_yermolenko/seller
FREE

PA Touching Alert избавит вас от необходимости днями напролет следить за ценой в ожидании ее касания важных ценовых уровней. Индикатор позволяет установить два ценовых уровня: верхний и нижний, которые должны быть выше/ниже текущей цены соответственно. Как только цена коснется одного из них, сработает алерт и/или уведомление. Уровни можно использовать в качестве сильной поддержки/сопротивления. Отзывы и пожелания приветствуются.
Входные параметры upper_pa: верхний ценовой уровень lower_pa: ниж
FREE

MT4 версия | Индикатор Valable ZigZag | FAQ Волновая теория Эллиотта – это интерпретация процессов на финансовых рынках, которая опирается на визуальную модель волн на графиках цены. Согласно этой теории, мы точно можем знать какая тенденция преобладает сейчас на рынке, восходящая или нисходящая. Индикатор Valable ZigZag отображает волновую структуру рынка , а также говорит о направлении основного тренда в данный момент на текущем таймфрейме. Индикатор Trend Monitor VZ для в

Этот индикатор решает проблему масштабирования графика, при котором бар становится слишком тонким и становится трудно определить цены открытия и закрытия бара.
Индикатор Thick Bar - позволит менять толщину линий и цвет обводки, за счет чего можно получить более толстый бар на графике. Индикатор по умолчанию имеет толщину бара равную 2 и предустановленные цвета, которые можно менять в настройках
FREE

Скользящая средняя Т3 Тиллсона была представлена миру технического анализа в статье «Лучшая скользящая средняя», опубликованной в американском журнале Technical Analysis of Stock Commodities. Разработанный Тимом Тиллсоном, аналитики и трейдеры фьючерсных рынков вскоре увлеклись этой техникой, которая сглаживает ценовой ряд, уменьшая при этом лаг (лаг), типичный для систем следования за трендом.
FREE

Zigzag Indicator For RSI, To easily identify the highs and lows of the rsi signal. It is easier to observe divergent and convergent signals. Default setting: InpRsi =14 //Rsi Period InpDepth =12; // Depth InpDeviation =5; // Deviation InpBackstep =3; // Back Step
If you want open Exness account try this link : https://one.exness-track.com/a/teg5teg5 Dev buy taphu: Ha Van Tan - hatatrata - Trader's profile - MQL5 community Email: tan.ha@outlook.com
FREE

Инструмент «Менеджер соотношения риска и вознаграждения» представляет собой комплексный инструмент для визуального отображения торговых ордеров и калькулятора размера позиции (лота), который предоставляет интуитивно понятную панель для эффективного и обоснованного принятия решений. Он универсален и без проблем работает с различными символами, включая валютные пары, индексы, металлы, сырьевые товары и криптовалюты. Инструмент управления соотношением риска и вознаграждения оптимизирует торговый пр

Советник с автоматическим подбором и оптимизацией всех параметров под торговый символ для MetaTrader 5.
Торговый советник без настроек! Tick Hamster – Это Автоматический торговый эксперт для новичков и пользователей, которые не хотят настраивать советник! С нашим автоматическим торговым экспертом, разработанным специально для новичков, торговля станет проще, чем когда-либо прежде. Попрощайтесь с хлопотами по настройке советника и скажите "здравствуйте" торговле без стресса. Приступайте к
Boom Trader This robot is developed to trade Boom 1000 which is available on Deriv. Boom 1000 is one of other many indices which its behaviour is to form the spike of few pips, Those spikes always happen after 1000 ticks. To avoid spikes i came up with idea of develop the robot which take sells and few buys. IMPORTANT! After the purchase please send me a private message to receive the installation manual and the setup instructions.
•All settings on this robot are adjustable but if you want t

простой советник, основанный на количестве x последовательных свечей для открытия покупки или продажи,
Минимальный депозит: 400 долларов США за лот 0,1 (минимальное кредитное плечо 1:50) только для индекса бума и краха... увеличение лота происходит на каждые 1000 долларов США, поэтому, если мы начали с 400 и достигли 1400, мы торгуем 0,2 и так далее.
Настройки по умолчанию лучше всего оптимизированы для стабильно низкой производительности DD.
ВРЕМЯ: Только 1M, этот советник работает тол

Индикатор находит уровни максимального и минимального ценового объема (профиль рынка) на рабочей гистограмме для указанного количества баров. Композитный профиль. Высота гистограммы полностью автоматическая и адаптируется к любому инструменту и таймфрейму. Используется авторский алгоритм и не повторяет известные аналоги. Высота двух гистограмм примерно равна средней высоте свечи. Умное оповещение (smart alert) поможет вам сообщить о цене, касающейся уровня объема.
Концепция Smart Money. Low V

Trend Chief — это продвинутый алгоритм индикатора, который отфильтровывает рыночный шум, определяет тренд, точки входа, а также возможные уровни выхода. Используйте более короткие таймфреймы для скальпинга и более высокие таймфреймы для свинг-трейдинга.
Trend Chief идеально подходит для всех инструментов Metatrader: валют, металлов, криптовалют, акций и индексов.
* Как пользоваться индикатором Trend Chief: - Получите основной тренд, посмотрев на дневной и H4-графики - Если тренд восходящий,

Смысл этого индикатора состоит в том, чтобы находить уровни Мюррея на всех таймфреймах и объединять их в комбо-уровни , включающие сигнальные уровни, основанные на сильных уровнях Мюррея (+2, +1, 8, 4, 0, -1, -2). Чем меньше таймфрейм, тем больше у вас шансов сразу увидеть уровень комбо. Он будет выделен цветом. При наведении курсора на любое число появится подсказка, к какому таймфрейму относится уровень. Но вы всегда будете видеть текущий таймфрейм крайним левым. Умное оповещение помо
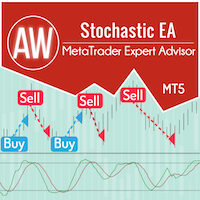
Автоматизированная продвинутый торговая система. Советник торгует по сигналам классического индикатора Stochastic". Для выхода из позиций использует интеллектуальную систему трейлинга и усреднение с помощью отложенных ордеров Преимущества: Полностью автоматизированная торговая система Настраиваемые сигналы осциллятора для работы робота Интуитивно простая настройка входных переменных Подходит для любых типов инструментов и любых таймфреймов Встроенная система регулируемая система трейлинга Реше

Индикатор отображает сигналы по системе Джейка Бернстейна MAC (Moving Average Channel - Канал скользящих средних) ---------------------------------------- Система предусматривает несколько способов открытия позиций, в индикаторе реализован только один - открытие позиции по окончанию (закрытию) бара. Подробно об этой системе можно узнать из бесплатных уроков Джейка Бернстейна https://www.youtube.com/@JakeatMBH/videos Стрелочкой показывается бар, на котором открывается позиция, крестик - уровень
FREE

This EA is named Dinosaur Hunter(DH) because it can capture very large trend, such as 5000-10000 pips. DH trades infrequently as it patiently waits for the right market conditions. DH can load multiple currency pairs on a single chart to increase the number of trades. Live Signal
This is a demo version that only for fixed lot size of 0.01. To obtain the full version, please purchase Dinosaur Hunter Pro . This EA has been tested from 2015 to the present. The test used data from Dukascopy. If
FREE

Индикатор Pz Market Sentiment оценивает рыночную тенденцию на основе примерных измерений ценового движения. Данный индикатор является подтверждающим и может быть особенно полезен для трейдеров, ориентирующихся на ценовые движения. Использовать его для принятия торговых решений нельзя, так как текущее поведение цены и господствующая на рынке тенденция могут не совпадать. Пользоваться индикатором довольно легко: Можно покупать, если осциллятор зеленый Можно продавать, если осциллятор красный
Ре
FREE

Simple indicator to calculate fibonacci retracement levels on time. Add to chart and move trend line to set the fibonacci retracement levels. Inputs Levels - levels for which to calculate values, separated by space, default are fibonacci levels Show time - if true, time will be shown on levels Show date - if true, date will be shown on levels Show fibonacci level - if true, value of levels will be shown Fibonacci lines color - color of levels Trend line color - color of trend line which de
FREE

Tops & Bottoms Indicator FREE Tops abd Bottoms: An effective indicator for your trades
The tops and bottoms indicator helps you to find ascending and descending channel formations with indications of ascending and/or descending tops and bottoms. In addition, it show possibles opportunities with a small yellow circle when the indicator encounters an impulse formation.
This indicator provide to you more security and speed in making entry decisions. Also test our FREE advisor indicator:
FREE

For more support and resistance check Support and Resistance for All Market Cycles
For more details of the inputs please enter our comunnity ( https://discord.gg/GHFZkKkEBq )
High and Low of the Day Highest and Lowest Close of the Day High and Low of Previous x Bars divided by x times (Variable based on inputs) Bars Maximum represents the max of previous bars you want Progression is how much lines you want, and consecutively how often is it divided bars maximum You can pick and choose what
FREE

Этот мощный инструмент автоматически идентифицирует линии тренда, помогая оптимизировать вашу торговую стратегию и принимать более обоснованные решения. версия MT4
Ключевые функции автоматическое обнаружение линии тренда : индикатор «основной линии тренда» сканирует рынок для потенциальных линий тренда и мгновенно отображает их на вашей диаграмме.Это экономит вам ценное время и гарантирует, что вы никогда не пропустите важную тенденцию. Панель для пользователя : наш индикатор поставляется

Necessary for traders: tools and indicators Waves automatically calculate indicators, channel trend trading Perfect trend-wave automatic calculation channel calculation , MT4 Perfect trend-wave automatic calculation channel calculation , MT5 Local Trading copying Easy And Fast Copy , MT4 Easy And Fast Copy , MT5 Local Trading copying For DEMO Easy And Fast Copy , MT4 DEMO Easy And Fast Copy , MT5 DEMO
The homeopathic indicator is also called the CCI indicator. The CCI indicator was propos
FREE

Удобный трендовый индикатор. Не меняет своих значений. Имеет огромные возможности для настройки. Не требователен к ресурсам компьютера. Создавался для работы в системе BearsHunter. Эксперт МТ5 с использованием данного индикатора: https://www.mql5.com/ru/market/product/30381 Эксперт МТ4 с использованием данного индикатора: https://www.mql5.com/ru/market/product/30383
Параметры:
m1_MA_Mode_1 - метод усреднения(0-9). m1_MA_Mode_2 - метод усреднения(0-9). m1_MA_Mode_3 - метод усреднения(0-9). m1
FREE

QuantumAlert RSI Navigator is a free indicator available for MT4/MT5 platforms, its work is to provide "alerts" when the market is inside "overbought and oversold" regions in the form of "buy or sell" signals. This indicator comes with many customization options mentioned in the parameter section below, user can customise these parameters as needful. Join our MQL5 group , where we share important news and updates. You are also welcome to join our private channel as well, contact me for the priva
FREE
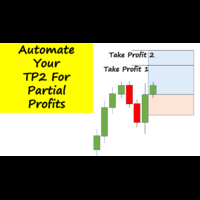
Have you ever been in a winning trade and wanted to close say half of position to lock in some profit. Well, this expert advisor does just that for you, and it's absolutely free. What you need to do is set what percentage of your trade you'd like closed and then set the price you like to close at. It that simple.
To get a better understanding of how it works, then watch the video below.
Note: The EA only works with one timeframe, changing timeframes will result in lose of all data by the E
FREE

Индикатор является мультитаймфреймовой версией индикатора Supply and Demand . Он позволяет анализировать график, используя закон спроса и предложения на трех разных таймфреймах одновременно. Вы сможете увидеть, в каких ценовых зонах происходили покупки и продажи, и определить наиболее выгодные места для открытия позиций. В качестве основы индикатора используется принцип фрактальности рынка. Зоны на графике отображают места, где наличие сильного покупателя либо продавца заставило цену развернут
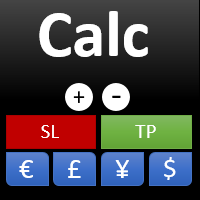
Данный индикатор предоставляет все полезную информацию о символе, счете, позициях и прибыли. Он разработан, чтобы улучшить управление капиталом трейдеров.
Параметры Calc можно условно разделить на несколько блоков. Каждый блок можно скрыть, настроить его цвет и другие свойства. Блок информации о символе: В этом блоке отображается информация о текущем спреде (SPREAD), стоимости пункта (POINT VALUE - в валюте депозита на 1 лот), своп для длинных (SWAP LONG) и коротких сделок (SWAP SHORT). Show s
FREE
Use this expert advisor whose strategy is essentially based on the Relative Strength Index (RSI) indicator as well as a personal touch.
Other free expert advisors are available in my personal space as well as signals, do not hesitate to visit and leave a comment, it will make me happy and will make me want to offer content. Expert advisors currently available: LVL Creator LVL Creator Pro LVL Bollinger Bands
Trading is not a magic solution, so before using this expert on a live account, carr
FREE

Этот продукт получает информацию от индикаторов/сигнальных инструментов и отображает стрелки или уведомления при выполнении определенных условий.
Например, стрелки и уведомления отображаются, когда MA25 и MA50 пересекаются, когда SAR разворачивается, когда MACD меняет свой плюс/минус или когда цена закрытия пересекает полосы Боллинджера.
Пожалуйста, обратитесь к примеру изображения настроек для конкретных конфигураций.
Подробные руководства и файлы конфигурации:
https://www.mql5.co
FREE

Этот советник предлагает следующие возможности:
стоп-лосс (управление рисками), тейк-профит (управление капиталом), Tralingstop и Tralling-Step (после свечей), безубыток (стратегия), частичная продажа (стратегия), закрытие ордера (стратегия),
Настраиваемые параметры:
1: Magicnumber 2: Commentar 3: Risk, Riskmin end Riskmax 4: Total Orders 5: Sl-(Strategy) 6: TP-(true/false points) 7: Prtial sale end Breakeven 8: Day Positiv end Trading 9: Dayrange 10: Trailingstop Normal end Intelligent (
FREE
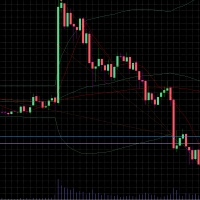
BB Trader is based on the Bollinger Band indicator based on a sell above upper band and buy below the lower band strategy. The EA allows use of multiple grid trades with ATR adjusted spacing. Coded into the EA is a proprietary auto lot sizing algorithm used for placing grid trades. Closing of trades is set in points and an option is included to utilise the opposite Bollinger Band condition.
FREE

A new box will be added, if the closing price is higher than the maximum (lower than the minimum) of the current box series no less than for the specified value. Reversal will be made, if the closing price is higher (lower) than the last box on a value no less than the specified.
T his is a trend indicator and it can be used as an alternative for the trend definition instruments which use averaging.
FREE
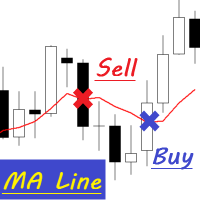
A cross between the candlestick and the moving average line.
MA Line is Expert Advisor which is very simple by working as below: Buy Condition 1. Perivious open candle bellow MA Line 2. Previous close candle above MA Line Sell Condition 1. Perivious open candle above MA Line 2. Previous close candle below MA Line
EA Parameter - Time Filter - Lot - MA Period - MA Method - Stop Loss - Take Profit - Trailing Start - Trailing Step - Trailing Stop - Magic Number
FREE
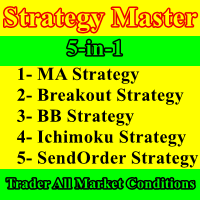
Strategy Master is a 5-in-1 EA, offering a choice of 5 distinct strategies within a single expert advisor. You can activate one to five strategies simultaneously and customize your trading by enabling or disabling filters to validate entries. These five strategies encompass a range of approaches, including three technical strategies (Moving Average, Bollinger Bands, and Ichimoku), a renowned price action strategy (Breakout), and a time-based strategy (SendOrder at Time). The link for MT4 version

Индикатор сканирует до 15 торговых инструментов и до 21 таймфрейма на наличие высоковероятностных моделей паттерна Двойная вершина/дно с ложными прорывами . Что определяет этот индикатор: Этот индикатор находит особую форму таких паттернов, так называемые двойных вершин и нижних частей, так называемый Двойная вершина/дно с ложными прорывами . Паттерн "Двойная вершина с ложными прорывами" формируется, когда максимальная цена правого плеча выше левого плеча. Паттерн "Двойное дно с ложными прорывам
FREE

This indicator displays volume delta (of either tick volume or real volume) encoded in a custom symbol, generated by special expert advisers, such as RenkoFromRealTicks . MetaTrader does not allow negative values in the volumes, this is why we need to encode deltas in a special way, and then use CustomVolumeDelta indicator to decode and display the deltas. This indicator is applicable only for custom instruments generated in appropriate way (with signed volumes encoded). It makes no sense to ap
FREE

Вам никогда не докучала ручная настройка уровней коррекции Фибоначчи? Вы задумывались об инструменте, который бы автоматически настраивал определенные уровни Фибоначчи под вашу торговлю? Тогда этот инструмент для вас: торгующий по сетке индикатор Fast Fibonacci Grid позволит вам быстро настроить уровни коррекции Фибоначчи и построить сетку Фибоначчи! Всего лишь несколькими кликами вы сможете настроить свою сеточную торговлю на основе этих уровней. Изменяемая графика, размеры шрифтов и графически
FREE

The initial balance (IB) is a range in which the price spent its first two OPT periods after the opening. In other words, the opening balance is a range of the first hour after the market opened. The opening balance arose from room trading, as room traders observed the various ranges after the market opened.
This indicator allows you to enter the starting and ending hours and minutes of a specific hourly time range so that the trader can set up different IBs according to the market.
Autom
FREE

After purchasing, you can request and receive any two of my products for free!
После покупки вы можете запросить и получить два любых моих продукта бесплатно! Советник для ручной и автоматической торговли по трендовым линиям индикатора Bollinger Bands. Советник рисует трендовые линии от средней полосы по заданному числу свечей. Важно!!! - проводить тестирование советника нужно в визуальном режиме. Возможно вас заинтересуют другие мои продукты: https://www.mql5.com/ru/users/vypchela/seller
FREE

Коробка Ганна (или Квадрат Ганна) — метод анализа рынка по статье Уильяма Ганна «Математическая формула для предсказания рынка» (W.D. Gann "Mathematical formula for market predictions"). Этот индикатор может строить три модели Квадратов: 90, 52(104), 144. Шесть вариантов сеток и два варианта дуг. Вы можете построить, одновременно, несколько квадратов на одном графике.
Параметры Square — выбор модели квадрата: 90 — квадрат 90 (или квадрат девяти); 52 (104) — квадрат 52 (или 104); 144 — универс
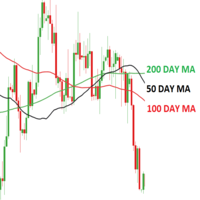
Работа с Buy stop и Sell stop отложенными ордерами. Канал из двух индикаторов iMA (Moving Average, MA).
Входные параметры Take Profit - тейк профит; Trailing Stop - трейлинг; Trailing Step - шаг трейлинга; Lots - размер лота задается вручную (при этом ОБЯЗАТЕЛЬНОЕ УСЛОВИЕ: параметр Risk должен быть равен нулю!); Risk - размер лота рассчитывается автоматически, в процентах риска на сделку (при этом ОБЯЗАТЕЛЬНОЕ УСЛОВИЕ: параметр "Lots" должен быть равен нулю!); Difference - отст
FREE

For those who hate candlesticks in lower timeframes (M1 through M15) we "invented" a clean new way to follow Price movement and displacement (volatility) called Price Trail Chart . The big "secret" is to get rid of those annoying candle wicks and draw the whole complete candle without them, this way we get a cleaner chart and a new view of the Price Path. No Open or Close markings, just LOW's and HIGH's, full body candle.
Additionaly we inserted a Volume monitor from our Best Downloaded indicat
FREE

You can use this tool to create as many pending orders (limit order) as you want in one button press. All inputs must be in points. You can use this useful tool when such as FED speech times. User Inputs:
MagicNumber = Magic number DeviationPoint = Deviation point number for limit orders Level = You can choise how many level do you want to create pending orders. BuyOrder = true/false SellOrder = true/false StartDistance = Distance between each level. StepDistance = Distance to be added incremen
FREE

нестандартный подход к стандартному индикатору скользящей средней. суть индикатора состоит в определение силы и быстроты направление цены определением угла наклона скользящей средней. берется точка на пятнадцатой свечи MA и точка на последней закрытой свече MA, между ними проводится прямая линия, она подвижна и на полусфере показывает угол наклона от 90 градусов до -90. выше 30 градусов зона покупок, ниже -30 градусов зона продаж. выше 60 градусов зона сильных покупок ниже -60 сильных продаж. ин

Unlock the Power of Market Analysis with Precision Are you ready to take your trading to the next level? The "Institutional Volume Profile" indicator is here to empower your trading decisions like never before. Key Features: Custom Volume Profiles : Plot volume profiles effortlessly by simply adding horizontal lines or Fibonacci tools on your MetaTrader 5 chart. There's no limit to how many profiles you can create. Insightful Visualization : The indicator beautifully displays crucial information

Отличная панель для аналитики рынка. Панель помогает анализировать значения индикатора MACD и его сигналы.
С помощью данной панели вы сможете: смотреть текущий сигнал с MACD по всем таймфреймам; смотреть текущий сигнал с MACD по разным символам; смотреть текущее значение MACD (главная и сигнальная линия); смотреть расстояние между главной и сигнальной линией; несколько типов сигналов для аналитики.
Значения в ячейке таблицы: значение Macd главная линия; значение Macd сигнальна

The GJ_H1_220100009_S_HD_CF_SQX_SL20 is an algorithmic trading strategy for MetaTrader, tested on GBPJPY using the H1 timeframe from April 1, 2004, to April 24, 2024. There is no need to set up parameters, all settings are already optimized and fine-tuned.
Recommended broker RoboForex because of EET timezone.
You can find the strategy source code for StrategyQuant at the link: http://quantmonitor.net/listing/gbpjpy-macd-trader/
Key details are:
Parameters
MagicNumber: 220100009
M
FREE

Q市价做空,W市价做多,E市价全部平仓。 持仓最大数量为1,即:禁止加仓。 ea的输入为手数,止损和最大滑点,不支持设置止盈。 专为短线吃一个小波段设计。 无论下单还是止损都会有提示声。 Q W E sell buy close
The Q key is short, the W key is long, and the E key is closed. The maximum number of positions is 1, i.e., it is forbidden to add positions. The EA's inputs are lots, stop loss and maximum slippage, and take profit is not supported. Designed for short-term swing trader. Play sound whenever position open or stoploss.
FREE

Introducing TRAD-E- LITE : Your Ultimate Trading Assistant! Are you tired of manually analysing the markets and executing trades? TRAD-E- LITE is here to assist you! Developed by Gold Lion XI, this expert adviser utilizes advanced algorithms to identify profitable trading opportunities and execute trades automatically, saving you time and effort. Key Features: Trading Time Management: Take control of your trading schedule. With TRAD-E- LITE , you can define specific trading hours based on your p
FREE

Versión Beta El indicador técnico Non Lag MA MTF (Non-Lagged Moving Average Multi-Time Frame) es una versión avanzada del Non Lag MA que permite visualizar la media móvil en varios marcos temporales simultáneamente. Pros: - Visión integral: Proporciona una visión más completa al mostrar la media móvil en diferentes marcos temporales en un solo gráfico. - Anticipación de tendencias: Ayuda a anticipar cambios de tendencia al observar la convergencia o divergencia de las medias móviles en distint
FREE

Detect divergence (classic, hidden) price and all oscillator indicator include: RSI, CCI, MACD, OSMA, Stochastic, Momentum, Awesome Oscillator (AO), Accelerator Oscillator (AC), Williams Percent Range (WPR), Relative Vigor Index (RVI), Rate of Change (ROC). Confirm reversal with dochian channel for to improve signal quality. Divergence is when the price of an asset is moving in the opposite direction of a technical indicator , such as an oscillator, or is moving contrary to other data. Diverge

Trade Aide is an MT5 utility to help Forex traders easily open their trades, calculate the correct position size, automatically manage open positions, or limit daily losses. All of this using just a few clicks or keys. The overall purpose of Trade Aide is to allow you, the trader, to solely focus on your technical analysis and setups , instead of worrying about calculations, setting the Stop Loss to Break Even, or any other trade management activities.
How does Trade Aide?
If you norma
FREE

Script to load history of a symbol on determined timeframe (default M1).
It is extracted from the MQL5 documentation:
https://www.mql5.com/en/docs/series/timeseries_access
Adapted by Renato Fiche Junior #melhoresferramentas #renato #larissasihle #aguiatraders
Parâmetros de Entrada
- Start datetime : the initial datetime from the history will be loaded - Timeframe to be loaded: period that will be loaded
FREE

The EA supports closing orders based on the preset amount. It can close all orders on all pairs, or it can close orders based on Magic ID. Button "Close All" manual Input - Magic Number: Magic Number = 0: Close All pairs Magic Number diffrent 0: Close All with Magic - Money TP: Profitable in money. the EA will close all orders - Money SL: Loss in money. the EA will close all orders Contact: t.me/nguyenvanbo128
FREE

The Martinware Manual Trading Helper indicator is aimed at helping people start their lives in manual trading. It can be used to display both some generic images at the right side of the graph, where custom operational remarks may be displayed or just a blank rectangle hiding the chart while backtesting. Moreover, it can periodically play a list of sounds. To show a blank rectangle, let the first image name input field empty and select the desired color. To show one or more custom images inste
FREE

This indicator demonstrates the probable dynamic support and resistance levels of EMA, Ichimoku lines, and Key OHLC levels for different timeframes on one chart. This can drastically reduce the time and effort needed for switching between different timeframes.
EMA and Ichimoku Levels are drawn for the M1, M5, M15, M30, H1, H4, and D1 timeframes, and the Key OHLC levels of the last periods are drawn for the H4, D1, W1, and MN1 timeframes.
FREE

Candle size oscillator is an easy to use tool to figure out candle size from highest to lowest price of each candle. It's a powerful tool for price action analysts specifically for those who works intraday charts and also a perfect tool for short term swing traders. Kindly note that you can also edit the Bullish and Bearish candles with different colors.
#Tags: Candle size, oscillator, price action, price range, high to low, candle ticks _________________________________________________________
FREE

This is a customizable three moving averages indicator useful in crossover trading technique. Yo can set various parameters such as calculation methods (exponential, simple, etc.), period and price type for each MA separately from one input dialog.
Parameters: Period <1,2,3> - Period of a moving average Shift <1,2,3> - Shift of a moving average Method <1,2,3> - Method of calculation for each moving average set separately Applied Price <1,2,3> - Set price type for calculations for each movi
FREE

ATR MTF indicator means ATR in ALL TIME FRAMES
By running this indicator, you can see the current ATR number of all time frames on your chart, and you do not need to change the time frame .
The main ATR indicator of MetaTrader is not required anymore because by ATR MTF all your requirements to the average of the true range are solved and all ATR numbers will be shown in the optional position of the screen .
This indicator is published for free and it is forbidden to sell it to others.
I
FREE

Простые индикаторы для MT5
Очень простой инструмент, облегчающий визуализацию индикаторов. Особенно полезно, если контрольный индикатор очень тонкий или его трудно прочитать.
В этом блоге вы можете прочитать о различных типах поддерживаемых индикаторов (индикаторы с цветовым буфером недоступны): Пересечение нулевой линии Две линии пересекаются Активация буфера Нулевая линия пересекается с фильтром Кроссы с ценой (MAs) Кресты внутри фильтра
FREE

Key Features: Robust Algorithm: Based on John F. Ehlers’ renowned Fisher Transform formula, our indicator excels in pinpointing major price shifts, facilitating more informed trading decisions. Versatile Application: Works seamlessly with any asset, including forex, stocks, commodities, and indices, offering wide-ranging applicability for diverse trading strategies. Customizable Settings: Tailor the indicator to your trading style with adjustable parameters, including the transformation length,
FREE

Утилита MTI (Main Trading Info) – показывает основную торговую информацию для трейдера, а именно: средний и текущий размер Cпреда размер Swapа для коротких и длинных позиций Стоимость 1 пункта для 1 торгового лота размер Stop Level (минимальное расстояние для выставления отложенных ордеров) Время до окончания текущей (красный цвет) и время до начала следующей (серый цвет) торговой сессии Красным выводиться время до окончания текущей торговой сессии, серым время до открытия следующей сессии. Цве
FREE
MetaTrader Маркет - торговые роботы и технические индикаторы для трейдеров, доступные прямо в терминале.
Платежная система MQL5.community разработана для сервисов платформы MetaTrader и автоматически доступна всем зарегистрированным пользователям сайта MQL5.com. Ввод и вывод денежных средств возможен с помощью WebMoney, PayPal и банковских карт.
Вы упускаете торговые возможности:
- Бесплатные приложения для трейдинга
- 8 000+ сигналов для копирования
- Экономические новости для анализа финансовых рынков
Регистрация
Вход
Если у вас нет учетной записи, зарегистрируйтесь
Для авторизации и пользования сайтом MQL5.com необходимо разрешить использование файлов Сookie.
Пожалуйста, включите в вашем браузере данную настройку, иначе вы не сможете авторизоваться.