YouTubeにあるマーケットチュートリアルビデオをご覧ください
ロボットや指標を購入する
仮想ホスティングで
EAを実行
EAを実行
ロボットや指標を購入前にテストする
マーケットで収入を得る
販売のためにプロダクトをプレゼンテーションする方法
MetaTrader 5のためのエキスパートアドバイザーとインディケータ - 40

Volume Weighted Average Price (VWAP) is a trading benchmark commonly used by Big Players that gives the average price a Symbol has traded throughout the day. It is based on both Volume and price. Additionally we put in this indicator the MVWAP (Moving Volume Weighted Average Price). For those who do not know the usage and the importance od this indicator I recommend a great article about this subject at Investopedia ( https://www.investopedia.com/articles/trading/11/trading-with-vwap-mvwap.asp
FREE

The "Moving Average Range Painter" is a robust MetaTrader 5 (MT5) indicator meticulously crafted to illustrate the fluctuating range between an exponential moving average (EMA) and a simple moving average (SMA) on any financial chart. This tool offers traders a comprehensive visual depiction of the price range within which an asset is oscillating. Here's a succinct interpretation of what this range signifies for technical analysis: Trend Dynamics : The range delineated by the EMA and SMA unveils
FREE

Displays multiple indicators, across multiple timeframes and symbols to give a comprehensive overview of the market. Uniquely, the indicators are configurable and can include custom indicators, even those where you just have the ex4 file or those purchased from Market. Standard indicators can also be selected, the default being ADX, CCI, market price above/below Moving Average (MA), Moving Average Cross (MAX), MACD, Momentum (MOM), OsMA, RSI, Parabolic SAR, William's Percentage Range (WPR). Use

Introducing our advanced Expert Advisor (EA) meticulously crafted to navigate the forex market using two prominent technical indicators: Moving Average Convergence Divergence (MACD) and Relative Strength Index (RSI). MACD is a versatile trend-following momentum indicator that highlights changes in strength, direction, momentum, and duration of a trend. Meanwhile, RSI is a popular oscillator that gauges the speed and change of price movements, identifying potential overbought or oversold conditio
FREE

Daily pivot are relatively important in trading.
This indicator have options to select 5 commonly use pivot point calculations.
User input Choose Pivot Point Calculation (Method Classic, Method Camarilla, Method TomDeMark, Method Fibonacci or Method Woodies.) Choose Applied Timeframe for the calculation (M5, M15, H1, H4, D1, W1 etc) Can be attached to any timeframe Choose color of Pivot point Note:
For MT4, please refer here : https://www.mql5.com/en/market/product/22280
FREE

The MA Bounce Strategy is a strategy that seeks to long FX pairs on a strong uptrend as they bounce off their MA support and shorting FX pairs on a strong downtrend as they bounce off MA resistance. The best suitable periods of moving averages for that strategy are 18, 30, 50. This indicator helps to identify and find place for potential market entry by MA bounce strategy. More information about MA Bounce Strategy can be read by this link https://www.mql5.com/en/blogs/post/743037 . By defau

The JP_15_861542546_S_BB_CF_SQX is an algorithmic trading strategy for MetaTrader, tested on JP using the M15 timeframe from December 7, 2017, to June 2, 2023. There is no need to set up parameters, all settings are already optimized and fine-tuned.
Recommended broker RoboForex because of EET timezone.
You can find the strategy source code for StrategyQuant at the link: http://quantmonitor.net/listing/nikkei-breakout-zones/
Key details are:
MagicNumber: 861542546 Main Chart: Curren
FREE
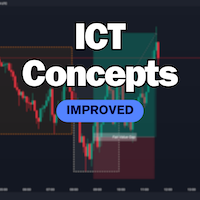
Introducing our ICT Trading Bot for MT5 A sophisticated solution designed to automate your trading.
During the ASIA session, the bot identifies a customizable price range, allowing for strategic adjustments. Post-ASIA, it patiently awaits a liquidity grab above or below the established range. A key feature is the detection of a significant fair value gap candle in the opposite direction of the grab, its size measured against the ATR value. Subsequently, a limit order is strategically placed a

The VWAP Level indicator is a technical analysis tool that calculates the weighted average price for the traded volumes of a specific asset. The VWAP provides traders and investors with the average price of an asset over a specific time frame.
It is commonly used by investors to compare data on "passive" trading operations, such as pension funds and mutual funds, but also by traders who want to check if an asset has been bought or sold at a good market price.
To calculate the VWAP level we
FREE

The Keltner Channel is a volatility-based technical indicator composed of three separate lines. The middle line is an exponential moving average (EMA) of the price. Additional lines are placed above and below the EMA. The upper band is typically set two times the Average True Range (ATR) above the EMA, and the lower band is typically set two times the ATR below the EMA. The bands expand and contract as volatility (measured by ATR) expands and contracts. Since most price action will be encompasse
FREE

This indicator is a very simple indicator that draws candlesticks on a chart. However, it is possible to draw not only on the main chart but also on several sub-charts. In addition,it is possible to draw different symbols and timeframes from the main chart. features. 1. any symbols 2. any timeframes 3. two candle type(normal and heikin ashi) 4. many candle colors(intersection with ma_1) 5. pivot line (ver1.2) In case of positive candle, FULL : change color if low is over ma_1 PARTIAL :
FREE

The Expert Advisor identifies Doji candles on the chart and opens trades when they appear (if they meet the specified parameters). In addition, the EA can also trade with the Engulfing candles. It can display the candles it is trading on, it also shows how the signal candle is set up. The exact settings of the signal candles can be changed and optimized. Also, the Expert Advisor has settings for additional indicators for filtering trade entries and can analyze trading volumes, so that, for exam

This indicator converted from 5 min Buy and Sell Range Filter - guikroth version on TradingView Popularity of the Range Filter
The Range Filter is a very popular and effective indicator in its own right, with adjustments to the few simple settings it is possible to use the Range Filter for helping filter price movement, whether helping to determine trend direction or ranges, to timing breakout or even reversal entries. Its practical versatility makes it ideal for integrating it's signals into

QuantumAlert Stoch Navigator is a free indicator available for MT4/MT5 platforms, its work is to provide "alerts" when the market is inside "overbought and oversold" regions in the form of "buy or sell" signals. This indicator comes with many customization options mentioned in the parameter section below, user can customise these parameters as needful. Join our MQL5 group , where we share important news and updates. You are also welcome to join our private channel as well, contact me for the p
FREE

For more profit, please change Lots_Equity 100 to 500 / 1000 / 3000 / 5000 etc and change Risk_Percent in the input level. It's only good works on GBPUSD Daily Timeframe. This robot is profitable. Minimum deposit for default setup: $1000. You can get good results with it. You can test it first . It will increase the volume in a certain ratio as the equity increases. You don't need to increase the volume by yourself. Please contact me with any questions: https://www.mql5.com/en/users/abduljalil
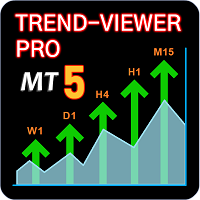
SEE THE TREND ON EVERY TIME FRAME. INTELLIGENT INDICATOR READS PRICE ACTION TO SPOT TRUE MARKET CYCLES AND TREND. This advanced multi-currency and multi-time frame indicator, reads trend in real-time so you always know the trends of the markets you want to trade.
Trend-Viewer Pro has been specifically designed to read the trend of every time frame and every market , simultaneously, making it much easier for you to find markets with time frame correlation , so you can focus on t

A Simple clock that on the left side "Time" shows r espectively the TimeCurrent, followed beneath by the TimeLocal. On the right hand side we have the remaining minutes and seconds of the current candle. TimeLocal is synced every 500 miliseconds however, the TimeCurrent and the time left on the candle are synced every tick, so this can lead to inconsistencies on the readings so keep that in mind.
This indicator have no plots or buffers so it cannot be used in any time based EA.
FREE

Purpose DG DayInfo is a free indicator that shows information about: Day's maximum prices; Day's minimum prices; Day's percentual variations; Daily candle direction (Up, Down or Flat); Candle timer; This way, DG DayInfo helps you to see day's maximum and minimum, check day's percentual variation and time left to close candle.
Key features Designed to be simple to use, with a few parameters Works in ALL pairs Works within ALL time frames*
Main Indicator Parameters Days - Set to how many days
FREE

*Non-Repainting Indicator Bruce Webb Explains How To Use Bruce's Price Predictor In Detail And Free Forex Strategy https://youtu.be/hfoB1tZZpTo Bruce's Price Predictor is an indicator that shows precise price reversals. A great arsenal to add to any chart. Bruce's Price Predictor points price reversals with high degree of accuracy and it is great for scalping on the 1min time frame, Or swing trading on the 1hr time frame. Buy and sell arrows are shown on the chart as for entry signals. They do

Kindly rate and comment about the product for upgradation & Support
The 5 EMA is plotted in green color ( Lime ). The 14 EMA is plotted in red color ( Red ). The 20 EMA is plotted in blue color ( Blue ). The 200 EMA is plotted in black color ( Black ). The 200 EMA is plotted in yellow color ( Yellow ).
The Quarter EMA that provided calculates and plots four Exponential Moving Averages (EMAs) on the chart using different periods: 5, 14, 20, and 200. Each EMA
FREE

Functional in the Forex market. Functional on the B3 market - Bolsa Brasil Balcão. Motivation The Price Guide indicator is a tool that helps you insert support and resistance points at the chosen price and in the quantity you want, it depends on the agility of its configuration. This DEMO version will work on the Meta Trader 5 Demo account and Strategy Tester. Get the Full version that works with a Real account click: https://www.mql5.com/pt/market/product/111897 Operation The methodology publi
FREE
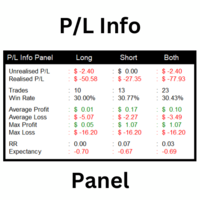
This utility shows various types of information on chart, controlled by many filters and option for each of them. If you want any custom feature or want to remove something from this product for your personal use. Please send me a personal message, I'll be happy to do so for you. Inputs and features explained: BG Color - Background color of the Dashboard
Text Color - Color of text info on the Dashboard
Border Color - Color of Border of the Dashboard Set Color on +/- Text - True/False option
FREE
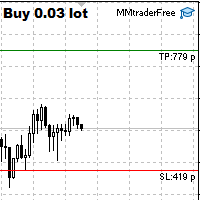
This tool is designed to quickly calculate the lot depending on the Stop Loss.
The control is done by hot keys
By default:
1 - Limit order price level
2 - Stop Loss Level
3 - Take Profit Level
Space Bar - Open an order
Escape - Cancel All 9 - Open 2 orders
Market Order
To open a Market order, click (2) and set up Stop Loss with the mouse If you want to put Take Profit - click (3) and set up Take Profit with the mouse
FREE

Trade Receiver Free is a free tool to copy trades/signals from multiple MT4/MT5 accounts. The provider account must use copier EA to send the signal. This version can be used on MT5 accounts only. For MT4 accounts, you must use Trade Receiver Free . Reference: - For MT4 receiver, please download Trade Receiver Free .
- For MT5 receiver, please download Trade Receiver Free MT5 .
- For cTrader receiver, please download Trade Receiver Free cTrader .
- If you only need copy from MT4 accoun
FREE

Several assets in several markets have the behavior of using specific numbers as Force Numbers, where support, resistance and price thrust is created. Let this indicator draw those levels of support and resistance for you. You can also stack it to show different level of Prices! This technique is being used by Tape Readers and Order Flow traders all over the world for a long time. Give it a try. Challenge yourself to study new ways of Price Action!
SETTINGS
What Price reference to use in th
FREE
EA は、長い期間の MA からの衝動的なバウンスが完了した後、価格が平均に戻ったときに取引します。必要に応じて平均化を使用できます。高度なパネルとすべての種類の通知があります。 問題解決→ こちら / MT4版→ こちら 利点: バスケット注文の高度なフィルタリング
手動注文を追加できる完全自動取引システム
簡単なセットアップと直感的なパネル インターフェイス
強力な取引の可能性と簡単なセットアップ
内蔵オートロット
入力設定: . Main settings Size_of_the_first_order - 最初の注文を開くためのボリューム。 Enable Autolot 計算が無効になっている場合に使用されます。 Enable_Autolot_calculation - オートロットを有効にします。オートロットを使用する場合、最初の注文のサイズは使用できません。初回注文時に使用。 Autolot_deposit_per_0.01 ロット - オートロット使用時の 0.01 ごとのデポジット額 Orders_Magic_number - アドバイザの注文の主な

Indicador Multiple Regression Indicador faz o plot da Curva de Retorno e dos canais superior e inferior de uma regressão para os preços de fechamento do ativo do gráfico. A Curva de Retorno é a linha central do indicador e representa a região de equilíbrio do preço entre vendedores e compradores. Nesse indicador o usuário escolhe o tipo da regressão podendo ser de 3 tipos: primeiro grau, segundo grau ou terceiro grau. Os plots do indicador são: Linha central – cor padrão preta; Linha superi
FREE

の指標に基づく指標を内蔵標準指標の指標を考慮し、電流指標の30の指標 そして、他の指標のすべての傾向の一般的な傾向を売買するための信号を与えます。 入力パラメータでは、各区分に特別なパラメータを設定できます。 インジケータはオシレータの形で実行され、すべてのインジケータの一般的な傾向と優位性を一方または他方の方向に示します。 https://youtu.be/UG2ZZEH9B_U
の指標に基づく指標を内蔵標準指標の指標を考慮し、電流指標の30の指標 そして、他の指標のすべての傾向の一般的な傾向を売買するための信号を与えます。 入力パラメータでは、各区分に特別なパラメータを設定できます。 インジケータはオシレータの形で実行され、すべてのインジケータの一般的な傾向と優位性を一方または他方の方向に示します。
FREE

CANDLESTICK_MT5
A very interesting indicator of candlestick patterns, converted from the free version of the CANDLESTICK indicator for the MetaTrader4 terminal to the version for the MetaTrader5 terminal. In addition to candlestick patterns, it draws support and resistance lines, which are perfectly worked out by the price on the chart. It can work on any timeframe. Has simple settings. When converting, the logic of work and the design of the original CANDLESTICK indicator for the MT4 termina
FREE
Protect My Trades is an EA (expert advisor bot) that automatically put stop loss and take profit on market trades and pending orders. You can specify if want it to do this only on actual symbol trades or in all others. Its configuration is very simple. Functions: Take profit: distance to TP (0 = disabled, no TP will be created).
Stop loss: distance to SL (0 = disabled, no SL will be created).
Price type: price type in pips or pipets/points (pips is common in Forex).
Actual symbol only: manage
FREE

After purchasing, you can request and receive any two of my products for free!
После покупки вы можете запросить и получить два любых моих продукта бесплатно! The EA is based on and uses the signals of standard trend indicators. The algorithm does not use dangerous trading methods - martingale, grid and averaging, it always uses only a fixed stop loss and a built-in trailing stop. By default, the currency pair is XAUUSD, M5, M15 (it is possible to optimize for other currency pairs, and with a
FREE

Seeing and interpreting a sequence of Candlesticks is easy to spot when you are a human... Higher Highs, Higher Lows, are the panorama of a Buying trend, at least in a short period of time... Seeing a current candlestick higher high and a lower candlestick low, as a human, you can immediately spot a "divergence", an "alert", a "starting range", but in the end and based on other analysis a human trader can understand and behave accordingly to this kind of candlestick data... But what about EAs (r
FREE
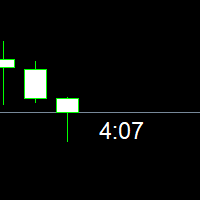
Contador de tempo que iniciará outro candle. Este indicador conta o tempo que falta para terminal um candle e iniciar outro, funciona em qualquer tempo gráfico. Em seus parametros de configurações permite alterar o tamanho e a cor da fonte da letra. Gratis para teste por 15 dias. Contador de tempo do candle. Permite alterar o tamanho e a cor da letra. Após baixar o contador de tempo de candle Flash arraste para o gráfico, configure o tamanho da fonte desejado e as cores preferidas.
FREE

This is an indicator that shows total pips ,order counts and the total profit accumulated for the open orders of the pair attached. The colors change depending on if the total profit is positive , negative or zero. Contact:
If you have some questions or if you need help, kindly contact me via Private Message. Author: A.L.I, fintech software engineer and a passionate forex trader.
FREE

This EA is a robot based on two EMAs and an standard MACD. No martingale or grid strategies. All positions have their own stop-losses. Trading strategy: This robot uses fast and slow EMAs to check the trend of the currency, once the trend is known, the standard MACD will trigger the correct order. Placing the best take profit and stop loss depending on the strengh of the trend. The Expert Advisor is designed for best performance in EURUSD currency pair at a 15m timeframe. Both slow EMA and fast
FREE
Indices Scalper EA provides functions: Start Trading, End Trading, Сlose Order(Time), Pending Order Placement (Time), Tralling stop (automatically according to strategy), trading can be switched off, daily range (strategy), stop loss per day (risk management), Stop loss (risk management), take profit (money management), tracking stop and tracking step (strategy), Risk per order (risk management) and much more! Through a newly developed stop system and with an algorithm never known before, Indic
FREE

Expected Range is a great tool for understanding the possible price deviation from daily open price.
This Indicator can be interpreted as follows --> I want to identify a price level with an "x%" probability of the price revisiting it.
Then you choose these "x%" price levels and the indicator is gonna find them for you.
So for example, if you select value of 15, it means that the indicator is gonna find you a price level which has a 15% chance of price revisiting it.
You can choose up
FREE

What is the Volume Weighted Average Price (VWAP)? The volume weighted average price (VWAP) is a trading benchmark used by traders that gives the average price an instrument has traded at throughout the day, based on both volume and price. It is important because it provides traders with insight into both the trend and value of the instrument.
What is the Difference between VWAP and AVWAP? While VWAP is having as starting point the beggining of the day,week,month etc. in the AVWAP you can p

Quantum Lion MT5 is a very profitable expert advisor for trading US30, BRENT OIL and EURSGD that uses a proprietary indicator "Quantum Lion" bult-in. Please download and test it against any top ea from the mql5 Marketplace. I think you will find Quantum Lion to be more stable and have less drawdown than most other ea. This powerful Expert Advisor can make regular profit every week with low drawdown while you sleep. No martingale is use, just grid trades! The starting lot size is 0.01 and it

For those Price Action traders who love to trade strong Price points, like yesterday's HIGH and LOW, here is an indicator to ease the identification of those values, drawn directly on your chart! MIN/MAX of the Day will automatically draw 2 lines showing you those points for you, AND, if you like any HIGH and LOW in the past, not just yesterday's prices. It can also be configured to additionally show today's HIGH and LOW prices - just configure the refresh rate of those lines at your own taste/s
FREE

Moving Average 4 TimeFrames
Display 4 moving averages of 4 different timeframes on the same chart. In order not to pollute the chart, the indicator will plot the complete average only in the current timeframe of one of the 4 registered averages, for the other timeframes of registered averages the indicator only displays a part of the average so that you know where it is at that time graphic.
Example:
Display on the 5-minute chart where the 200-period arithmetic moving average of the 5 min
FREE

High of the Day and Low of the day Time and Price Fractal Studies is an indicator that will help you identify certain patterns that tend to repeat themseleves at certail times of the day or at certain prices.
It is used to study Daily Highs ad Lows in relation to time and price.
You will get to answer certail questions like:
At what time of day does this market usually turn around. At what price does the market turn. Is it at round numbers etc
FREE

Simple Calendar Events is an indicator that will mark important Important Economy Events on your chart. For example, if you are trading something that is USD based, you would like to know when some important events are coming, you can expect some volatility or some different Price action, so you can base your strategy on it. If you trade something that is country based you can also choose that, and it will show you when the event is, so you can be prepared for it. When you hover with the mouse
FREE

Totally linked to the result of a movement and the duration he had. Its height records how many ticks the asset walked during a given movement, its width shows us the duration that movement had. Its configuration must be in line with the Weis Wave Indicator configuration to observe the movement force and can indicate a possible accumulation or distribution of the movement;
FREE
Recommendations: Currency pair: EURUSD Timeframe: H1 Minimum deposit : $1000
Account type: ECN or Raw with very low spreads. Brokers : IC Markets with ECN or Raw accounts for lowest spreads IMPORTANT: It is very important to use LOW SPREAD accounts for best results ! Account type: Hedge Specifications:
Trade EURUSD Every trade is protected with 30 pips SL Exit strategy incorporates a trailing stop using a H1 Chart Orders can be closed using profit harnessed by the winning orders. Au
FREE

This Ea works on the USD CAD currency pair with M15 chart. It is not a martingale or even a grid. It works with TP and SL. It uses RSI and Bollinger Band to open Long and Short positions.
It must be tested and the correct parameter settings found before using it.
Beware that past gains do not guarantee future gains. This is not inducement to invest, beware that with forex tradign you can also lose all your capital. Money management is very important.
FREE

This particular moving average adjusts to the average number of highest highs and lowest lows recorded over a defined period, thereby accommodating changes in trend strength. Utilizing this moving average in a crossover system or as dynamic support/resistance can yield compelling outcomes. Configuration: Length: Determines the indicator's period, with larger values delivering smoother outcomes. Application: The Dynamic Trend Adaptive Moving Average functions akin to conventional moving averages,
FREE

1. The Expert Adviser is built with a basic, simple and stable breakout trading strategy with a touch of Price Action pattern that is highly effective with over 80% accurate entry on Scalping and Trend following trading pattern. 2. The EA created a good money management system with a low draw down and options for Number of Trades, Auto SL and Auto trade trailing.... 3. The EA has option to select trade direction (BUY ONLY, SELL ONLY OR BUY & SELL). 4. The EA has option to set TP in Pips or Mone
FREE

A big thank you for your interest in our product. MustForex Bollinger Bands V1 Premium Expert advisor
Its follows a determined Swing strategy. It trades by following and analysing Bollinger Bands indicator to determine entry and exit point. Profits can be locked by the adjustable trailing stop/Break Even inputs. Every trade protected with dynamic auto stop loss and dynamic auto take profit to protect your account. Since the strategy works with quick swing trade profits it is highly s
FREE
Counterattack EA is a fully automatic Grid Expert Advisor for Trend Scalping Trading on XAUUSD timeframe M1 but also in others.
Recommendations The Expert is programmed to work on XAUUSD M1, but you can use all others timeframes also. An ECN broker is always recommended A low latency VPS is always recommended. The recommended Leverage is 1:100 or more. The recommended capital is 10000 ($/cent) per 0.01 Lots or more. For higher Lots please test by yourself Please test Demo before you
FREE
The Big Mac B MQL5 expert advisor is a based off a Bollinger breakout strategy. The MACD indicator is used to confirm either a buy or sell trend. The MFI indicator to act as a trading range to ensure that the buy or sell is not activated when the price is in an overbought or oversold condition.
Trades will only be entered if the current price is within the trading range of the MFI indicator. Default settings are for the USDJPY on the 5 minute time-frame.
To work with the news server, you must
FREE
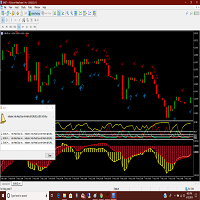
Adx and Macd are powerful indicators which can warn you of a change of direction. Put them together with this great indicator that will warn you of impending changes long before any ma lines cross. More screen shots on the MT4 version. Arrow indicates a solid macd cross and the check marks show the adx movements. You can trade the long term with the macd crosse and scalp the adx changes while you hold the main trend. Thanks for checking out my indicators.

NakaSideをご紹介します - あなたの究極の市場機会指標!
利益の出る取引の機会を見逃すことにうんざりしていますか?取引を次のレベルに引き上げる準備はできていますか?もう探す必要はありません。NakaSideが登場し、取引方法を革命へと導きます!
NakaSideは単なる一般的な指標ではありません。複雑な金融市場を自信を持ってかつ正確に航海するための秘密兵器です。高度なアルゴリズムと先進的なテクノロジーを駆使して、NakaSideは上昇トレンドと下降トレンドの両方でトレンドの変化を検出し、利益の出る機会を見つけるように設計されています。
NakaSideが上昇トレンドの変化を検出すると、鮮やかな緑色のドル記号が表示され、購入の機会があることを示します。逆に、トレンドが反転すると、目立つ赤いドル記号が表示され、売却の機会があることを示します。
しかし、ここでNakaSideが本当に際立つのは、トレンドの特定に留まらないところです。他の人が苦労する横ばい市場では、NakaSideが光を放ち、チャート全体に複数のドル記号を散りばめ、多数の潜在的なエントリーポイントを示

流動性と移動平均に依存する指標>これにより、正しい意思決定の98%が売買されます。そして取引を閉じる時間。 価格は時々上昇します>そして最初のEAがいつ起動するかはこの指標に依存して2k以上になります。 1-いつ買いポジションまたは売りポジションをオープンするか(2本の線Xのクロスに依存し、ポイント計算は選択したフレームに依存します) (十字架は色付きの領域の外側にある必要があります)ろうそくは十字架の間または(1番目または2番目から5番目まで)十字架に触れなければなりません 十字架の下で最後の状態が直接確認されたときにカウントされたポイント(スクリーンショット付きの表を参照してください。プラスツールを使用して面積をカウントします) 2-次のエリアの外側の黄色い線の開始カーブがポジションを閉じるためのシグナルである場合 3-フレームで動作します(1m 5m 10m 15m 30m 1h 4h毎日および毎月)(すべてのペア>およびすべての商品)メジャー推奨 4-ゲインの..(55%)を獲得した後にトレイルストップを置く 5-1000 $スタックの取引ごとに推奨ロット0.01 異なるペア

範囲の枯渇は、価格が現在の期間の予想される範囲を満たすか超えると発生します。これらのレベルでは、価格は期間の初期に比べて勢いを失い始めるため、新しいポジションをとっていないことを確認するのに良いポイントです. このインジケーターは、チャート上でこれが発生する可能性が高い場所を示し、日次、週次、月次の期間のレベルを示します。 価格がこれらの枯渇レベルを超えている場合は、動きの背後にある勢いが非常に強く、より高い時間枠レベルに向かっている可能性が高いことを示しています. インジケーターは、好みに応じて、Average True Range (ATR) または Average Range (ADR) 計算を使用できます。デフォルトでは、外国為替チャートでよりうまく機能することがわかっているため、ATR を使用しますが、ADR は株式ベースのインデックスとシンボルで優位に立っています。 インジケーターには、以下で説明するいくつかの描画モードがあり、ニーズに合わせて調整できます。
設定
計算モード レベルの計算には、AverageTrueRange (ATR) または AverageDai

This indicator provides the ability to recognize the SMC pattern, essentially a condensed version of the Wyckoff model. Once the pattern is confirmed by RTO, it represents a significant investment opportunity. There are numerous indicators related to SMC beyond the market, but this is the first indicator to leverage patterns to identify specific actions of BigBoy to navigate the market. The SMC (Smart Money Concept) pattern is a market analysis method used to understand the behavior of "smart

Trend Fibonacci is a unique indicator that combines a power of Fibonacci sequences and ranges. Channel Group: Click Here
How to read:
- There are three zones --> red, gold and green
- Red candlestick = downtrend
- Green candlestick = uptrend
- Gold candlestick = no established trend
Inputs: Per = number of bars used for calculations FirstRatio = first Fibonacci ratio (Or use any ratio you want) SecondRatio = second Fibonacci ratio (Or use any ratio you want)
!! IF YOU PURCHASE TH
FREE

Draw Agent は、すべてのチャート分析、落書き、メモなどを作成および管理するための美しく革新的な方法として設計されています。 このツールは、チャート スペースを黒板として扱い、手で描くためのフリーハンド描画方法を提供します。 このフリーハンド描画ツールを使用すると、MT4/MT5 チャートに描画して、チャート上のイベントをマークまたは強調表示できます。 エリオット波動を手で下書きしたり、チャートに線を引いたり、チャートにアイデアを示したりしたい場合に 役立つツールです。クライアント向けのライブウェビナーを実行している場合、またはスクリーンショットやチャートファイルを人々に配布している場合に特に役立ちます同じように。 Draw Agent のインストールと入力ガイド EA追加URL( http://autofxhub.com )MT4/MT5端末(スクリーンショット参照) に関する通知を受け取りたい場合 。 MT4 バージョン https://www.mql5.com/en/market/product/14929 MT5 バージョン https://www.mql5.

The technical indicator Trend Strength Analyzer measures the deviation of the price of an instrument from average values over a specific period of time. A comparative analysis of the relative strength of bulls and bears underlies the indicator. If bulls prevail, an upward trend. If bears are stronger - a downward trend.
Settings:
Strike Energy (2 solid lines) = 14.
Influence Power (2 dotted lines) = 50. The TSA oscillator is effective in an active market. The most commonly used indica
FREE

MT5からTelegramに完全にカスタマイズ可能なシグナルを送信して、シグナルプロバイダーになりましょう!この製品は、使いやすく視覚的に魅力的なグラフィカルインターフェースで提供されています。設定をカスタマイズして、数分で製品を使用開始できます!
ユーザーガイド + デモ | MT4バージョン | Discordバージョン デモを試したい場合は、ユーザーガイドをご覧ください。 MT5からTelegramへの送信者は、ストラテジーテスターでは動作しません。
MT5からTelegramへの機能 多数のオプションを使用して、シグナルを完全にカスタマイズします シグナルの前後に独自のカスタムメッセージを追加します。これには、タグ、リンク、チャンネルなどが含まれます シグナル内の絵文字を追加、削除、カスタマイズします。また、すべて削除することもできます。 シンボルまたはマジックナンバーで送信する取引をフィルタリングします 特定のシンボルの送信を除外します 特定のマジックナンバーの送信を除外します シグナルと一緒に送信する取引の詳細をカスタマイズします シグナルと一緒にスクリーンショ
Is your trade at a loss? Does not matter ! You can use this Extra martingale tool. In the set loss of your trade or your EA's trade , this tool will open another trade at a better price. It can also open multiple trades at different distances and with different lot sizes. Each trade will be assigned a TakeProfit. This tool has a lot of settings. You can set variable lot sizes, variable trade distances, variable TakeProfit sizes, maximum total profit or loss in money. You can also close trades

Фрактальная дивергенция - это скрытая дивергенция, построенная на фракталах Билла Вильямса. Бычья фрактальная дивергенция представляет собой комбинацию из двух нижних фракталов, последний из которых расположен ниже предыдущего, и при этом две свечи справа от минимума последнего фрактала имеют минимумы выше уровня предыдущего фрактала (см. скриншот 1). Медвежья фрактальная дивергенция - это комбинация из двух соседних верхних фракталов, последний из которых расположен выше, чем предыдущий верхн
FREE

Alpha BOT is a professional automatic trading system designed and optimized for the MT5 platform and multi currency pair. The principle of operation is based on support and resistance, uses pullback of currency pairs and deep machine learning, the EA independently adjusts to market volatility. Tested in sample and in out of sample with positive results since 2010y.
Currency pair: AUDCAD,NZDCAD,AUDNZD.
Requirements: Leverage 1:30 or higher
Minimum deposit 500 USD, recomended 1000 USD (

This indicator is stand alone version from MP Pivot Levels (All in one) containing Demark's Pivots.
Calculations: PP = X / 4 R1 = X / 2 - LOWprev S1 = X / 2 - HIGHprev Uses: When the pair currency price may change the direction of movement. Possible constraints of support and resistance that creates plateaus for the currency pair prices. Tendency identification by comparing the present prices according to current day's pivot point and also the prior day's pivot points. ___________
FREE

このボラティリティインディケータは、死んだ市場を検出するのに便利です。ユーロのボラティリティーを測定するEVZ指数に基づいています(ただし、外国為替市場全体に適用することもできます)。高い値は、市場での高いボリューム/ボラティリティを表します。7以下の場合は、ボリュームが少なく、取引時のリスクが大きいことを示しています。 No Nonsense Forex(NNFX)手法を使用しているトレーダーにとって、このインジケーターはアルゴリズムのバックテストやEVZが与える影響を測定するのに役立ちますし、取引の際にチャートで直接読み取ることもできます。 このインジケーターが正しく動作するために必要なデータを取得するには、 EVZ Reader (無料)をダウンロードしてください。
特徴
このインディケータは、プログラム「EVZリーダー」によって取得されたデータを読み取るもので、このインディケータが動作するために必要なものです。このリーダーが1つのチャートで有効であれば、EVZはほぼリアルタイムで更新されます。 このインジケーターの複数のインスタンスを複数のチャートに配置しても、パフォーマ

Force Index に Average True Range (ATR) チャネルを追加することは、Kerry Lovvorn によって提案されていました。 これらのチャネルを追加すると、Force Index が中間のトップとボトムを識別するための優れたツールになります。 ATR チャネルを使用した Force Index はすべてのターンを捕捉するわけではありませんが、識別されたターンは非常に真剣な注目に値します。
注: Average True Range の「true」という言葉は、価格ギャップに対処することを指します。 Force Index にはギャップがないため、ここでは ATR は Average Range と同じになります。
フォース インデックスが 3-ATR チャネルを上回ったり下回ったりするたびに、ティッカーが持続不可能な極端な領域に到達したことを示します。 そこで上昇も下落も疲弊し、価格が反転する傾向にあります。 これは、上部領域と下部領域の両方を同等に効率的に呼び出すことができる数少ないツールの 1 つです。 エルダーディスクは、フォースイン

セミオートマーティンシステム
導入
このツールは半自動マーティン取引に使用され、パネルをクリックして注文すると、EAがポジションを管理します トランザクションの方向を決定し、残りはEA管理に任せてください 自動マーティン、設定されたグリッドに従って倉庫を追加し、この機能を無効にすることもできます ワンクリック清算 1つのキーロック機能 時間制御 警告音プロンプト
特性
トレーディングチャート:任意 取引可能な通貨:任意 自動テイクプロフィットクロージング バックテストに使用できます クリアパネルディスプレイ
パラメータ
主な設定パラメータ
LogLevel = LOG_LEVEL_INFO; //ログの書き込みレベル UseAutoMagic = true; //マジックナンバーを使用するかどうか MagicNumber = 6; //マジックナンバー0-2000を設定します ロット= 0.01; //初期取引量 UseMartin = true; // Martin関数を使用するかどうか ブースター= 1.7; //増加の倍数 NetGap = 10;

Hey Trader!
Boring with the Meta chart? Do you want to move it as you do in Profit?
Your problems are over! Now available Chart Panoramic or ChartPan for closer friends, a utility that allows you to move the chart to better visualize the most relevant points for your trade.
Recommend you to add a keyboard shortcut for quick access (Ctrl + Q - for example), because you will need to run ChartPan after symbol changing to "release" the chart again.
To add a hotkey: after downloa
FREE

Highly configurable Adx indicator.
Features: Highly customizable alert functions (at levels, crosses, direction changes via email, push, sound, popup) Multi timeframe ability Color customization (at levels, crosses, direction changes) Linear interpolation and histogram mode options Works on strategy tester in multi timeframe mode (at weekend without ticks also) Adjustable Levels Parameters:
ADX Timeframe: You can set the lower/higher timeframes for Adx. ADX Bar Shift: you can set the
FREE

This is a bufferless indicator which can display classical X and O columns if applied on custom symbol charts built by Point-And-Figure-like generator PointFigureKagiCharts or its DEMO . The indicator will enforce a fixed price-scale on the chart to make sure the marks keep correct aspect ratio. The marks are shown only if the chart time-scale is large enough to hold them in the space allocated per bar (if the horizontal scale is one of 3 smallest ones, the indicator draws nothing and outputs a
FREE
MetaTraderマーケットは、開発者がトレーディングアプリを販売するシンプルで便利なサイトです。
プロダクトを投稿するのをお手伝いし、マーケットのためにプロダクト記載を準備する方法を説明します。マーケットのすべてのアプリは暗号化によって守られ、購入者のコンピュータでしか動作しません。違法なコピーは不可能です。
取引の機会を逃しています。
- 無料取引アプリ
- 8千を超えるシグナルをコピー
- 金融ニュースで金融マーケットを探索
新規登録
ログイン