YouTubeにあるマーケットチュートリアルビデオをご覧ください
ロボットや指標を購入する
仮想ホスティングで
EAを実行
EAを実行
ロボットや指標を購入前にテストする
マーケットで収入を得る
販売のためにプロダクトをプレゼンテーションする方法
MetaTrader 5のためのエキスパートアドバイザーとインディケータ - 41

Cybertrade ATR Trend Zone - MT5 The indicator shows, by calculating the ATR (Average True Range), the zone of probable price resistance. Indicated to be used as a probable exit point of an operation.
It works on periods longer than the period visible on the chart. All values are available in the form of buffers to simplify possible automations. This indicator is the same one we use in our EA. Also check out our other products.
FREE
This indicator helps you monitor multiple currency pairs and timeframes all at once. It displays the occurrence of divergences between price and the MACD indicator in a clear and easy-to-read table. Monitoring multiple timeframes and currency pairs in one place helps traders identify a divergence without needing to switch between charts. Divergences can be bullish or bearish. For example, if the price forms a higher high while the MACD forms a lower high, this indicates bearish divergence. On th

Alligator Window Indicator : Potencialize suas análises no MetaTrader com o Alligator Window. Este indicador coloca o clássico Alligator de Bill Williams em uma janela separada, permitindo uma visualização mais clara e organizada. Ideal para traders que buscam precisão e eficiência em suas operações, o Alligator Window proporciona insights nítidos e facilita a identificação de tendências sem poluir o gráfico principal. Experimente agora e leve suas estratégias de trading a um novo patamar!
FREE

This EA uses two moving averages one slow and one fast, when ever they cross it checks if the RSI value is greater or lesser than 50 depending on the signal given by the Moving averages. After that it checks if the Stochastics lines are going up or down and not in the Over Bought or Over sold zone. so in total it uses an RSI, 2 Moving Averages ,Stochastics and an ATR to try to evade stop hunting.Also has a trailing function to hold the profits if price moves X pips tested on a 5 min time frame
FREE

This indicator is especially for the binary trading. Time frame is 1 minutes and exp time 5 or 3 minutes only. You must be use martingale 3 step. So you must put lots size is 10 % at most. You should use Mt2 trading platform to connect with my indicator to get more signal without human working. This indicator wining rate is over 80% but you may get 100% of profit by using martingale 3 step. You should use MT2 Trading Platform to connect meta trader platform and binary platform . You can get mt2
FREE
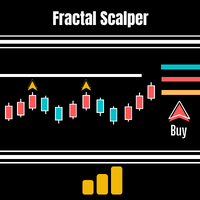
This trading method is inspired by Linda Bradford Raschkes 3 Little Indians pattern.
Put simply we anticipate price will approach a projected line that is based upon 2 previous fractals.
If 2 previous upper fractals occur we draw an upper line projected forward. If current price approaches this line we anticipate price will keep moving towards the line and breakthrough so we buy. If 2 previous lower fractals occur we draw a lower line projected forward. If current price approaches this
FREE
MT5 Terminal Copy for Copying MT5 Terminals This Expert Advisor (EA) allows you to copy trading activities between different MT5 terminals. It provides a simple and efficient solution for traders who want to duplicate positions or strategies in real-time across different accounts or devices. The EA can run on a main terminal and automatically replicate trades on other connected accounts. Ideal for copy trading or testing strategies on multiple accounts simultaneously. Main Features: Real-time C
FREE

The Expert Advisor for this Indicator can be found here: https://www.mql5.com/en/market/product/116472 Introducing the Rejection Candle MT5 Indicator, a robust tool designed to revolutionize your trading experience on the MetaTrader 5 platform. Built to pinpoint potential reversals with precision, this indicator offers unparalleled insights into market sentiment shifts, empowering traders to seize profitable opportunities with confidence. Key Features: Advanced Rejection Candle Detection: Uncov
FREE

Introducing the AI Keltner Channel , a cutting-edge Forex indicator that leverages machine learning to dynamically calculate Keltner Channels in real-time. Unlike traditional Keltner Channel indicators, which rely on static inputs, the AI Keltner Channel adapts continuously to ever-changing market conditions, providing traders with a more accurate and responsive view of price trends and volatility. Powered by advanced machine learning algorithms, the AI Keltner Channel analyzes historical and re
FREE
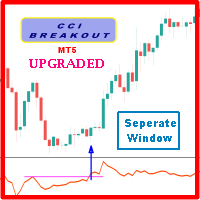
Probability emerges to record higher prices when Commodity Channel Index breaks out oscillator historical resistance level when exhibit overbought values. Since, oscillator breakout of support and resistance have similar effect as price breaks support and resistance levels, therefore, its highly advised to confirm price breakout with oscillator breakout; certainly, will have the same output in short trades. Concept is based on find swing levels which based on number of bars by each side of peak
FREE

Features
With MT5 to Interactive Brokers(IB) Trader, you can:
1. Load chart data from IB to MT5, and Analyze with all standard or customer Indicators.
2. Place Orders to IB Account Directly in MT5.
3. Make your Own EAs upon IB Securities by only making minus changes of the trading function. Usage
1) Installation
Copy the "Mt5ToIBTraderEn.ex4" and sample files to [MT5 Data Folder]->MQL5->Experts.
2) MT5 Settings
Add the IP Address to the MT5 Allowed URLs in 'Tools->Options->Expert Adviso

ET1 for MT5 is new and completely free!! ET1 for MT5 v4.20 Updated!! Now use on XAUUSD(Gold) !! The success rate is more than 75% !!!
important update: Merge ET9 's breakout strategy
Warning!! You can use ET1 completely free, but we do not guarantee ET1 stability, It is recommended that the more powerful ET9 for MT5 version includes the ET1 strategy and guarantees complete and stable returns.
The Best Expert Advisor on XAUUSD any timeframes ET9 for MT5 Updated v4.70 !! https://www
FREE

The Display N Bars utility is a simple tool designed to help identify candles.
If a trader tries to share knowledge with a colleague but it is difficult to pinpoint exactly the desired candle, just say the corresponding candle number.
The candle count is reset every day.
Seeking to offer a good customization the inputs are:
Display type -> Display only odd, only odd, or both candles?
Direction -> Horizontal or Vertical?
Display multiples of: (display frequency) -> Display all number
FREE

The "Rejection Block" MetaTrader 5 Indicator offers traders a comprehensive tool for identifying and visualizing rejection candlestick patterns, commonly known as rejection blocks. These patterns are pivotal in discerning potential market reversals or continuations, making them invaluable for traders seeking to enhance their analysis. Key Features: Rejection Block Detection: The indicator diligently scans price data, pinpointing instances of rejection candlestick patterns. These patterns typical
FREE

Introducing the Fair Value Gap Indicator : A Simple and Effective Trading Tool The Fair Value Gap Indicator is designed to help traders easily identify and utilize Fair Value Gaps (FVGs) in their trading strategies. FVGs highlight price imbalances that the market often revisits, offering potential trade entry or exit opportunities. Whether you're a beginner or an experienced trader, this indicator simplifies the process of spotting these valuable zones, allowing you to trade with clarity and co
FREE

This EA uses 3 custom indicators consisting of Gann HiLo, ADX, Heiken Ashi Indicator. Gann used angles and various geometric constructions to divide time and price into proportionate parts. Gann indicators are often used to predict areas of support and resistance, key tops and bottoms, and future price moves. Gann studies have been used by active traders for decades, and even though the futures and stock markets have changed considerably, they remain a popular method of analyzing an asset's dire
FREE
TradeSystem 取引する日にバーを選択します。このバーが閉じると、ロボットはろうそくの安値で2つの注文を送信し、もう1つはキャンセルされます StopLoss ストップは、買いの場合は安値より1ティック下、売りの場合は高値より1ティック上になります TakeProfit テイクはstopLossの範囲に必要な量を設定でき、戦略の最適化でコストをかけることができます 最適化 このロボットにはリスクリターンを取得するための入力があるため、メタトレードの戦略最適化で実行して、取引するシンボルの最適な入力を取得できます TradeSystem torihiki suru hi ni bā o sentaku shimasu. Kono bā ga tojiru to, robotto wa rōsoku no yasune de 2tsu no chūmon o sōshin shi, mō 1tsu wa kyanseru sa remasu StopLoss sutoppu wa,-gai no baai wa yasune yori 1 tikku-ka, uri no baai
FREE
HEDGING ACCOUNTS ONLY!!! Double Trouble RSI uses 2 Moving averages to define trend then opens trades based on RSI over bought or over sold conditions. It also has a time filter to define trading times. Default settings are for 5 minute timeframe. This EA is highly configurable and can be optimized to be used on most instruments and currencies, including DAX and S&P 500
The money management section is also highly configurable and does not make use of any risky strategies like martingale etc..
FREE

Indicator and Expert Adviser EA Available in the comments section of this product. Download with Indicator must have indicator installed for EA to work.
Mt5 indicator alerts for bollinger band and envelope extremes occurring at the same time. Buy signal alerts occur when A bullish candle has formed below both the lower bollinger band and the lower envelope Bar must open and close below both these indicators. Sell signal occur when A bear bar is formed above the upper bollinger band and upper
FREE

MACD Divergence Scanner is a multi-timeframe and multi-symbol dashboard and alert that checks all timeframes and symbols to find regular and hidden divergences between price chart and MACD indicator. This divergence scanner is integrated with support and resistance zones so you can check the MACD divergences in the most important areas of the chart to find trend reversals in the price chart. Download demo version (works on M4,M5,M6,M12,H3,H8 timeframes) Full description of scanner parameters

The Trading Sessions indicator is a simple tool that helps to highlight a specific trading session. For example, it can be used to differentiate the European, American or Asian sessions.
Main features The indicator shows a user-defined trading session. Alert notifications for the start and end of the session. Custom session time. Works on every timeframe (M1, M5, M15, M30, H1, H4, D1, W1, MN). Customizable parameters (Colors, alerts...). It can be used for creating EA. Available for MT4 an
FREE

As médias coiote automatizam a leitura de analise de médias rápidas e lentas no saldo do volume e preço. Quando as médias estão em modo compra, a coloração do candle fica azul.
Quando as médias estão em modo venda, a coloração do candle fica magenta. Quando a coloração fica verde ou vermelho, temos a tomada das médias no volume mas não no preço, quando isso ocorre é um sinal de atenção.
A concepção do indicador é ser utilizado para operações em saída de consolidações na direção da tendencia do
FREE

Stochastic indicator alerts when EA Available in comments , must have indicator installed buys stochastic main line is above signal line stochastic is below 30 rsi 5 is below 20 sell stochastic main line is below signal line stochastic is above 70 rsi 5 is above 80 ADD to chart Stochastic k 30 - d 9 - slowing 3, levels 30/70 rsi 5 lelels 20.80
Full alerts push, mobile , email ect All input settings variable feel free to contact for more information or alert sugestions
FREE
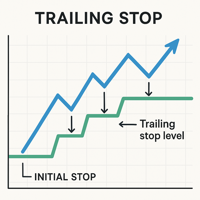
Auto Breakeven - Automated Tool for Swing Traders and Limit Orders What does the product do? Auto Breakeven is an advanced and easy-to-use automated tool designed specifically for swing traders and traders utilizing limit orders. Its main objective is to provide intelligent and efficient risk management by automatically moving the Stop-Loss to the entry price (Breakeven) once the trade reaches a predefined profit level. Benefits of the Product: Intelligent Risk Management: Once your trade reache
FREE

Tyrell Strategy 1 is a professional trading strategy based on the key concepts of Technical Analysis and developed by a team of traders and programmers with many years of experience.
The Expert Advisor operates by placing pending Stop orders and exploits the increases in volatility that occur when specific price levels that act as resistances and supports are broken. Tyrell Strategy 1 is equipped with several risk management systems, including 2 trailing stop systems and a protection syste
SignalDeMarker - stable in its work automatic adviser. The algorithm of the adviser's work is based on the definition of overbought / oversold market zones, built on the basis of an assessment of the current demand and the level of risk. The indicator is installed in the usual way, on a chart with a time period of D1 and works with any trading instrument. Options Expert_MagicNumber = 1234 - magic number
Signal_StopLevel = 50.0 - level of stop-loss (in points)
Signal_TakeLevel = 50.0 - Level o
FREE

マルチフラクタルインジケーター – 低タイムフレームで高タイムフレームを分析する最強ツール トレード中に 1分足で上位タイムフレームの高値と安値 を確認できたら便利だと思いませんか?例えば、 1分足チャートで1時間足の高値と安値をジグザグラインとして可視化 できたり、 4時間足の市場トレンド をチャートを切り替えずに把握できるとしたら? それを実現するのがマルチフラクタルインジケーターです!
この革新的なインジケーターは、 小さな時間軸で大きな時間軸の市場構造を分析 し、より正確なトレード判断を可能にします。 このインジケーターが必要な理由 短い時間軸でトレードしていても、 上位タイムフレームの主要な高値・安値や市場の方向性 を知ることは極めて重要です。このインジケーターなら、以下のメリットがあります。 最大10種類の上位タイムフレームの高値・安値を1つのチャート上に表示
上位タイムフレームの市場方向を数値で表示(+1: 上昇、-1: 下降)
ボタン一つで各タイムフレームのフラクタルの表示・非表示を切り替え可能
各フラクタルの色とサイズを自由にカスタマイズ
FREE
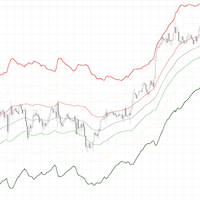
This indicator shows the support and resistance levels of the price.
If the price crosses -1.618 and the closing price is continuously higher than -1.618, go long, stop loss -1.618, first take profit Middle, second take profit +1.618, third take profit +3.618.
If the price crosses +1.618 and the closing price is continuously lower than +1.618, go short, stop loss +1.618, first take profit Middle, second take profit -1.618, third take profit -3.618.
In a volatile market, the price hovers betw
FREE

Gatotkaca Support Resistance Trendline Indicator is a simple indicator that detects support, resistance and trendlines. It will helps you find breakout momentum based on lines calculated by this indicator. This is conceptually based on fractals, but with customizable periods. Compatible for any timeframes. You can customize how this indicator work by setting up the period input.
FREE

This indicator identifies and highlights market inefficiencies, known as Fair Value Gaps (FVG), on price charts. Using a custom algorithm, the indicator detects these areas of imbalance where the price moves sharply, creating potential trading opportunities. Indicator Parameters: Bullish FVG Color (clrBlue) : Color used to highlight bullish inefficiencies. The default value is blue. Bearish FVG Color (clrRed) : Color used to highlight bearish inefficiencies. The default value is red. Bullish FVG
FREE

Indicator measures strength of each currency in your list.
Main idea: It simply iterates through all combinations of pairs and adds difference between open and close in percent. Parameters: List of currencies - what currencies will be calculated (maximum is 8) Calculation type - from which data will be strength calculated Calculation data input - used as input related to calculation type Symbol suffix - used in case of suffix on symbols, e.g: when your symbols look like EURUSDm, EURUSDmicro etc
FREE

The Color Candles Indicator uses custom colors to highlight candles that follow the main market trend, based on the Moving Average. This simplifies the analysis of price movements, making it clearer and more direct. When the price is above the rising Moving Average, candles are highlighted indicating a BUY opportunity. When the price is below the declining Moving Average, candles are highlighted indicating a SELL opportunity.
Input Parameters : Period Method Applied Price
The moving averages
FREE

It's a triangular arbitrage system (three pairs correlation system) to use 3 currencies to make 3 pairs to open hedge orders on those.
The expert starts opening six orders for each ring (3 plus and 3 minus) and waits to move prices in one direction to make a grid of orders.
The expert can use a maximum of 8 currencies to make 28 pairs and make 56 rings.
It is important the order of currencies is from the strongest to the weakest.
Strongest... EUR/GBP/AUD/NZD/USD/CAD/CHF/JPY ...weakest.
Can
FREE
This indicator is designed to provide all useful information about symbol, account, positions and profit. It is developed for improving trader's money management.
Parameters Calc can be divided to separate blocks. Each block is possible to hide, set its own color and other properties. Block symbol: This block displays information about actual SPREAD, POINT VALUE (in deposit currency for 1 lot), SWAP LONG and SHORT. Show symbol info - display/hide this block Color of symbol info - color of this
FREE

EA は、収益性の高いポジションを検索してクローズすることで、不採算のポジションをクローズできます 。
このアシスタントは 、 ターミナル内で すべてのポジションの中で最も 収益性の低いポジション を 探します 。 さらに、残りの収益性の高いポジションを検索することにより、1 つ以上のポジションの 利益が 別のポジションの損失よりも大きい場合に、損失をカバーできる一連のポジションを計算します。 そのようなポジションのセットが見つかった場合、アドバイザーはそれらをクローズします。 一連のポジションは、あらゆるポジションで構成できます。 最大数はアドバイザー設定で調整できます。 検索時の最小損失とクロージング時の追加利益を指定することもできます。 MT4のバージョン
完全な説明 購入する方法
インストールする方法
ログファイルの取得方法 テストと最適化の方法 Expforex のすべての製品 ストラテジー テスターでエキスパート アドバイザーをテストし、ビジュアル モードで EAPADPRO ツールバーを使用して取引できます。 プラスによるマイナスのクロー
FREE

Индикатор Trade in trend предназначен для торговли по тренду. Сила тренда определяется шириной линии. Узкая линия - начало или конец тренда. Широкая линия свидетельствует о высокой силе тренда. Резкая смена ширины линии свидетельствует, с большой вероятностью, об окончании тенденции. Сигналы индикатора Не против покупки: переход с красной линии в белую цена отразилась от белой линии индикатора цена находится выше белой линии индикатора Не против продажи: переход с белой линии в красную цена отр
FREE
The Chart Patterns Builder Basic expert advisor is a new addition to the automated trading strategies product family, which already contains the Price Action Builder Basic and the Bollinger Bands Builder Basic . While sharing general functionality with the other experts, this expert relies on the detection of some well-known trading chart patterns for identifying its buy/sell signals.
Technical details:
The following chart patterns are currently supported:
- double top and double bottom patter
FREE

残り 10 部 @ 49.55 次の価格 $65.77
Big Market Traderは、市場で優位に立つための究極のAI取引支援ツールです。最高の技術で設計されており、タイムリーな取引のための高頻度応答率を備えています。
ダイナミックAIオートメーションを搭載しており、これについては後ほど説明します。当社は高度なリスク管理システムを備えています。世界中のトレーダーが使用する株式ストップオプション、トレーリングストップシステム、タイムストップ、スプレッドテクノロジー。プロップファームトレーダー、従来のトレーダー、高資本および低資本取引などに適しています。
あらゆる種類の取引注文を行います。つまり、
買い注文、売り注文、買いストップ注文、売りストップ注文、買い指値注文、売り指値注文です。このAIマシンには、非常に多くの独自の機能があります。また、スキャルパートレーダー、デイトレーダー、スイングトレーダーなど、あらゆるタイプのトレーダーに適合するように設計されています。 Meta Trader 4 version 主な機能:
ダイナミック AI 自動化
高頻度応答率
保留

This indicator displays Point & Figure charts (PnF charts) in the indicator window. PnF charts show only price movements that are bigger than the specified box size. It helps to eliminate noise and allows focusing on main trends. Time is not a factor here. Only price movements are taken into account. That is why PnF chart is not synchronized with the main chart it is attached to. More about PnF charts: http://stockcharts.com/school/doku.php?id=chart_school:chart_analysis:pnf_charts Indicator wor
FREE

The HighsAndLowsPro indicator for MetaTrader 5 marks local highs and lows in the chart. It distinguishes between weak and strong highs and lows. The line thicknesses and colours can be individually adjusted. In the default setting, the weak highs and lows are displayed thinner, the strong ones thicker. Weak highs and lows have 3 candles in front of and behind them whose highs are lower and lows are higher. The strong highs and lows have 5 candles each.
FREE

News Scalper EA is an Expert Advisor for trading EURUSD - GBPUSD - XAUUSD pairs, positioning your positions during the news. Developed by an experienced trader with over 17 years of trading experience. News Scalper EA uses a news calendar from MQL5 and trades according to them. With sophisticated strategy and risk management, the EA protects your positions from larger losses! News Scalper EA lets you close the SL after the set time (1 minute, planned) when the position is in minus, which proves
FREE
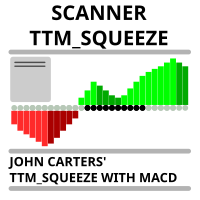
Market scanner based on the indicator published here Download the 'John Carters TTM Squeeze with MACD' Technical Indicator for MetaTrader 5 in MetaTrader Market (mql5.com) . Only the instruments that are in the Market Watch window are scanned. Maximum number of scanning tools up to 5000. The scan timeframe is selected from the timeframe panel of the terminal. To use it, open any chart and attach the Expert Advisor to the chart, the 'Search' button will appear in the upper left corner. When you
FREE

Japanese candlestick analysis has been in existence for hundreds of years and is a valid form of technical analysis. Candlestick charting has its roots in the militaristic culture that was prevalent in Japan in the 1700s. One sees many terms throughout the Japanese literature on this topic that reference military analogies, such as the Three White Soldiers pattern Unlike more conventional charting methods, candlestick charting gives a deeper look into the mind-set of investors, helping to establ
FREE

Important: After Installation use this instructions described in the "Comments" to add the AI-Trading-Buddy configuration: https://www.mql5.com/de/market/product/124858?source=Site +Profile#!tab=comments&comment=55105781
This EA can't be backtested in metatrader 5 since it uses webrequests to ai-models like claude, chat-gpt or deepseek and its not possible to backtest with webrequests in mql5. In the backtest scenario I used a simple rsi swing trade strategy.
AI Trading Buddy The AI Trading Bu
Simple indicator to show Breakeven line for all orders on attached chart pair. This indicator also comes with additional information such as Total Lot Size, Floating Drawdown in account's currency and Number of open positions and Difference from current price in Points. Do you use DCA (dollar cost average) or Hedging approach on your trading? Then this indicator you MUST have. Really useful, when you have multiple orders (hedging), this can help you quickly identify breakeven point without calc
FREE

Highly configurable Bollinger Bands indicator. Features: Highly customizable alert functions (at levels, crosses, direction changes via email, push, sound, popup) Multi timeframe ability Color customization (at levels, crosses, direction changes) Linear interpolation option Works on strategy tester in multi timeframe mode (at weekend without ticks also) Parameters:
Bollinger Bands Timeframe: You can set the lower/higher timeframes for Bollinger Bands. Bollinger Bands Bar Shift: Y ou can set th
FREE
MetaTrader 5 (MT5)用のUZFX - Delete Only Pending Ordersスクリプトは、取引口座からすべての未決注文(買い指値、売り指値、買い逆指値、売り逆指値)を自動的に削除するシンプルで効果的なツールです。このスクリプトは、アクティブなマーケットポジションに影響を与えることなく、保留中の注文を即座に消去したいトレーダーに最適です。
特徴 すべての未決注文(買い指値、売り指値、買い逆指値、売り逆指値)を削除します。 未決済のポジションには影響を与えません。 Experts]タブからリアルタイムで約定状況を確認できます。 トレーダーが手動で操作することなく、未決注文のストラテジーを素早くリセットできます。 使用方法 MT5チャートにスクリプトを添付します。 スクリプトはすべての未決注文を自動的にスキャンして削除します。 削除された各注文の確認メッセージが Experts タブに表示されます。 注意 このスクリプトは有効な取引を決済するのではなく、未決注文を削除するだけです。 スクリプトを実行する前に、すべての未決注文を削除することを確認してください
FREE

The indicator represents the session boxes for the Asian, European and American sessions. It is possible to change the time of each session, such as color. It is also possible to disable the display of each session. You will find in input parameters variables to modify in format hh:mm. In Colors tab you can change the color of boxes of each sessions. If you need some implementations please contact me.
FREE

This indicator is a zero-lag indicator and displays strength of trend change . True Trend Oscillator Pro works best in combination with True Trend Moving Average Pro that displays exact trend as is. Oscillator value is exact price change in given direction of the trend.
True Trend Moving Average Pro: https://www.mql5.com/en/market/product/103586
If you set PERIOD input parameter to 1 this indicator becomes a sharpshooter for binary options.
Developers can use True Trend Oscillator in Exper
FREE

White label available. contact us for more info. dushshantharajkumar@gmail.com
Chart Walker Smart Lines (CWSL) by Chart Walker Smart Lines is a MetaTrader 5 (MT5) indicator that revolutionizes technical analysis by offering a suite of powerful features to enhance your trading experience. This intelligent tool is designed to automate various aspects of chart analysis, providing traders with valuable insights and saving time on manual tasks. Key Features Automatic Channel Drawing: Smart Lines
FREE

Double Smoothed Stochastic is similar to Stochastic except for this Indicator we use what is called double exponentially smoothing.
This will give the trader a more speedy response to price changes which tends to smooth out the erratic movements of a regular Stochastic.
Double Smoothed Stochastic Calculation is : DSS = EMA(r) (X - Lxn / Hxn - Lxn) x 100 MIT = EMA(r) (close - Ln / Hn - Ln) x 100
Ln = lowest low of n periods Hn = highest high of n periodsLxn = lowest low of the price serie
FREE

ADX インジケーターは、トレンドとその強さを判断するために使用されます。価格の方向は +DI と -DI の値で示され、ADX 値はトレンドの強さを示します。+DI が -DI より上であれば、市場は上昇傾向にあり、反対であれば下降傾向にあります。ADX が 20 より下であれば、明確な方向性はありません。インジケーターがこのレベルを突破するとすぐに、中程度の強さのトレンドが始まります。40 を超える値は、強いトレンド (下降トレンドまたは上昇トレンド) を示します。
平均方向性指数 (ADX) インジケーターの複数通貨および複数時間枠の変更。パラメータで任意の通貨と時間枠を指定できます。また、インジケーターは、トレンドの強さのレベルが交差したとき、および +DI と -DI のラインが交差したときに通知を送信できます。ピリオドの付いたセルをクリックすると、このシンボルと期間が開きます。これが MTF スキャナーです。
通貨強度メーター (CSM) と同様に、ダッシュボードは、指定された通貨を含むペア、またはその通貨を基本通貨とするペアを自動的に選択できます。インジケーターは、

This EA is a robot based on two EMAs and an standard MACD. No martingale or grid strategies. All positions have their own stop-losses. Trading strategy: This robot uses fast and slow EMAs to check the trend of the currency, once the trend is known, the standard MACD will trigger the correct order. Placing the best take profit and stop loss depending on the strengh of the trend. The Expert Advisor is designed for best performance in EURUSD currency pair at a 15m timeframe. Both slow EMA and fast
FREE

Multi currency and multi timeframe scanner. Scans all instruments in "market watch" and gives either pc-alert or push-notification to the phone on a breakout. A breakout is by default defined as when a candle becomes longer than three ATR with a period of 300.
If you have the need for a custom buildt scanner, to scan for your particular setup. Please add a personal jobb under the Freelance section.
Functionality
Has spread filter , to not open stupid mega spread crypto currency charts. Has lo
FREE

Script to load history of a symbol on determined timeframe (default M1).
It is extracted from the MQL5 documentation:
https://www.mql5.com/en/docs/series/timeseries_access
Adapted by Renato Fiche Junior #melhoresferramentas #renato #larissasihle #aguiatraders
Parâmetros de Entrada
- Start datetime : the initial datetime from the history will be loaded - Timeframe to be loaded: period that will be loaded
FREE

No Nonsense Forex Methodのトレードパネル チャートをきれいに保ちながら、取引速度を向上させます
特徴: - ポジションサイジング: [Buy/Sell] をクリックすると、このツールはリスクに最も近いロット数 (各取引で使用される残高の割合) で 2 つの取引を開始します。ピップ値の計算は忘れてください!
-SL と TP: 各取引は 1.5*ATR のストップ ロスで開かれ、1*ATR のテイク プロフィットで 2 つの半分のうちの 1 つが開かれます。使用される ATR 値は、現在のローソク足の値であり、日足のローソク足を完了するまでの残り時間が 4 時間未満の場合、そうでない場合は前のローソク足の値になります。
-ストップロスの更新 : ストップロスを損益分岐点に設定するか、NNFX のルールに従ってトレーリング ストップを更新します (価格が 2*ATR に移動した後、ストップ ロスは 1.5*ATR に移動します)。 - ポジションを閉じる: 決済シグナルを受け取ったら 、ワンクリックですべての売買を決済します
その他の考慮事項: -プログラム
FREE
Please download version 3.0 ! The Fundamental Fast Signal EA is a non-trading signal generator for MT5 , designed to provide traders with high-accuracy buy/sell alerts based on the EMA (9, 21) crossover on the 5-minute timeframe . This indicator empowers traders by offering precise entry signals while keeping full trade execution control in their hands. Key Features: EMA (9, 21) Crossover-Based Signals – Identifies momentum shifts for strategic trade entries. 5-Minute Timeframe Optimization – Id
FREE

このインディケータは、過去の価格行動を分析して市場の売買圧力を予測します。過去を振り返り、現在の価格周辺の価格のピークと谷を分析します。これは、最新の確認インジケータです。 [ インストールガイド | 更新ガイド | トラブルシューティング | よくある質問 | すべての製品 ] 市場での売買圧力を予測する フレンジーを売って買うことに巻き込まれないようにする 設定も最適化も不要 インジケーターはすべての時間枠で機能します 非常に使いやすい 潜在的な供給価格と需要価格は、多くの市場参加者が負けポジションを維持し、損益分岐点でそれらを清算することを望んでいる価格です。したがって、これらの価格レベルで大規模な活動があります。 需要と供給の両方が数値として定量化されます 供給が需要を上回る場合、販売圧力が予想されます 供給が需要を下回っている場合、購入圧力が予想されます 供給が需要を上回っている場合はショートを探してください 供給が需要を下回っている場合は、長期を探してください
入力パラメータ 範囲:過去のピークと谷を検索するための現在の価格のボラティリティ乗数。
著者 Arturo

Outside day trading strategy looks for a specific pattern in the price chart of a security.
The pattern is characterized by a larger range than the previous day, with the high of the day higher than the previous day's high and the low of the day lower than the previous day's low.
Works with many symbols, such as BTCUSD, GBPUSD,USDCAD, oil, gas, and others. PLEASE RATE! Thank you very much!
FEATURES:
- Real Strategy - Daily Bar Strategy - Exit the trade if the day was profitable - ATR multiple s
FREE

Arguably THE MOST PROFITABLE SYSTEM..... WITH EXTREMELY ::::::::::TIGHT STOPLOSS::::::: Introduction PRICE of only 399/- (Only the first month)
- Extremely TIGHT STOP LOSS on EVERY TRADE - EXTREMELY HIGH WIN RATIO STILL :::::::::: 90% ::::::::::::: - SUPER HIGH PROFITS ::::::::::: BACK TEST 13 years :::::::::::: See screenshots for Backtest results - QUICK SCALPING ... TIGHT SCALPING...
IS THE HOLY GRAIL of All Systems as it has EVERYTHING - 90% WIN RATE - Super high return - Q
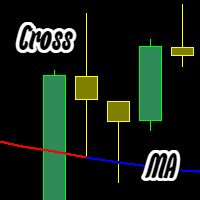
このインジケーターは2色の移動平均線(MA)を表示します: 青色 — 前の足の始値と終値がMAラインの上にある場合。 赤色 — 前の足の始値と終値がMAラインの下にある場合。 カスタマイズ可能な設定: MAタイプ(単純、指数、平滑、線形); MA期間; MAの色変更時のアラート。 不具合があればお知らせください。修正します。 bar cross Moving cross candle cross Moving cross bar cross MA cross candle cross MA cross bar cross Moving Average cross candle cross Moving Average cross bar このインジケーターは2色の移動平均線(MA)を表示します: 青色 — 前の足の始値と終値がMAラインの上にある場合。 赤色 — 前の足の始値と終値がMAラインの下にある場合。 カスタマイズ可能な設定: MAタイプ(単純、指数、平滑、線形); MA期間; MAの色変更時のアラート。 不具合があればお知らせください。修正します。
cr
FREE

Phi Cubic Fractals Pack1A with FuTuRe PACK 1A é uma melhoria sobre o Pack 1 que inclui a possibilidade de selecionar as linhas LINE 4/8/17/34/72/144/305/610 individualmente. Este produto contém os indicadores do PACK 1A (Lines + LineSAR + Channels + BTL + Ladder) + MODO FUTURO Phi Lines - medias moveis especiais, semelhantes às MIMAs do Phicube, capazes de indicar com muita clareza tanto a tendencia como a consolidação; Phi LineSAR - apaga ou destaca as Phi Lines para mostrar apenas as linha

Daily pivot are relatively important in trading.
This indicator have options to select 5 commonly use pivot point calculations.
User input Choose Pivot Point Calculation (Method Classic, Method Camarilla, Method TomDeMark, Method Fibonacci or Method Woodies.) Choose Applied Timeframe for the calculation (M5, M15, H1, H4, D1, W1 etc) Can be attached to any timeframe Choose color of Pivot point Note:
For MT4, please refer here : https://www.mql5.com/en/market/product/22280
FREE

Robot Trading Gold is a fully automated trading system that doesn't require any special skills from you. Just fire up this EA and rest. You don't need to set up anything, EA will do everything for you. EA is adapted to work on small deposit over $100 for good work.
Timeframe: 15 Min
Currency pairs: XAUUSD PROFITABILITY AND RISK The expected estimated profitability according to the backtest data is about 300% - 600% per year. The expected maximum drawdown is about 90% or more . Attention!!!
FREE
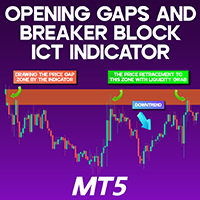
Opening Gaps + Breaker Block ICT Indicator MT5 The Opening Gaps + Breaker Block ICT Indicator MT5 is a cutting-edge trading tool for MetaTrader 5, engineered to detect daily price gaps and convert them into key support and resistance levels on the chart. By default, support zones appear in gray, while resistance zones are marked in red. When the price successfully breaks through these levels, the indicator changes the color to purple, confirming the emergence of a Breaker Block . Key Features
FREE

The Expert Advisor is based on the signals of the Stochastic indicator in the overbought zone-we sell, in the oversold zone-we buy. Version for MT4 https://www.mql5.com/ru/market/product/62952 Monitoring the work of the adviser MT4 https://www.mql5.com/ru/signals/1178019 MT5 https://www.mql5.com/ru/signals/1178043 If the Expert Advisor is used in 5/24 mode on a VPS, I recommend using this Expert Advisor in a conservative mode, limiting the number of orders in the grid using the " Count_Order
FREE

ケルトナー・エンハンスドは、ケルトナー・チャネルの精度と見やす さを向上させるもので、METAデフォルトを超える多くの調整オプショ ンと5つの価格計算を備えています。
ケルトナーEインディケータは、ボリンジャーバンドや移動平均エンベロープ に類似したバンド型インディケータです。ケルトナーEは、ボリンジャーバンドや移動平均線に似た帯状のインジケータで す。
ケルトナー・チャネルを使用する際に注意すべき主な現象は、上限エンベロープの上方または下限エンベロープの下方へのブレイクアウトです。上側のエンベロープを上抜けた場合は、買われ過ぎを意味します。下限エンベロープを下抜けた場合は、売られ過ぎを意味する。
ただし、ケルトナー・チャネルを使用する際には、買われすぎや売られすぎの状態はしばしば強さの兆候であることに留意してください。
トレンドが明確に定義されている場合、買われ過ぎや売られ過ぎは強さを示すことがあります。この場合、現在のトレンドは強まり、最終的に継続する。横ばい相場では、少し違った動きをする。相場が横ばいトレンドにある場合、買われすぎや売られすぎの読みは、多くの場合、価格が
FREE

This indicator will show a vertical representation of the volume distribution within a selected user range.
This is a free version of the full product. It is limited to use on a week old data or older. Find the full product at https://www.mql5.com/en/market/product/42234 .
Main features: This Indicator will create an image that will allow viewing the tick volume per price level in a graphical form. The indicator will work on any range size in any time-frame, limited only by your computer mem
FREE
TW Volume Signal Pro MT5 は、先進的なAI技術と独自のスマートアルゴリズムを活用し、金市場でより自信を持って取引できるようにし、ユニークで比類のない取引体験を提供します。金市場で高い精度と卓越した取引信号をお探しですか?TW Volume Signal Pro MT5を使用すれば、プロのトレーダーとなり、金市場で大きな成功を収めることができます。それでは、今すぐ無料でお試しください!
TW Volume Signal Pro MT5の主な特徴:
正確で信頼できる信号: 信号、テイクプロフィット(TP)、およびストップロス(SL)はまったく変わらず、完全に信頼することができます。
正確なトレンド検出: TW Volume Signal Pro MT5は取引量を分析し、市場のトレンドの変化を正確に特定し、最適なタイミングで取引に入る手助けをします。
スマートアラート: 入場、テイクプロフィット、およびストップ

アカウントの残高とシンボルのスプレッドをリアルタイムで監視できる優れたユーティリティツール これにより、データを正確に特定する方法、たとえばプロップファームの口座を持っているかどうか、正しいラベレージやスプレッドが操作されているかどうかなどを知り、正確なロットを作成する方法がわかります。
レバレッジとスプレッドインジケーターの組み合わせ。 取引口座のレバレッジとスプレッドを自動チェックするためのツール。 すべてのブローカー外国為替株で働いています。 ブローカー外国為替のレバレッジ変更を監視したり、経済ニュースの発表中に拡散したりする場合に役立ちます。 現在のシンボルのリアルタイムスプレッドチェック。 取引口座のリアルタイムレバレッジチェック。 高速更新による分かりやすいデザイン 等
FREE
MetaTraderマーケットはトレーダーのための自動売買ロボットやテクニカル指標を備えており、 ターミナルから直接利用することができます。
MQL5.community支払いシステムはMetaTraderサービス上のトランザクションのためにMQL5.comサイトに登録したすべてのユーザーに利用可能です。WebMoney、PayPal または銀行カードを使っての入金や出金が可能です。
取引の機会を逃しています。
- 無料取引アプリ
- 8千を超えるシグナルをコピー
- 金融ニュースで金融マーケットを探索
新規登録
ログイン