YouTubeにあるマーケットチュートリアルビデオをご覧ください
ロボットや指標を購入する
仮想ホスティングで
EAを実行
EAを実行
ロボットや指標を購入前にテストする
マーケットで収入を得る
販売のためにプロダクトをプレゼンテーションする方法
MetaTrader 5のためのエキスパートアドバイザーとインディケータ - 34

SPECIAL BIG DISCOUNT ->> Buy Forex Trend Detector with -60% OFF! NOTE: Promo price: $197 (Regular Price: $497) - The offer ends soon! For Settings, Instructions and LIVE Results Click Here! Forex Trend Detector is an automated trading strategy which is developed to follow the money… or "follow the market impulse" resulting in reliable and consistent performance. I built Forex Trend Detector on a trading strategy that works!
I didn't use exotic or speculative techniques – instead i examined th

Volume Weighted Average Price or VWAP is an indicator wich shows different average prices on chart. This is very useful to find strong negotiation price areas and as trend following.
Configurations: Day, Week and Month - Show different VWAPs according to the period. You can change each line style on "colors" tab.
Any doubt or suggestion please contact us. Enjoy! This is a free indicator, but it took hours to develop. If you want to pay me a coffee, I appreciate a lot <3 PayPal, Skrill, Nete
FREE

Quick Trade is a simple but needful utility for MT5 that allows to set SL, TP and entry price for a trade in a couple of seconds, allowing also shaping right position size based on risk wanted. It provide shortcuts to save more time and of course, you can also put values typing with keyboard or drag lines at your desired value! Shortcut Action CTRL + Click Set SL Shift + Click
Set TP z + Click Set Price A simple utility that you will start to love if you do manual trading. Stop calculating risk
FREE

Tabajara Rules for MT5 , baseado em Setup Tabajara do professor André Machado, indica a direção do mercado com base em médias móveis quando tem velas na mesma direção da média móvel.
O indicador contém a regra de coloração aplicada aos candles e a média móvel.
O indicador permite a alteração dos parâmetros: período e método de suavização da média móvel.
O indicador permite a alteração das cores dos candles ( contornos e preenchimento) e da média móvel.
O modelo do professor André Machado conté
FREE

An “inside bar” pattern is a two-bar price action trading strategy in which the inside bar is smaller and within the high to low range of the prior bar, i.e. the high is lower than the previous bar’s high, and the low is higher than the previous bar’s low. Its relative position can be at the top, the middle or the bottom of the prior bar.
The prior bar, the bar before the inside bar, is often referred to as the “mother bar”. You will sometimes see an inside bar referred to as an “ib” and its m
FREE
UPD: https://t.me/mql5_neuroExt актуальная версия и обсуждение. -作成されたトレーニングベースを成功させるために、一時的に使用するためのアドバイザーを無料で提供します。 -トレーニングの進行に伴い、トレーニングベースが配置されます。 -トレーニングには約20エポックが必要です。 なぜならExpert Advisorはリソースを大量に消費し、市場はそれを処理できません。Market値を持つTypeOfWorkパラメーターが導入されました。 他の希望する値に切り替える必要があります! 共同学習のために公開されました! 入力データのセットの深さは、設定で指定された時間枠の50バーです。 ThresholdOUTは効果がありません。 場合によっては、速度は非常に大きな値にのみ影響します。 トレーニングモードでは、SLとTPが等しい最小ロットで1つの注文のみを開きます。スケジュールは統一されている必要があります。このモードでは、利益自体は重要ではありません。 距離は、MaxOrders> 1でのみ機能します。 MaxOrde
FREE

リベンジ トレーディング プロテクターは、リベンジ トレーディングの被害に遭う可能性のあるトレーダーにとって、シンプルですが効果的なツールです。私もデイトレーダーなので、リベンジトレードの心理的側面や損失を埋めたいという気持ちは理解しています。
そこで、損失後に忍耐強くなり、不合理な取引決定を下さないように100%確信できるように、私はこのツールを開発しました(私自身も使用しています)。
損失を被った場合、Revenge Trading Protector EA は、 希望する休憩時間が経過するまで、 別の注文 (指値注文、ストップ注文、成行執行注文のいずれか)を開くことができなくなります。 たとえば、午前 10 時 45 分に損失を出し、30 分のタイム ブレークを設定した場合、午前 11 時 15 分より前に設定した注文は EA によって即座にキャンセルされます。再度許可されると、アラートで通知されます。 30 分が経過する前に取引に参加しようとすると、それぞれ通知されます。
追加機能: 最大株式ドローダウンは、希望する最大株式ドローダウンを超えた場合、残りの日

ある MT5 または MT4 アカウントから別の MT5 アカウントに取引量をコピーするためのシンプルなユーティリティ。 ネッティング口座とヘッジ口座の間で任意の組み合わせでポジションをコピーできます。デフォルトでは、同じボリュームを持つすべての一致するシンボルによって開かれたポジションがコピーされます。シンボル名が異なる場合、またはコピーされたポジションのボリュームが異なる場合、またはすべてのポジションをコピーする必要がない場合は、この 投稿 で説明されている設定で目的の動作を指定できます。この製品は、将来のリリースで機能を拡張します。 バージョン 2.0 までは、この製品は無料です。 インストール順序:
送信者アカウントの端末で、Expert Advisor を送信者モードで起動します。 受信者アカウントのターミナルで、Expert Advisor を受信者モードで起動し 、以前に起動した送信者の 1 つを選択して、そこからポジション ボリュームをコピーします。
FREE

Pivot Point Supertrend (corresponds to Pivot Point Super Trend indicator from Trading View) Pivot Point Period: Pivot point defined as highest high and highest low... input 2 = defining highest high and highest low with 2 bars on each side which are lower (for highest high) and are higher (for lowest low calculation) ATR Length : the ATR calculation is based on 10 periods ATR Factor: ATR multiplied by 3
FREE
HEDGING ACCOUNTS ONLY!!! Double Trouble RSI uses 2 Moving averages to define trend then opens trades based on RSI over bought or over sold conditions. It also has a time filter to define trading times. Default settings are for 5 minute timeframe. This EA is highly configurable and can be optimized to be used on most instruments and currencies, including DAX and S&P 500
The money management section is also highly configurable and does not make use of any risky strategies like martingale etc..
FREE

The Spider ZIGZAG is an algorithm to determine how critical the current peak is by spreading several lines with different parameters instead of one line between each 2 peaks. 1. The more zigzag's lines meet at a peak the higher probability the market will go for correction or change direction. 2. Usually when 3-4 zigzag's lines meet at a peak, the market enters a correction period, this don't happen instantly, it might take some time. 3. Usually when 5-6 zigzag's lines meet at a peak, th
FREE

The ATR Exit indicator uses the candle close + ATR value to draw trailing stop lines (orange under buys, magenta over sells) that advance with the trend until the trend changes direction. It uses a multiple of the Average True Range (ATR), subtracting it’s value from the close on buy, adding its value to the close on sell. Moreover, the trailing stop lines are generated to support the order’s trend direction (long or short): In an upward trend, the long trailing stop line (orange line under bu
FREE

(暗号通貨チャート)
指定した数のバーの数だけ履歴が表示され、インスタントデータが直接表示され始めます。
すべての時間枠で働く機会を提供します。
複数のシンボルを操作できます。
このアプリはバックグラウンドサービスです。
マーケットウォッチ画面に「S」で始まるすべてのシンボルの履歴をダウンロードし、ティックデータを表示します。
BinanceSpotのリアルタイム取引データをMT5に自動的に転送します。
リンク内のスクリプトを実行して、プログラムを使用します。 https://www.mql5.com/en/market/product/69000
このプログラムはインストールが必要です。
https://www.mql5.com/tr/market/product/73887
[ツール]メニュー>> [オプション] >> [エキスパートアドバイザー]からWebRequestを許可し、URLを追加する必要があります:https://api.binance.com https://fapi.binance.com

Advanced Strategy Overview: The Mars EA employs multiple independent grid sequences of orders, strategically trading against common retail trading logics at specific liquidity levels. By monitoring significant level breaches, the EA identifies inducements that typically attract retail traders, as outlined in many trading strategies. It then strategically trades against these retail positions, targeting areas where liquidity from their stop losses is concentrated. Key Features: Grid Trading wi

MT4 Version Fibonacci Bollinger Bands MT5 Fibonacci Bollinger Bands is a highly customizable indicator that shows areas of support and resistance. This indicator combines the logic for the Bollinger Bands with the Fibonacci level. Fibonacci Bollinger Bands is the first indicator in the market that allows the user to 100% customize up to 12 Fibonacci levels, the Moving Average type and the price data source to use for the calculations. This flexibility makes the Fibonacci Bollinger Bands easily
FREE

XE Forex Strengh Indicator MT5 displays visual information about direction and strength of a signal for current pair and chosen timeframes (M5, M15, M30 and H1). Calculations are based on multiple factors and results are shown as a colored panel with scale bar, numerical values and arrows. There are also displayed values of current price and spread on the pair. There can be activated an alert (as a mail or pop-up window with sound) for each available timeframes which send a message when the dir
FREE

This indicator was developed to support multiple timeframe analysis. In the indicator settings, the user can set the color, width, and style of the horizontal lines for each timeframe. This way, when the horizontal lines are inserted into the chart, they will be plotted with the timeframe settings.
MTF Lines also allows visibility control of another objets like rectangles, trend lines and texts.
This is a product developed by Renato Fiche Junior and available to all MetaTrader 4 and 5 users!
FREE

Pips Hunter PRO は数年かけて開発され、前作の改良版です。この強力なインジケーターは、マーケットと価格の履歴を分析し、売買エントリーを生成します。これらのエントリーの計算には、複雑な統計的対数だけでなく、連動する様々なインジケーターを使用し、不利なエントリーをフィルタリングして排除します / MT4バージョン 。
特徴 リペイントなし
このインディケータは、新しいデータが到着してもその値を変更しません
ラグなし このインディケータはラグがありません 取引ペア
すべてのFXペア (できればEURGBP)
時間枠
すべての時間枠
パラメータ ===== 表示
矢印の距離 // シグナル(矢印)とローソク足の距離
===== アラート
ポップアップアラート // MT4ターミナル用のアラート
プッシュ通知 // 携帯電話向けアラート
メールアラート // メールアラート
===== チャート設定
チャート上のローソク足の色を変更するオプション。
警告 私はMQL5.comでのみ製品を販売しています。もし誰かが私の製品を売りたいと連絡
FREE

ATAI: AI駆動の金取引エキスパートアドバイザー
価格は10回の購入ごとに100ドル増加します。最終価格:1250ドル。
この声明は、このAIベースの取引システムのバックテスト結果が信頼できないことを説明しています。なぜなら、取引信号を受け取るためにはインターネット接続とAIサーバーとの通信が必要であり、これはバックテスト環境では不可能だからです。 説明
------- 理論P、オプションD、食べる ATAIは、 金および金関連通貨ペアの取引のために設計された高度なエキスパートアドバイザーです。 市場データを分析し、取引信号を生成するために、特にGroq AIモデルを利用しています。 このEAは、伝統的なテクニカル分析と最先端のAI技術を組み合わせて、情報に基づいた取引判断を行います。 主な特徴 • Groq AIを使用したAI駆動の取引信号 • 金および金関連通貨ペアに対応 • ATRベースのトレーリングストップメカニズム • 動的ロットサイズとリスク管理 • 取引時間制限 • リアルタイム市場情報を提供するユーザーフレンドリーなインターフェース 動作原理 1. 市場分析:

このインディケータは、1つのウィンドウで複数のタイムフレームのトレン ド方向を表示します。複数のタイムフレームのトレンドが一致する場合、矢印が描かれます。 また、ヒストグラムに切り替えて、現在のタイムフレームのトレンドを表示することもできます。 このインディケータは、チャート上にエントリーポイントとおおよそのエグジットポ イントを描画します。
警告:このインディケータはマルチタイムフレームであるため、ストラテジーテスターで使用する場合は、必要なすべてのタイムフレームの相場を事前にダウンロードしておく必要があります。テスターで長い間相場のダウンロードを待たずに済むように、開始日を2025.01.01とし、モデルを「オープンプライスのみ」または「コントロールポイント」とすることができます。
MT4用インジケーターバージョン
特徴 このインディケータは再描画しません。ヒストリカルチャートに表示されているものがリアルタイムで表示されます。 暗号通貨、株式、金属、指数、商品、通貨など、あらゆる資産の取引に使用できます。 すべてのタイムフレームに対応。 エン
Discover the power of fractals to uncover significant market reversals! This custom Fractals Indicator for MetaTrader 5 is designed to help traders quickly and effectively spot potential swing highs and lows, providing visual cues that make trading decisions easier. Key Features: Clear Buy & Sell Signals: Green and red arrows highlight bullish and bearish fractals, helping you effortlessly identify significant price pivots. Customizable Analysis Depth: Choose the number of bars to evaluate for f
FREE

The Super Boom and Crash Robot operates based on two key indicators: the Relative Strength Index (RSI) and the 200-period Moving Average (MA). It buys when the RSI is above 30, signaling potential for upward momentum, and the 200-period MA is positioned above the current price, indicating a bullish trend. Conversely, it sells when the RSI falls below 70, suggesting overbought conditions, and the 200-period MA is below the price, signaling a bearish trend. This strategy aims to capitalize on pric
FREE

For those traders and students who follow the famous brazilian trader Igor Rodrigues (Mago Trader) here it is another tool he uses: a 2-line MACD specially set with Phi ratios. This MACD is packed with a twist: a Filling Area , to easily and visually spot the corresponding trend on the chart. Obviously, you can turn On and Off this filling feature. If you don't know Igor Rodrigues and you are a brazilian trader and student, just google for him... Very simple and useful indicator.
If you are loo
FREE
*** ATR --------------------------------- RSI ***
MQLuxe B1 is a special MT5 Robot that is a fully automated trading system that doesn't require any special skills from you. Just fire up this EA and rest. You don't need to set up anything, EA will do everything for you. EA is adapted to work on small deposits. Combining the Average True Range (ATR) indicator with the Relative Strength Index (RSI) can create a robust trading strategy in the Forex market. This combination can help you i
FREE

This indicator calculates fibonacci levels via moving averages trend and draw these lines. You can change fast and slow Moving Averages settings for customization. Inputs:
Fast MA Time Period : 64 Fast MA Shift: 0 Fast MA Method: Smoothed Fast MA Apply To: Median Price Slow MA Time Period: 32 Slow MA Shift: 0 Slow MA Method: Smoothed Slow MA Apply To: Median Price ZigZag: False ZigZag Color: Red ZigZag Type: DashDot ZigZag Width: VeryThin Fibo Settings TrendFibonacci: True FiboTrendColor: Black
FREE

Saw AI Trading - The Ultimate Trading Bot for Profits in All Market Conditions ️ Description: Saw AI Trading is an intelligent trading robot designed to perform efficiently in all market conditions. It stands out with its unique ability to generate profits whether the market is bullish or bearish, making it an ideal choice for both beginner and professional traders. What Makes Saw AI Trading Stand Out: Balanced Performance in Both Directions: Saw AI Trading can achieve profits regar
FREE

[ZhiBiDW Trend]は、トレンドとショックのシンプルで直感的で効果的な指標です。 これは、15分以上4時間未満のチャート期間に適しており、すべての市場の種類に適しています。
買いシグナル:青い上向き矢印が表示され、その矢印にストップロスとテイクプロフィットのプリセット価格が表示されます。
売りシグナル:赤の下向き矢印が表示され、矢印がストップロスとテイクプロフィットのプリセット価格と共に表示されます。
パラメータ設定の説明
[Send_Alert]:これはアラームスイッチで、trueに設定されていて、矢印が表示されていれば自動的にプロンプトに警告し、falseに設定されていれば警告しません。 [Send_Email]:これはメールを送信するためのスイッチで、trueに設定します。矢印が表示されればMT4で設定したメールボックスにメールを送信し、falseに設定されたらメールを送信しません。 [Send_Notification]:インスタントメッセージを送信するためのスイッチで、trueに設定します矢印が表示されている場合はモバイルデバイスにメッセージを送信し、fal
FREE
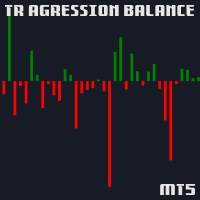
Shows the agression balance (buy agression deals - sell agression deals) in a histogram. The agression is calculated on every tick of a given candle and is the sum of volume of all the market buys minus all of the market sell trades. If the ticker does not have real volume, tick volume is used insted;
Very useful to determine if a given candle is dominated by bulls or bears
It is necessary for the data provider to have a list of trades (times & sales) as well as the agressor (buy/sell) data.
FREE

The TRIXs Indicator is the combination of the TRIX (Triple Exponential Moving Average) indicator with the addition of a SMA (Simple Moving Average) signal. It provides signs of trend continuity and the start of a new trend.
The entry and exit points of operations occur when the indicator curves cross.
It performs better when combined with other indicators.
FREE

Genaral: Not martingale, not a grid; Use on EURUSD Use on M5
Signals: There is a good rational algorithm. Work of two indicators: Chaikin and DeMarker (from 2 timeframes) (you can set a separate Timeframe for each indicator)
Stop Loss/Take Profit: There is a good money management system (there are several type for trailing stop loss); There is virtual levels of Stop Loss / Take Profit; There is smart lot (percent by risk) or fix lot
Important: EA can work on closed candles, and on curr
FREE

Embark on an exploration of an unparalleled strategy: "Support and MACD." Meticulously designed for USD/CHF on a one-hour timeframe, this intelligent strategy harnesses the power of robust support levels and the unwavering reliability of MACD indicators. While the number of trades executed might be limited, each trade executed is nothing short of exceptional in its impact and potential.
Free until the next update.
For any information, contact me.
FREE
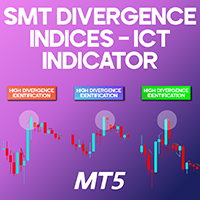
SMT Divergence Indices ICT Indicator MT5 The SMT Divergence Indices ICT Indicator MT5 is a specialized trading tool within the ICT methodology for MetaTrader 5. It assists traders in identifying three primary types of divergences across major stock indices. This indicator is particularly useful in spotting trendline divergences, higher-low divergences, and smart money divergences , providing traders with valuable insights into potential market reversals. «Indicator Installation & User Guide» MT5
FREE

便利なドルコスト平均法取引システム . 主なエントリーシグナルはRSIの買われすぎ/売られすぎに基づいています トレーディングボット設定マニュアル 取引シンボル - 説明 = ボットが取引する通貨ペア 例: "EURUSD;EURGBP;GBPUSD" 重要な注意事項 すべての「時間設定」は24時間表記を使用 ポイントベースの設定(スリッページ、ギャップ、SL/TP)はシンボルのポイントサイズによります セミコロンで区切られたリストにスペースを含めてはいけません 取引ウィンドウはプラットフォームのタイムゾーンに基づきます RSIの設定は標準のテクニカル分析に従います 要件 アカウントのレバレッジは最低1:200 最低入金額: $50
FREE

市場内で開発傾向にアラートを取得するには、この指標を使用してください。
この指標を使用すると、彼らが開発するように、市場で発展している傾向についてのアラートを取得することができるようになります。 この指標は、トレンド内のエントリまたは終了を識別するために使用できます。 この指標は、より高い時間枠からの情報と、現在の時間枠の価格の動きを組み合わせて、買いまたは売りの信号を出力します。 指標は、傾向の変化、または支配的な傾向の継続を識別することができます。
注:トレンドフォローは低い勝率を持っていますが、トレンドのリターンは平均損失の3-5倍の大きさにすることができます。 簡単なセットアップ 任意の時間枠で、任意のグラフにドラッグアンドドロップします。 アラートを有効にする(オプション) そして、あなたは完了です! 視覚的および音声的な警告 お使いの携帯電話に直接送信されるアラート お使いの端末に送信されたアラートをポップアッ マルチユース 株,外国為替,オプション,先物 柔軟性 任意の時間枠で動作します
FREE

The expert "QuantumPip" is a fully automated expert which can trade several symbols from one chart. The expert also uses prices of Gold, Oil, Dixie, DAX or FTSE to calculate inputs for the symbols. The expert uses 2 types of recurrent neural model - 1 network (decisions "buy" or "sell") and 2 networks (decisions "buy" or "uncertainty" and "sell" or "uncertainty"). QuantumPip can, therefore, trade 20 strategies as one, because it is 2 models per each of the 10 symbols. This can help diversify ris

The MACD 2 Line Indicator is a powerful, upgraded version of the classic Moving Average Convergence Divergence (MACD) indicator.
This tool is the embodiment of versatility and functionality, capable of delivering comprehensive market insights to both beginner and advanced traders. The MACD 2 Line Indicator for MQL4 offers a dynamic perspective of market momentum and direction, through clear, visually compelling charts and real-time analysis.
Metatrader4 Version | All Products | Contact
FREE

KMeans Price Zones Detector を使ったトレーディングの未来へようこそ。これは、機械学習の力を利用して主要な価格ゾーンを特定する革新的なMetaTrader指標です。このツールは、価格データ内の重心を動的に検出するためにKMeansクラスタリングアルゴリズムを利用し、価格がサポート、レジスタンス、または統合に遭遇しやすいエリアを強調します。 革新的なKMeansアルゴリズム KMeans Price Zones Detectorは、パターン認識においてその効率と精度で知られる機械学習の基本であるKMeansクラスタリングアルゴリズムを高度に活用することで際立っています。過去の価格データを分析することで、この指標は重要な価格レベルを表すクラスタまたは重心を識別します。これらの重心を使用してサポートとレジスタンスゾーンを計算し、トレーダーに価格の反転、ブレイクアウト、および統合の可能性に関する重要な情報を提供します。 主な特徴 動的ゾーン検出: 指標は最新の市場データに基づいて価格ゾーンを継続的に更新し、トレーダーが常に最も関連性の高い情報を持つことを保証します。
FREE

If you love this indicator, please leave a positive rating and comment, it will be a source of motivation to help me create more products <3 How to use QQE? Determine trend when RSI MA above 50 indicate a bullish market, while RSI MA below 50 indicate a bearish market and can server as a trend filter. Identify short-term up/down momentum, when the RSI MA crosses up Smoothed signals bullish momentum, and when the RSI MA crosses down Smoothed signals bearish momentum. It is also possible to
FREE

Please check the " What's new " tab regularly for a complete and up-to-date list of all improvements + parameters. FREE indicator for my trading utility Take a Break . This indicator allows you to manage multiple other EAs with just one Take a Break EA instance. Simply specify the corresponding Chart Group in the indicator(s) and Take a Break EA settings and you are good to go.
Setup examples (Indicator + EA)
As a prerequisite, add the URL https://trading.custom-solutions.it to the list of al
FREE

Multifunctional universal trading system . Suitable for all Forex and Crypto markets.
.set files are updated weekly, published on our site.
----
New function added, 2024.10.15: integration of AI llama models. Added additional RSI MACD indicator filters . Flexity AI indicator integration. --- FrankPro.ex5 [ POLYINDICATORS AND AUTOMATIC OPTIMIZATION ], a heavy build featuring most of TS_DayTrader Trading System.
An extensive array of tools for manual and automated trading.
For fast op

The strategy of the Expert Advisor is based on the return of the price to the average value. This is a simple and effective strategy using StopLoss and TakeProfit.
Additional orders in the same direction are allowed. The entire series of orders is closed with a positive result - this is another advantage of ONI EA.
When creating the ONI Expert Advisor, we optimized it hundreds and thousands of times using 100% quality ticks.
All our signals are now available on myfxbook : https://t.me/rob
If you love this indicator, please leave a positive rating and comment, it will be a source of motivation to help me create more products <3 Key Takeaways The Laguerre RSI is an enhanced version of the traditional Relative Strength Index (RSI) that incorporates Laguerre filters to smooth the price data. This helps reduce the noise and volatility that are often seen in the standard RSI, providing a cleaner and more reliable indicator for spotting trends, reversals, and overbought or oversold con
FREE

Apocalypse US30 EA, which is designed for one of the most popular Wall Street indices in the United States (US30).The strategy does not use: Grids, Martingale. Stop Loss and Take Profit levels are set for each trade.Choose a broker with low spreads. Test it on a demo account for 4 weeks before using it on a live account to ensure compatibility with your broker.All parameters are already built-in, and there is no need to optimize or change the EA yourself.
EA features: Use dynamic small stop los
FREE

Automatic Fibonacci Retracement Line Indicator. This indicator takes the current trend and if possible draws Fibonacci retracement lines from the swing until the current price. The Fibonacci levels used are: 0%, 23.6%, 38.2%, 50%, 61.8%, 76.4%, 100%. This indicator works for all charts over all timeframes. The Fibonacci levels are also recorded in buffers for use by other trading bots. Any comments, concerns or additional feature requirements are welcome and will be addressed promptly.
FREE

Thermo MAP is a multicurrency and multitimeframe indicator that display a smart heat map based on proprietary calculations. Watch how Forex market moved and is currently moving with a single dashboard and have a consistent and good idea of what is happening!
It can be suitable for both scalping or medium/long term, just select options that better fit your trading style Symbols list are automatically sorted based on the preferred column. There is the possibility to click on: First row, timeframe
FREE

毎日特定のローソク足で動くPIVOTを何度探したことでしょう。
多くのトレーダーは、マーケットが開いてから30分後、正午12時など、毎日特定の時刻を基準にして、その日のトレンドの方向性を推し量ることを好みます。
このインディケータでは、特定の時間(時、分)を指定し、その時間から翌日までのピボットを同時にプロットすることができます。その特定のローソク足/時間に基づき、中央値、最大値、最小値、サポ ート、レジスタンスの5本のラインが表示されます。
選択した時間がPERIODの制限外(M5タイムフレームの10:12など)である場合、この値は最も近いローソク足の時間に切り上げられます。さらに、ユーザーはすべての線のスタイル、色、幅を設定することができます。
これで良いトレードができることを願っています。 また、時間範囲に基づくPIVOTが必要な場合は、 他の製品をご覧ください 。
FREE

Displays a digital clock or a countdown (until new bar) in the chart in realtime.
Benefits: Current time always in sight for market open/close, economic data, etc. Displays accurate time (server/broker time) Keep an eye on how much time is left until a new bar starts (countdown) Clearly visible (set color, size, font, position) Always runs/refreshes every second even without new price tick Hint: To display the most accurate time, use the server (broker) clock setting combined with the time (hou
FREE
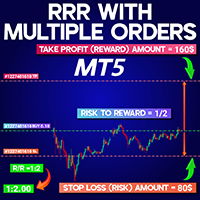
RRR with Multiple Orders Indicator MT5 The RRR with Multiple Orders Indicator MT5 is a powerful utility in the MetaTrader 5 platform that calculates and displays the risk-to-reward ratio for active trades. Especially useful for traders who manage several open positions simultaneously, this indicator helps monitor and control risk exposure more effectively. It shows the R/R values clearly inside a box located in a corner of the chart window, making real-time evaluation of trades easier. «Indicato
FREE

Hello
I Want to introduce The Forex Buy Sell Arrow Premium MT5
i recently release this premium indicator!
its 1000% Non Repaint Indicator,
It Work Perfectly Well,, i tested it day by day, Just mind blowing Result,
Including Powerful trend Algorithm!
How It Work?
well, it work market trend formula, when trend Bullish Or when trend Bearish,
Recommend Timeframe M30, H1 it work all timeframe, and all currency pair,
100% non repaint,
How to take signal From Forex Buy Sell Arrow Premium Ind

Target currency: XAUUSD Time frame: 1H
This Expert Advisor aims to respond to various market situations by combining four different strategies.
It does not use any methods such as martingale or grid trading. It is also not a scalping EA.
It uses technical indicators such as KAMA, Aroon, ADX, Ulcer Index, Bollinger Bands, and Ichimoku to capture highly accurate entry opportunities.
Strategy Overview: Trend-Following Strategy (Strategy 1): Combines KAMA and Aroon to capture and follow the ear

German Snowball は、ドイツ株価指数のみで動作します。ブローカーはこの商品を、DAX、DE40、GER40、GER30、GER40Cash など、異なる名前で呼んでいます。使用するには、EA を適切なチャートに添付すると、契約サイズ、最小ボリューム、ロットサイズ (エクイティに応じて) が処理されます。トレーリング ストップ ロスを使用して。
この EA の最適なパラメーターは、2021 年 3 月 22 日から 2025 年 3 月 22 日 (2025 年 3 月 25 日現在) までの履歴ティック データを使用して取得されました。ただし、この EA は、より最近のティック データに対してより適切に動作するように最適化されています。理論的には、リスク乗数を 1.0 に維持すると、リスクを抑えながら毎月 10% を超えるリターンが得られるはずです。
この EA の勝率はわずか 51% です。ただし、強いトレンドのセッションでは、1 つのチャンクで大きな利益が得られます。
バックテストおよびリアルタイム取引中は、「isLive」プロパティをオンにすることを忘れないで

Always backtest before using.
MintyGrid is a simple EA that does not use indicators. On winning trades MintyGrid will take profit based on configuration. On losing trades MintyGrid uses a grid strategy to place resistance points using a martingale/reverse-martingale strategy to be prepared for when the market swings in the opposite direction. MintyGrid always trades within its grid configuration. Recommended usage is on a cent account with at least 100 EUR (10000 Euro Cents) and high leverage.
FREE

MetaCOT 2 is a set of indicators and specialized utilities for the analysis of the U.S. Commodity Futures Trading Commission reports. Thanks to the reports issued by the Commission, it is possible to analyze the size and direction of the positions of the major market participants, which brings the long-term price prediction accuracy to a new higher-quality level, inaccessible to most traders. These indicators, related to the fundamental analysis, can also be used as an effective long-term filter

Includes almost all the concepts related to Volume Profile: POC , Value Area , Developing POC , Anchored VWAP , Volume Delta ; since the “Total” in its name. It is fast in its calculations and simple to work with.
Features:
1. Selectable calculation timeframe to find most traded levels.
2. Capable of calculating Volume Profile based on tick data
3. Adjustable histogram bars by their count.
4. Adjustable histogram bars by their height (price range).
5. Showing Value Area (VA

ツインピークインジケーターMT5へようこそ --(ダブルトップ/ボトム)-- ダブルトップアンドボトムインジケーターは、市場の潜在的な反転パターンを特定するために設計されたテクニカル分析ツールです。
これは、価格がほぼ同じ高さの 2 つの連続した山または谷を形成し、その後、反対方向に価格が変動した領域を特定します。
このパターンは、市場が勢いを失いつつあり、トレンド反転の準備ができている可能性があることを示しています。 ※購入後、 説明書と手順ガイドをお送りしますのでご連絡ください。 特徴:
チャートの自動注釈: インディケータはチャート上のダブルトップとボトムのパターンを自動的にマークします。 使いやすさ: このインジケーターはユーザーフレンドリーで、MT5 プラットフォームのどのチャートにも簡単に適用できます。 カスタマイズ可能: インジケーターにはカスタマイズ可能な設定があります カスタマイズされたアラート 。 あらゆる楽器で動作します。 このインジケーターを他のテクニカル分析ツールと組み合わせて使用すると、トレンドの方向と反転パターンの潜在的な強さを確認できま

<p><b>3 ICTの力</b> は、低いタイムフレームで取引を行う際にHTFを監視するための最高のツールです。このインジケーターは、LTFチャートに最大2つの異なるHTFキャンドルを表示することを可能にし、それにより、常に現在の価格動向が高いタイムフレームでどのように見えるか、そして高いタイムフレームのトレンドに従って取引を行っているかどうかを把握できます。</p>
<div class="atten"> <p><a href=" https://www.mql5.com/en/blogs/post/758051 " title=" https://www.mql5.com/en/blogs/post/758051 " target="_blank">このインジケーターを使用してICT/流動性の概念を取引するには? </a></p> </div> <p> </p>
<h3>3の力で何ができますか?<br> </h3>
<p>高いタイムフレームの現在のキャンドルを確認し、主要なトレンドを簡単に把握できます。また、必要なだけの過去のキャンドルを表示し、
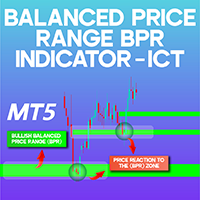
Balanced Price Range BPR Indicator ICT MT5 The Balanced Price Range BPR Indicator ICT MT5 is a specialized tool within the ICT trading framework in MetaTrader 5. This indicator detects the overlap between two Fair Value Gaps (FVG), helping traders identify key price reaction areas. It visually differentiates market zones by marking bearish BPRs in brown and bullish BPRs in green, offering valuable insights into market movements. «Indicator Installation & User Guide» MT5 Indicator Installation |
FREE

Introducing the Quasimodo Genie, a powerful indicator for MetaTrader 5 that automatically identifies the Quasimodo or Over and Under pattern. This indicator is perfect for traders who want to take advantage of this popular chart pattern and make profitable trades. With the Quasimodo Genie, you can easily find the best swing points for the Quasimodo pattern and place virtual trades with stop loss and take profit levels. The Quasimodo Genie is easy to use and comes with a range of customizable set
FREE
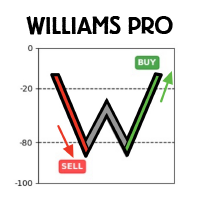
Williams pro は、市場向けに設計された自動取引システムであり、健全な取引原則に基づいて構築されています。 そこにある他の多くの取引システムとは異なり、グリッドシステムやマーチンゲール戦略に依存していません。これは、しばしば危険で予測不可能な取引につながる可能性があります. 代わりに、このアルゴリズムは、市場の勢いを測定し、潜在的な売買の機会を特定するのに役立つ、信頼性が高く効果的なテクニカル指標を使用します。 取引アルゴリズムは、ウィリアムズ % R インジケーターを使用して正確なエントリーを行い、指数移動平均を高値と安値に適用し、平均真範囲をタイムリーなエグジットに使用します。 取引が正しい方向に動く場合、アルゴリズムはストップを修正して損益分岐点にします。 USDJPY M30 でこの取引ロボットを使用することをお勧めしますが、もちろん、他の勢いのある商品や他の時間枠でも使用できます。 表示されているバックテストは、2019 年から 2023 年までの USDJPY M30 で行われています。バックテストは、デフォルトのパラメーターを反映しています。

Extremum Scalper is a fully automated Expert Advisor, that uses a dynamic MM, probabilistic analysis and also strategy of breakout/rebound from the levels of daily and local extremes, and the candlestick Highs. The price Highs and the tick volume serve as the analyzed parameters. Works in different markets with all trade execution modes. Does not use martingale or hidden methods of increasing the position volume. The EA has 9 different extremum calculation algorithms. Uses a drawdown protection,
FREE

The Period separators indicator separates time periods, specified by user.
It supports all timeframes, greater or aliquot to current timeframe. In case of the incorect timeframe, the indicator modifies it to closest correct value. Additional bonus - the separation of non-standard time periods - MOON, MOON/2, MOON/4 (moon phases). The separators are plotted using the indicator's buffers. The indicator uses one graphic object for information about the progress and current bar properties. The graph
FREE

This trading robot is designed to help you automate your trades effectively, based on the powerful RSI indicator. While the robot has the potential to generate profits, it’s important to remember that losses are also a natural part of trading. Important Notes: The robot is optimized for the 1-hour timeframe . Make sure to always run it on this timeframe for the best results. To achieve optimal performance, let the robot run without manual interference. It works best when allowed to operate fully
FREE

Pro tren entri premium
Logika TZ Trade, menehi sampeyan, versi apik saka entri tren Premium
Rilis iki, bakal nggawa sampeyan kahanan dagang sing luwih santai kanthi fitur canggih kanggo nyaring tren lan wektu mlebu sinyal premium.
Kanggo kita, dudu nggawe produk sing penting! nanging pangopènan lan pendhidhikan terus kanggo pangguna. liwat sarana khusus kanggo nggayuh kita, sampeyan bakal nemokake pandhuan cedhak babagan cara nggunakake produk lan latihan liyane sing gegandhengan karo dagang
FREE

This indicator recognizes a special type of Inside Bar formation which is formed by a big Master candle followed by 4 smaller candles (please see the strategy explanation below). Features Plots buy/sell stop lines on the chart as well as well as take profit and stop loss levels. The TP/SL levels are based on the Average True Range (ATR) indicator. Object colors are changeable. Sends you a real-time alert when a Master candle formation is identified - sound / popup / email / push notification. On

A new unique trading strategy Stock Index Trader, has been introduced, designed for trading the US30 index. The trading robot works on the timeframe (M30, H1) . The strategy does not use indicators with the exception of stop loss and take profit (floating, works according to ATR). The strategy works on Candlestick patterns, such as Piercing lines - a reversal pattern of Japanese candlesticks with additional installed filters and other popular patterns. The advisor does not use grid or martingale
FREE
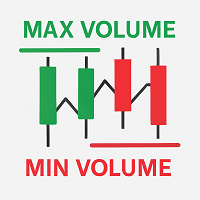
MaxVolumeTrendLines
This indicator visualizes the bars with the highest tick volume for each trading day, highlighting price levels where buyers or sellers showed notable activity. Description MaxVolumeTrendLines automatically detects the bar with the highest tick volume within each day (for a selected number of days) and displays horizontal lines on the chart: Green line at the Low — for bullish bars (close above open). Red line at the High — for bearish bars (close below open). Line thicknes
FREE

The provided code is an example of an Expert Advisor (EA) written in MQL5, a programming language used for creating algorithmic trading systems in MetaTrader 5. Here is a breakdown of the code:
The code begins with various input parameters and settings defined using the input keyword. These parameters allow customization of the EA's behavior, such as entry lots, stop loss, take profit, and indicator parameters.
Several constant values and variables are declared, including session time setting
FREE

White label available. contact us for more info. dushshantharajkumar@gmail.com Chart Walker X Engine | Machine-led instincts Powerful MT5 chart analysis engine equipped with a sophisticated neural network algorithm. This cutting-edge technology enables traders to perform comprehensive chart analysis effortlessly on any financial chart. With its advanced capabilities, Chart Walker streamlines the trading process by providing highly accurate trading entries based on the neural network's insights.
FREE

Genaral: Not martingale, not a grid; Use on EURUSD Use on M5 EA was opimized only on 2020 year
Signals: There is a good rational algorithm. Work of 3 indicators: WRP, DeMarker, CCI (from 3 timeframes) (you can set a separate Timeframe for each indicator)
Stop Loss/Take Profit: There is a good money management system (there are several type for trailing stop loss); There is virtual levels of Stop Loss / Take Profit; There is smart lot (percent by risk) or fix lot
Important: EA can work on
FREE
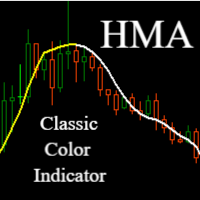
Hull Moving Average (HMA) - Faster and More Precise Trend Tracking
Hull Moving Average represents a revolutionary approach to trend analysis that overcomes the common shortcomings of traditional moving averages. This advanced indicator, developed by Alan Hull, practically eliminates the lag typical for standard moving averages while maintaining exceptional signal smoothness.
Key Benefits:
Significantly faster response to trend changes than traditional moving averages Minimal lag while mainta
FREE
MetaTraderプラットフォームのためのアプリのストアであるMetaTraderアプリストアで自動売買ロボットを購入する方法をご覧ください。
MQL5.community支払いシステムでは、PayPalや銀行カードおよび人気の支払いシステムを通してトランザクションをすることができます。ご満足いただけるように購入前に自動売買ロボットをテストすることを強くお勧めします。
取引の機会を逃しています。
- 無料取引アプリ
- 8千を超えるシグナルをコピー
- 金融ニュースで金融マーケットを探索
新規登録
ログイン