YouTubeにあるマーケットチュートリアルビデオをご覧ください
ロボットや指標を購入する
仮想ホスティングで
EAを実行
EAを実行
ロボットや指標を購入前にテストする
マーケットで収入を得る
販売のためにプロダクトをプレゼンテーションする方法
MetaTrader 5のためのエキスパートアドバイザーとインディケータ - 17

バスケットEAMT5 は、最高の利益ハーベスターであり、究極のアカウントプロテクターであり、すべてが1つの非常に使いやすいソリューションです。 バスケットEAΜΤ5 の背後にある考え方は、すべてのオープンポジションを合わせて、バスケットレベルでトレーディングアカウント全体の利益および/または損失を制御できるようにすることです。 これは、すべての管理されたポジションについて、口座残高のパーセンテージまたは口座通貨(金銭)で、バスケットテイクプロフィット、ストップロス、損益分岐点、およびトレーリングストップロス設定を提供します。 マジックナンバーやシンボルに応じて、特定の取引の管理または管理からの除外を可能にします。 また、アカウント保護設定を備えており、アカウントが利益を得るかストップロスのエクイティに達したときに、すべてのオープントレードを閉じ、すべての保留中の注文を削除し、すべてのチャートを閉じ、それらに添付されている他のEAを削除します。
ヒント:Basket EA MT5 デモバージョンをダウンロードして、デモアカウントで試すことができます: こちら ダウンロードした無

ケルトナーチャネルブレイクアウト戦略: Metatrader 5プラットフォーム向けに開発された取引ロボットは、ケルトナーチャネルブレイクアウト戦略を使用して自動的に動作するように設計されています。この戦略は、ケルトナーチャネルによって定義される市場のボラティリティに基づいてエントリーポイントとエグジットポイントを特定することを含みます。 主な機能: ケルトナーチャネルブレイクアウト : ロボットは、価格がケルトナーチャネルを突破する時点を特定し、買いポジションまたは売りポジションの機会を示します。 取引時間パラメーター : ロボットが操作を許可される特定の取引時間を設定することが可能です。これにより、異なる市場セッションに戦略を適応させ、流動性が低いまたはボラティリティが高い時点での取引を回避することができます。 日次利益または損失目標 : ロボットは日次の利益または損失目標を設定することができます。目標が達成されると、ロボットは市場へのさらなる露出を回避するために取引を終了することができます。 平均価格システム : 市場の逆行動が発生した場合、ロボットは取引のエントリー価格を改善す
FREE

The Volume Spread Analysis indicator is based on the original Volume Spread Analysis method. It was designed for quick and easy recognition of VSA patterns. Even though this indicator looks very simple, it is the most sophisticated tool we've ever made. It is a really powerful analytical tool that generates very reliable trading signals. Because it is very user-friendly and understandable, it is suitable for every type of trader, regardless of his experience.
What is VSA? VSA - Volume Spread

Lorentzian A.I Indicator System Revolutionize your trading strategy with the Lorentzian A.I Indicator System, an advanced tool designed for traders who demand precision and adaptability. Whether you're trading Crypto, Indices, Forex, or Stocks, this state-of-the-art indicator uses cutting-edge technology to keep you ahead of the market. Key Features: Advanced Lorentzian Classification (LC): Utilize sophisticated LC algorithms to generate precise buy and sell signals, ensuring you make informed
FREE

Currency Strength Meter is the easiest way to identify strong and weak currencies. This indicator shows the relative strength of 8 major currencies + Gold: AUD, CAD, CHF, EUR, GBP, JPY, NZD, USD, XAU. Gold symbol can be changed to other symbols like XAG, XAU etc.
By default the strength value is normalised to the range from 0 to 100 for RSI algorithm: The value above 60 means strong currency; The value below 40 means weak currency;
This indicator needs the history data of all 28 major curre

このライブラリを使用すると、任意の EA を使用して取引を管理でき、説明に記載されているスクリプト コードを使用して任意の EA に簡単に統合でき、完全なプロセスを示すビデオのデモ例も利用できます。
- 指値注文、SL 指値注文、利食い指値注文の発行
- マーケット、SLマーケット、TPマーケットの注文を行う
- 指値注文の変更
- 注文をキャンセルする
- 注文のクエリ
- レバレッジ、マージンの変更
- 位置情報の取得
もっと...
MT5 に Binance チャートがない場合を除き、暗号チャートのレンタルはオプションです。
スクリプトのデモについては、 ここをクリックしてください
トレーディングパネルでの取引をご希望の場合は、 この製品に興味があるかもしれません

This indicator displays pivot points in the chart, including historical vales, and supports many calculation modes for Pivot Points and S/R levels. [ Installation Guide | Update Guide | Troubleshooting | FAQ | All Products ] It plots historical levels for backtesting purposes
It allows you to select the reference timeframe It implements different Pivot Point calculation modes It implements different SR calculation modes
It implements customizable colors and sizes
Calculation Modes The indi
FREE

What is MACD?
MACD is an acronym for Moving Average Convergence Divergence .
This technical indicator is a tool that’s used to identify moving averages that are indicating a new trend, whether it’s bullish or bearish.
There is a common misconception when it comes to the lines of the MACD.
There are two lines:
The " MACD Line " The " Signal Line "
The two lines that are drawn are NOT moving averages of the price.
The MACD Line is the difference (or distance) between two moving
FREE

Defining Range ( DR ) and Implied Defining Range ( IDR ) indicator Pro with added features from free version
Show DR and IDR ranges Sessions on the chart for RDR Regular defining range (New York Session)
ADR After defining range (Asian session) ODR Outside defining range (London Session)
Buttons on chart to enable / disable :
Show Imbalance ( IMB ) Show Volume Imbalance ( VIB ) Show Gap's between open and close
Show Standard Deviation ( SD )
Show last 3 Sessions
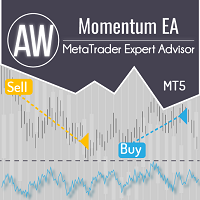
完全に自動化された取引システム。現在の値動きの方向に働きます。価格変動の継続方向のモメンタム指標レベルの内訳は、シグナルとして使用されます。取引の平均化と、バスケットの最初と最後の注文を閉じる機能を使用します。高度なダッシュボードと 3 種類の通知があります。 問題解決 -> こちら / MT4版 -> こちら / 説明書 -> ここ 利点:
バスケット注文の高度なフィルタリング 簡単なセットアップと直感的なパネル インターフェイス 完全自動取引システム
あらゆる種類の商品とあらゆる時間枠に適しています 3種類の通知があります 内蔵オートロット ストラテジー: ポジションオープン オシレーターレベルが下から上へのモメンタムの上限境界を破ると、EA はロングポジションを開きます。
EA は、上から下へのモメンタム レベルの下限境界線のブレイクアウトでショート ポジションを開きます。 ポジションを閉じる ポジションを決済するには、ポイント単位で仮想テイクプロフィットを使用します。仮想テイクプロフィットはブローカーには見えません
注文が損失になると、平均化

Please if possible consider the paid version which I will continue to develop (there will be no future updates for this free version).
This Expert Advisor identifies when a divergence occurs between price and an oscillator/indicator. It identifies both regular/classical (trend reversal) and hidden (trend continuation) divergences. It has RSI, bollinger, stochastics, moving average and ADX filter options which makes it possible to filter out only the strongest setups. The default settings ar
FREE

Fractals Dynamic Fractals Dynamic – これで、フラクタルダイナミックインジケーターに基づく、またはそれに基づくすべての取引戦略に追加のシグナルが表示されます。 さらに、フラクタルはサポートレベルと抵抗レベルとして機能することができます。 そして、いくつかの取引戦略では、流動性レベルを示しています。 この目的のために、このバージョンのマルチフラクタルおよびマルチフレームインジケータ MultiFractal Levels でレベルが導入されました。 あなたは、この指標は、より有益な視覚的かつ任意の価格チャート上のあなたの取引のアシスタントとして有用であることがわかります。 あなたの取引システムへの追加として Fractals Dynamic 指標を使用してください
また、市場で私の他の製品を試してみてください https://www.mql5.com/ru/users/capitalplus/seller
取引であなたのための大きな利益!
FREE

ONLY 3 COPIES OUT OF 10 LEFT AT $399! After that, the price will be raised to $499. IMPORTANT! Contact me immediately after the purchase to get instructions and Manual Guide to set up EA.
Forex EA Trading Channel: Update the latest news from me
You can make back testing Advanced AI Scalper in MT5 with multicurrency supporting.
- REAL SIGNAL: Prop firm 10k: https://www.mql5.com/en/signals/2215392
MT4: https://www.mql5.com/en/signals/1932653
Real operation monitoring as well as my o

O indicador criado por Didi Aguiar, o mestre das Agulhadas!
O padrão do indicador é o cruzamento de três médias móveis simples. Média rápida, período 3. Média normalizada, período 8. Média lenta, período 20.
Quando as três médias se cruzam próximas o suficiente, acontece a agulhada! Pela posição das médias é possível identificar: Agulhada de compra, agulhada de venda, ponto falso e beijo da mulher aranha.
Quer saber mais? Procure pelo site dos robôs oficiais da Dojistar: tradesystembots.co
FREE
Indicator that synchronizes the charts, that is, when the asset is replaced in one of the charts, all those that appear with the synchronized indicator are changed, with the same timeframe (Same_Timeframe = true) or with different timeframes (Same_Timeframe = false). The graphics to be synchronized are identified by color (Label). To synchronize the indicators, the indicator must be inserted in all charts to be synchronized, using the same color (Label). A box with the chosen color (Label) and

A utility to close all positions and orders with one simple click at once.
Various options are available to filter or select orders and positions : Type of orders/positions : Buy / Sell / Buy Limit / Sell Limit / Buy Stop / Sell Stop Symbol Selection : All / Chart Symbol / Custom Symbols. You can enter custom symbols separated by comma. (for example you can enter EURUSD,GBPUSD,AUDJPY) Order Open Type : Manual Opened / Opened by EA Magic Number : You can enter more than one magic number separat

Wolf Mother XT: The Premier EURUSD H1 Trading System Introducing Wolf Mother XT , the ultimate EURUSD H1 trading system designed for serious traders seeking consistent and impressive results. Built on a foundation of factual mathematics and logical strategies, this system ensures you stay ahead in the market. Key Features: 1:2 Risk-Reward Ratio: Every trade adheres to a strict 1:2 risk-reward ratio, with a 20-pip stop loss (SL) and a 40-pip take profit (TP), ensuring that winners significantly o

Attention: New update - 4 major practicality improvements!
1) Alarm 2) Midas text value 3) Click panel 4) Can be connected to an EA to operate in semi-automatic mode
Attention - This indicator does not work perfectly in backtest due to MT5 peculiarities (Reading hotkeys or panel clicks) . My suggestion is that you test Automatic Vwap Midas which has automatic operation to analyze the calculation and then buy Start if you think the indicator will match your operating.
This indicator i

The WAPV ADH Supply and Demand Forex Indicator is part of a set of Indicators called (Wyckoff Academy Wave Market) The WAPV ADH Forex Supply and Demand Indicator for MT5 is intended to identify the winning side between buyers and sellers. Its reading is very simple, when the green line is above the red line demand is in command, when the red line is above the green line supply is in command. The more positive the green and red lines, the higher the volume input, the closer to zero or negative, t

Super Trend Indicator for MetaTrader 5 - Elevate Your Trading Precision Experience the future of trading with the "Super Trend Indicator" designed for MetaTrader 5. This versatile tool is your key to precise market analysis, providing insights into potential trend directions that enhance your trading decisions. Basic Details : Indicator Type : Super Trend Indicator for MetaTrader 5 Key Metrics : Real-time analysis of market trends using a proprietary algorithm. Customization : Fully customizable

ONLY 3 COPIES OUT OF 10 LEFT AT $50! After that, the price will be raised to $200. EA with the idea of using the "High Risk - High Reward" strategy. You should use the EA with the same capital as my trading signal, withdraw profits regularly and only use lot size 0.01 no matter the capital. - REAL SIGNAL: https://www.mql5.com/en/signals/2151054
Real operation monitoring as well as my other products can be found here: https://www.mql5.com/en/users/tuanthang/seller
IMPORTANT! Contact me i

ARCA bot - a full-featured, non-syndicated, automated system that uses a time-tested grid strategy adapted to modern conditions. This methodology has appeared since the inception of the financial markets and is still used by many professional traders and hedge funds, as it has shown good results for decades. The expert is fully automated and must be on 24 hours a day to work, so we recommend to use VPS-server, which will provide uninterrupted work of the expert.
Characteristics: Platform: MT
FREE

With this easy to set up indicator you can display and set alerts for the following candlestick formations: Bull Breakout, Bear Breakout, Hammer, Pin, Bullish Engulfing, Bearish Engulfing. Input parameters: ShortArrowColor: The color of the Arrows, displaying a Bearish candle formation LongArrowColor: The color of the Arrows displaying a Bullish candle formation BullishEngulfing: Disabled/Enabled/EnabledwithAlert BearishEngulfing: Disabled/Enabled/EnabledwithAlert Pin: Disabled/Enabled/Enabledw
FREE
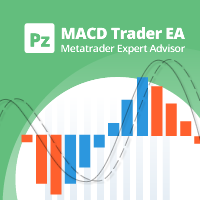
This EA is a flexible and powerful metatrader expert advisor that trades using the MACD indicator and implements many useful features. It can trade using the MACD indicator alone, or donchian breakouts confirmed by the MACD indicator from any timeframe. Additionally, it offers a martingale feature and forex session filters. [ Installation Guide | Update Guide | Troubleshooting | FAQ | All Products ] Easy to use and supervise Fully configurable settings Customizable break-even, SL, TP and traili
FREE

ChartWall is intended for displaying and automatic changing of wallpapers on a chart. It supports JPG and BMP formats. A file and a display style are selected via the built-in panel, which can be opened by clicking on the application icon (hidden button) that appears in the bottom left corner of the chart (main window) as you move the cursor to that area. Using the built-in panel you can also set a period for the rotation of images in minutes. Image files are selected randomly from the folder t
FREE

Introduce: This Expert Advisor Is Hedging Style Buy or Sell Market Then Pending Buy with Hedge Distance Your Setup at begin if Sell site, Sell Pending if Buy Site. I recommend you if you want to use hedge robot please ask your broker first if they allow to use hedge trading so then you can use this robot. My default setup for XAUUSD,M15,1000usd Balance if you guys need to run with forex currency pairs just backtest seeking a best setup for each pairs because pips point are not the same each ot
FREE

Trade Controller provides multiple methods to protect and maximize your profits. This powerful weapon helps you to set the protect and trailing-stop rules on your trade automatically in many effective methods. Once it is set and turned on, you don't need to monitor your orders anymore, the software will keep watching and control your orders with your predefined rules. It's designed to support multi-protection and trailing strategy: Protect by break-even, protect by percentage, protect by pip, pr

インディケータを使用すると、現在の価格の方向性と市場のボラティリティを判断できます。このバージョンのTradersDynamic Indexでは、履歴データの再描画が排除され、アルゴリズムの計算速度が最適化され、より正確な調整のための外部パラメーターが増え、その機能が拡張されました。初期オシレーターの選択と平均の平滑化方法が追加されました。 。 パラメーター: Mode Osc - 推定発振器の選択 Period Osc - 使用する発振器の計算期間 Price Osc - 振動計算の適用価格 Osc volatility bands period - オシレーターのボラティリティ期間 Osc volatility bands multiplier - オシレーターのボラティリティ乗数 Smoothing Osc price line period - 本線の平滑化期間 Smoothing Osc price line method - 本線の平滑化方法 Smoothing Osc signal line period - 信号線の平滑化周期 Smoothing Osc signal

指標の紹介 このインジケーターは移動平均式に従って設計されており、RSI や CCI よりも安定しており、遅れが少ないです 。このインジケーターには 3 つのインジケーター値、移動平均期間、および線の色があり、手動で変更できます。 このインジケーターは何をもたらすのでしょうか? 正確なエントリーシグナル: インジケーターは上下の矢印シグナルを描画します。 複数期間のトレンド分析: このインジケーターを大きな時間枠チャートと小さな時間枠チャートにロードすると、使用の効果が向上します。大きな時間足チャートではインジケーターの色に従ってトレンドの方向を判断し、小さな時間足チャートではシグナルに従って市場にエントリーします。 高価格と安値セクションの判断: インジケーターの値は常に 0 から 100 の間であり、これに基づいて価格の相対的な位置を分析できます。トレンドラインが 80 より高い場合、価格が買われ過ぎのセクションにある場合、買いポジションをオープンする機会を選択できます。トレンドラインが 20 を下回っている場合、価格は売られ過ぎの セクション にあり、売りポジションをオープンす
Strategy description The idea is to go with trend resumption. Instruments Backtest on XAUUSD shows profitability over a long period even without any specific optimization efforts. However applying optimization makes it even better.Backtest details: Simulation Type=Every tick(Most accurate) Expert: GoldScalper Symbol: XAUUSD Period: H1 (2020.01.01 - 2023.02.28) Inputs: magic_number=1234 ob=90.0 os=24.0 risk_percent=2.64 time_frame=16385 Company: FIBO Group, Ltd. Currency: USD Initial Deposit: 100
FREE

SonicTradeCopier: (Best for scalping)
Easy Fast Reliable trade copier. Copy trades from one terminal to an other (internet copy feature coming soon.)
MT4 to MT4. MT4 to MT5. MT5 to MT5. MT5 to MT4. MT4/MT5 to any other platform copy possibility for custom made solutions. Reverse trading. Advance filters for traders.
Features:
(Setting up copying policies) Sender only has to setup signal name and start sending signals [ You must start signal sender first always ]. Receiver sets up sig

無限からの通貨の強さを測定するためのこの革新的な指標は、長い間取引されているダフ屋やトレーダーにとって不可欠な助手です。 通貨の強さ/弱さを分析するためのシステムは、世界の主要なトレーダーによって市場で長い間知られており、使用されてきました。 任意の裁定取引は、この分析なしでは完全ではありません。 私たちの指標は、互いに関連して基本通貨の強さを簡単に決定します。 これは、インスタント分析を可能にし、最強のエントリポイントを検索し、すべてまたは現在の通貨ペアの折れ線グラフが表示されます。 インジケータは直感的で、すぐに見つけて任意のペアに切り替えることができ、地下室とメインチャートの両方に配置できるモバイルパネルがあります。 通貨の強さの変化の通知のタイマーモードは、トレーダーに電話で通知を受け取る機会を与えます。
通貨パワーメーターインフィニティ指標を使用するためのいくつかの戦略:
1. 通貨の強さの線形表示のチャートを使用して、交差点を新興トレンドの信号として検索します 2. トレンド反転信号が表示された後、強い通貨の方向に頭皮 3. 通貨の強さの発散分析を使用して、
FREE

BOOSTER FOR MT5は、FOREX市場での日常業務のためのプロのスカルパーアドバイザーです。取引では、経験とともに、トレーダーは通常、ストップ注文の蓄積レベル、価格、時間が市場で重要な役割を果たすことを理解するようになります。この戦略は、このFOREX Expert Advisorで実装されており、この製品の使用を楽しむだけでなく、その開発にも参加していただければ幸いです。フィードバックは、https:// www.mql5.com/en/に残してください 。市場/製品/ 45915#!タブ=レビュー
MT4バージョン:https:// www.mql5.com/en/market/product/45915
オプション:
価格-割り当てられた期間内にトラバースする必要がある価格の距離。 TIME-割り当てられた時間(秒単位)。 HL_PERIOD-レベルを決定するためのバーの数。 HL_TIMEFRAME-レベルを決定するための時間枠。 BREAKTHROUGH_LEVEL-レベルを突破した後に注文を開きますか?; MAGIC_NUMBER-取引のマジ

Custom Spread Indicator *Please write a review, thanks!
Also MT4 version is available
Spread Indicator show the current spread in pips with color codes. Handle 3 levels, Low, Medium, High. You can set levels and colors for each level (eg. Low: Green, Medium: Orange, High: Red), and can choose display position on the chart.
There is two spread calculation mode: -> Server spread value -> Ask - Bid value
Can set opacity, for better customization. When spread jump bigger, then display do
FREE

UPON PURCHASE/ RENTAL CONTACT US FOR TPL FILE AND FINAL SETUP ON : https://t.me/Volatility_Pips
Ghost Entry System allows for sniper entries at trend inception . Automatic trade management - Opens and closes trades automatically with 1 CANDLE SL Embrace a relaxed way of managing your trading account with Trailing , Break Even an Stop Loss integration .
Why choosing ATM EA : Easy Installation and compatible with MT5 Platform Precise Signals on M5 Timeframe making the system fast in

スイープパターン 最先端のツールは、弱気トレンドの回転と強気トレンドの回転の両方を比類のない精度で識別するように設計されています。
情報に基づいた取引の決定を下し、市場の一歩先を行くことができます。 MT4バージョン: WH Sweep Pattern MT4 スイープパターンの特徴:
自動的に検出し、さまざまな色とスタイルを使用して、チャート上に弱気と強気のトレンド ローテーションを描画します。 アラート (サウンド、電子メール、プッシュ通知) を送信し、チャート上に矢印を描画するので、取引シグナルを見逃すことはありません。 あらゆる通貨ペア、時間枠、市場状況に対応し、取引武器として多用途で信頼性の高いツールを提供します。 カスタマイズ可能なパラメーターを使用して、インジケーターを特定の取引設定に合わせて調整します。
市場のローテーションに不意を突かれないようにしてください。スイープ パターン インジケーターを使用して取引戦略を強化すると、弱気トレンドの反転または強気トレンドの反転を簡単に見つけることができます。
あなたが経験豊富なトレーダーであろうと、初心者で

AW スーパー トレンド - これは、最も人気のある古典的なトレンド インジケーターの 1 つです。シンプルな設定で、トレンドだけでなく、このインジケーターによって計算されるストップロスレベルも表示できます。 利点:
楽器: 通貨ペア 、株、商品、指数、暗号通貨。 時間枠: М15 以上。 取引時間:24時間。 現在のトレンドの方向を示します。 ストップロスを計算します。 取引を行うときに使用できます。 3 種類の通知: プッシュ、メール、アラート。 MT4版 -> HERE / ニュース - HERE 機能:
インジケーターは、現在のトレンド方向を対応する色で表示します。
- 青色は、現在の時間枠で使用されているシンボルの上昇トレンドを示します。
- 線の赤い色は、選択したシンボルで使用された時間枠の下降トレンドを示します。
インディケータはストップロスを設定するために使用できます。
指標線はバーの上ではなく、バーに対していくらかシフトして表示されます。トレンド ラインが表示されるこの場所は、トレーダーがストップ ロスを設定するために使用で
FREE

The price of this expert will increase with each update. Rango Gold EA is a fully automated robot with heavy calculations based on a number of strategies, including patterns and indicators combined with some trading skills gained over years of trading experience and then optimized on XAUUSD(Gold) . Advantages : Rango is not suffix sensitive because the code for automatic suffixs is built into it News filter to protect account when publishing news. Spread filter to protect against fluctuations i

Probability emerges to record higher prices when RVi breaks out oscillator historical resistance level. It's strongly encouraged to confirm price breakout with oscillator breakout since they have comparable effects to price breaking support and resistance levels; surely, short trades will have the same perception. As advantage, a lot of times oscillator breakout precedes price breakout as early alert to upcoming event as illustrated by last screenshot. Furthermore, divergence is confirmed in
FREE

ピン バー ディテクターは、チャート上のピン バーの価格行動パターンを見つけるインジケーターです。ピン バーは、「ピノキオ バー」のショートカットです。これは、ドラゴン フライ童子、墓石童子、ハンマー、倒立ハンマー、ハンギング マン、シューティング スターなど、上部または下部に高い影と非常に小さなボディを持つ、日本のローソク足に代わる古典的なバー パターンです。 .
期間限定オファー : インジケーターは、わずか 50 $ で生涯ご利用いただけます。 ( 元の価格 125$ )
主な機能 強気のピンバー検出器。 弱気ピンバー検出器. 100% 無料インジケーター。 すべての時間枠で作業します。 すべてのペアで作業します。
コンタクト 質問がある場合、またはサポートが必要な場合は、プライベート メッセージでご連絡ください。
警告 すべてのインジケーターとツールは、公式のメタトレーダー ストア (MQL5 マーケット) からのみ入手できます。
プレミアム指標 MQL5 プロファイルにアクセスすると、すべての無料およびプレミアム インジケーターを見つけることがで
FREE

Buy Sell Signal Low TF gives buy/sell signals and alerts with up and down arrow at potential reversal of a pullback or a trend continuation pattern in low timeframe. This is an indicator which gives signals based on trend => It works best in trend market with the principle is to ride on the trend not trade against the trend.
The components of Buy Sell Signal Low TF: - The trend is determined by SMMA 13 , SMMA 21 and SMMA 35 ( can be changed manually to suit your preference). - The signal is
FREE

Build your EA with Build EA, with it you can build your strategy with the available indicators and tools.
Build EA does not have any defined strategy, but with it you can use combinations of indicators and use them as signals or filters along with the available tools and build your strategy!
Indicators available: adx Alligator Bollinger Bands bear power Bull Power CCI crossing of means dx Envelope Stochastic fractal macd OBV Parabolic SAR return to mean Fibonacci retracement Rsi Standard De

The Weis Wave Chart for MT5 is a Price and Volume indicator. The Price and Volume reading was widely disseminated through Richard Demille Wyckoff based on the three laws created by him: Supply and Demand, Cause and Effect and Effort vs. Result. In 1900 R.Wyckoff already used the wave chart in his analyses. Many years later, around 1990, David Weis Automated R. Wyckoff's wave chart and today we bring you the evolution of David Weis' wave chart. It shows the amount of Volume and the amount of pips

** All Symbols x All Time frames scan just by pressing scanner button ** ***Contact me after the purchase to send you instructions and add you in "Swing scanner group" for sharing or seeing experiences with other users. Introduction: Swing Scanner is the indicator designed to detect swings in the direction of the trend and possible reversal swings. The indicator studies several price and time vectors to track the aggregate trend direction and detects situations in which the market is o

Max Min Reversal Arrows MT5 - an arrow reversal indicator for predicting price movement. The indicator is built on the support and resistance levels at the local lows and highs of the price. Product features
Arrows appear on the current candle. The indicator does not redraw.
Can be used on all time frames and trading instruments. Recommended timeframes to use M30, H1, H4.
The dotted lines are the support and resistance levels within the signal. Price movement from these levels means a reve

強力なNRTR(Nick Rypock Trailing Reverse)インディケーターをご紹介します。トレンドの反転を特定し、効果的なトレーリングストップレベルを設定することを目指すトレーダーにとって必須のテクニカルツールです。ニック・ライポックによって開発されたこのインディケーターは、常に変化する市場条件に適応する独自のアルゴリズムを採用しており、どんなトレーダーのツールキットにも欠かせない存在となっています。
以下は、トレーダーがこのインディケーターを使用する人気のある方法です:
1. トレンドの反転:NRTRインディケーターは、トレンドが反転する予兆があるときに明確なシグナルを生成します。インディケーターラインが価格チャートを交差することに注意し、トレンドの方向が変わる可能性を示します。
2. トレーリングストップ:NRTRは、トレンド市場で利益を保護する頼りになるトレーリングストップツールとしても機能します。価格が望む方向に動くと、NRTRラインが価格の下または上に動的に追随し、適応可能なストップロスレベルを提供します。
カスタマイズ可能なパラメータ:NR
FREE

Fair Value Gap Sweep is a unique and powerful indicator that draws fair value gaps on your chart and alerts you when a gap has been swept by the price. A fair value gap is a price gap that occurs when the market opens at a different level than the previous close, creating an imbalance between buyers and sellers. A gap sweep is when the price moves back to fill the gap, indicating a change in market sentiment and a potential trading opportunity.
Fair Value Gap Sweep indicator has the following
FREE

The Expert Advisor is only designed for manual trading. The EA sets stop loss and take profit for positions and pending orders on the current symbol. It also has trailing stop and breakeven functions.
Input Parameters Stop loss - stop loss value; Take profit - take profit value; Close all if profit reached the x percent of balance or - close all positions once the total profit reaches x percent of balance; close all if profit reached the x profit amount in currency - close all position
FREE

This is an indicator of trading sessions that can display all levels (Open-High-Low-Close) for four sessions . The indicator can also predict session levels. Sessions can be drawn with lines or rectangles (empty or filled), lines can be extended to the next session. You can easily hide/show each session by pressing hotkeys (by default '1', '2', '3', '4'). You can see ASR (Average Session Range) lines (default hotkey 'A'). This is similar to the ADR calculation, only it is calculated based on

A Heatmap with a Volume Profile is like a thermal imager or x-ray machine. It will help you to estimate the relative distribution of volume during the price movement and to understand the relationship between volume and price. Indicator Volume Profile "Volumos Maxima" is a powerful tool for analyzing this relationship. After simple experimentation with heatmap, you can find that each trading instrument has its own “ characteristic ” way of distributing volume. And this will help you to make a b

Multicurrency and multi-timeframe indicator Inside Bar (IB). In the parameters, you can specify any desired currencies and timeframes. The panel displays the last found Inside Bar (and Mother Bar) pattern, the current price position and the breakout of the levels of the Mother and Inside Bars. You can set the size and color for bars and text in the cells. The indicator can also send notifications when levels are broken. By clicking on a cell with a period, the specified symbol and period will b

A professional tool for trading - the divergence indicator between the RSI and the price, which allows you to receive a signal about a trend reversal in a timely manner or catch price pullback movements (depending on the settings). The indicator settings allow you to adjust the strength of the divergence due to the angle of the RSI peaks and the percentage change in price, which makes it possible to fine-tune the signal strength. The indicator code is optimized and is tested very quickly as par
FREE

The Trend Forecaster indicator utilizes a unique proprietary algorithm to determine entry points for a breakout trading strategy. The indicator identifies price clusters, analyzes price movement near levels, and provides a signal when the price breaks through a level. The Trend Forecaster indicator is suitable for all financial assets, including currencies (Forex), metals, stocks, indices, and cryptocurrencies. You can also adjust the indicator to work on any time frames, although it is recommen

Circadian は、3 つの通貨ペア間の価格相関を使用して機能する三角裁定取引のエキスパート アドバイザーです。
エキスパートは一度に 3 ペアを取引し、これらは 1 つのセットにグループ化されます。 セットはカスタム順列計算ツールを使用して検索するか、デフォルトの選択から選択します。
同期された裁定取引の機会を探すために各セットに 1 分 20 秒が割り当てられ、有効なシグナルが見つかるとセットがロックされ、3 つの取引が開始されます。
このアルゴリズムには、セット内のすべてのペアを自動的に管理する動的なテイクプロフィットおよびバスケットクローズロジックが装備されています。
シグナルとグループチャット: https://www.mql5.com/en/users/conorstephenson エキスパートの概念と 各入力の説明の詳 細については、ユーザー ガイドを確認してください セットアップに関するアドバイスや無料のエキスパートアドバイザーについては、ご購入後に私にご連絡ください。 私の製品は MQL5 でのみ販売されています

The Expert Advisor for this Indicator can be found here: https://www.mql5.com/en/market/product/115567 The Contraction/Expansion Breakout Lines with Fair Value Gaps (FVGs) Indicator for MetaTrader 5 (MT5) is a powerful technical analysis tool designed to help traders identify and visualize breakouts at critical levels of contraction and expansion in financial markets. By incorporating Fair Value Gaps (FVGs), this indicator enhances traders' ability to gauge market sentiment and anticipate poten
FREE

this is a highly profitable semi-auto grid strategy.
MT4 Version
======== Usage======== :
Symbol: Any Main pairs Timeframe: H1 or higher Recommend Lots: 0.01 per 1000 USD
Note: Grid strategy is alwasy with some risk due to the increasely accumulated risk lots. but the high profit makes such strategy still being popular no matter how forex industry developed.
semi-auto trading should be the best way to equilibrate profit and risk. this EA has integrated many useful options for user t
FREE

One of the most powerful and important ICT concepts is the Power of 3. It explains the IPDA (Interbank Price Delivery Algorithm) phases. PO3 simply means there are 3 things that the market maker's algorithm do with price:
Accumulation, Manipulation and Distribution
ICT tells us how its important to identify the weekly candle expansion and then try to enter above or below the daily open, in the direction of the weekly expansion.
This handy indicator here helps you keep track of the weekly

Introducing Deriv Future Bot: Your Ultimate Deriv Trading Companion Deriv Future Bot represents the pinnacle of automated trading technology, designed to navigate the complex landscape of the Indices market with precision and efficiency. Leveraging advanced algorithms and sophisticated strategies, this cutting-edge trading robot offers unparalleled insights into the dynamic world of currency exchange. FEATURES At the core of Deriv Future Bot's strategy lie two key candlestick patterns, meticulou
VR Template Switcherは、MetaTraderターミナルのチャートテンプレートを管理するための強力なユーティリティです。テンプレートのダウンロード、保存、削除など、多くの作業を行う必要がなくなります。 VR Template Switcherユーティリティは、すべてのインジケータ、レベル、設定を含む現在のチャートテンプレートを保存し、ワンクリックですべてのテンプレートを読み込むことができます。 さまざまな金融商品のテンプレートはありますか?VR Template Switcherは、テンプレートの読み込み時に必要な期間と金融商品を設定できます。 VR Template Switcherには追加機能が搭載されています。 グラフテンプレートの自動保存 テンプレートのバックアップ機能 PC上の他のMetaTraderターミナルとチャートテンプレートを同期させる機能 チャートテンプレートを変更すると、新しいテンプレートだけでなく、チャートの期間や金融商品もすぐに変更してダウンロードすることができます。 このユーティリティーは、すべての設定、インジケータ、レイアウトを含むテンプ

RSI Colored Candlesへようこそ。この革新的なインジケーターは、相対力指数(RSI)を直接価格チャートに統合し、従来のRSIインジケーターとは異なり、四色のカラースキームを使用してRSIレベルを直接ローソク足に表示します。一目で価値ある洞察を提供します。 特徴と利点: スペース節約デザイン: 混雑したインジケーターウィンドウにさようなら! RSI Colored Candlesは、別個のRSIウィンドウの必要性を排除し、より清潔で簡素な取引体験を提供することで、貴重なチャートスペースを節約します。 オーバーボートおよびオーバーソールドゾーンの視覚的表示: ローソク足で直接オーバーボート(赤いキャンドルで表される)およびオーバーソールド(青いキャンドルで表される)の状態を簡単に識別します。この視覚的表示により、より良い取引の決定を下し、逆転の可能性を最大限に活用できます。 改善されたエントリーシグナル: 色分けされたキャンドルをトレーディングシグナルとして使用し、青いキャンドルが買いの機会を示し、赤いキャンドルが売りの機会を示すようにします。この直感的なアプローチは、RS
FREE
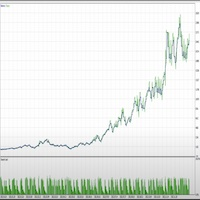
** For MT4 version, please go to https://www.mql5.com/en/market/product/112577 Backtested with Broker: Pepperstone Demo Symbol: EURUSD Time period: M5 Date: 2022-01-01 to 2022-12-31 Version: 1.70 --- Setup explanation for RTB or MetaTrader: https://www.youtube.com/live/HmM4rWT49M8?si=SISPJ5DvW9iazOBE&t=3865 Parameter explanation: https://kelvinausoftware.com/rtb-parameter-explanation/ --- Introducing the Realistic Trading Bot (RTB) – Your Trusted Trading Companion! Are you looking for a powe

Boom Scalper Gold It is an indicator, programmed to scalp in a timeframe of 1/5 and 15 Minutes, perfect for hunting spikes and trend sails, where in the parameters of (70) it sends you a sale/sell alert and in the level parameter (8) it sends you a buy signal It is used for indices (BOOM) of synthetic indices (Deriv) It's easy and simple to use, it does all the work by sending you the alerts! the indicator during this period will remain on SALE! Without further ado, enjoy! Good profit. World Inv

Hello Seasonal Traders! The seasonality trading strategy works because the smart money is doing the same thing every single year more often than not. The month of the year or the day of the week and the time of the day can call the shots in any market. The seasonal cycle is another useful tool in your trading arsenal. I'm not saying to trade solely off of seasonality and forget anything else. I'm only giving you another trading tool that you can incorporate into your own trading strategy to ga

ツインピークインジケーターMT5へようこそ --(ダブルトップ/ボトム)-- ダブルトップアンドボトムインジケーターは、市場の潜在的な反転パターンを特定するために設計されたテクニカル分析ツールです。
これは、価格がほぼ同じ高さの 2 つの連続した山または谷を形成し、その後、反対方向に価格が変動した領域を特定します。
このパターンは、市場が勢いを失いつつあり、トレンド反転の準備ができている可能性があることを示しています。 ※購入後、 説明書と手順ガイドをお送りしますのでご連絡ください。 特徴:
チャートの自動注釈: インディケータはチャート上のダブルトップとボトムのパターンを自動的にマークします。 使いやすさ: このインジケーターはユーザーフレンドリーで、MT5 プラットフォームのどのチャートにも簡単に適用できます。 カスタマイズ可能: インジケーターにはカスタマイズ可能な設定があります カスタマイズされたアラート 。 あらゆる楽器で動作します。 このインジケーターを他のテクニカル分析ツールと組み合わせて使用すると、トレンドの方向と反転パターンの潜在的な強さを確認

MT4 Version: https://www.mql5.com/en/market/product/117910
BTC Sunrise is a fully automatic robot for BTCUSD/BTCUSDT The robot applies a scalping strategy with high volatility optimized for Bitcoin. The advisor's algorithm uses market strength and recurrency to place orders between the NY market close and the Oceania market open. Orders are settled with take profit, stop loss, and Expert Advisor settings are optimized for brokers with spreads within 25USD. Slight optimization of input paramet

Aura Absolute is a unique grid expert based on deep machine learning, hyperparameter search technology. In machine learning, hyperparameter optimization or tuning is the problem of choosing a set of optimal hyperparameters for a learning algorithm. A hyperparameter is a parameter which value is used to control the learning process. By contrast, the values of other parameters (typically node weights) are learned. The same kind of machine learning model can require different constraints, weights o

"TPA Sessions" indicator is a very important tool to complement "TPA True Price Action" indicator . Did you ever wonder, why many times the price on your chart suddently turns on a position you can't explain? A position, where apparently no support or resistance level, or a pivot point, or a fibonacci level is to identify? Attention!!! The first run of the TPA Session indicator must be in the open market for the lines to be drawn correctly.
Please visit our blog to study actual trades wit

インジケーターは現在のシンボルの利益(損失)を表示します。 線を自由にドラッグ&ドロップして現在の損益を表示できます。
パラメーター
Calculation in money or in points — 損益をポイントまたは金額で計算します。 Add pending orders to calculate — 計算では未決注文を考慮します。 Magic Number (0 - all orders on symbol) — 特定の注文を評価する必要がある場合のマジック ナンバー。 Offset for first drawing (points from the average price) — 最初の開始時の平均価格からのラインのオフセット。 Decimal places for calculating the Sum — 合計を表示するための小数点以下の桁数。 Decimal places for calculating the Percentage — パーセンテージを表示するための小数点以下の桁数。
Tuning チューニング Color of the
FREE

This is an indicator for Quasimodo or Over and Under pattern. It automatically finds the swing points and can even place virtual trades with stop loss and take profit. Press the "Optimize" button to automatically find the most effective settings. The pattern consists of four legs A,B,C,D as shown in the pictures. Open and close prices of the virtual trades are Bid price but the statistics in Display Panel take current spread into account. Its parameters are explained below. Buffer - Pips dista
FREE

Introduction: Introducing Mean Machine Ai TRON, the latest iteration in cutting-edge, multi-symbol mean reversion trading strategies, expertly designed for the AUDCAD, AUDNZD, and NZDCAD markets. This advanced system is the culmination of unparalleled expertise and the latest in neural network technology, ensuring traders gain a competitive edge in the volatile trading arena. With its capability to operate across multiple symbols, Mean Machine Ai TRON offers unparalleled diversification, guided
MetaTraderマーケットは、他に類のない自動売買ロボットやテクニカル指標の販売場所です。
MQL5.community ユーザーメモを読んで、取引シグナルのコピー、フリーランサーによるカスタムアプリの開発、支払いシステムを経由した自動支払い、MQL5Cloud Networkなど、当社がトレーダーに対して提供するユニークなサービスについて詳しくご覧ください。
取引の機会を逃しています。
- 無料取引アプリ
- 8千を超えるシグナルをコピー
- 金融ニュースで金融マーケットを探索
新規登録
ログイン