MetaTrader 5용 Expert Advisor 및 지표 - 38

For Demo, Competition and Real Account. Valid until 20/12/2025 Combined with artificial intelligence. Build your EA, so you can build your strategy with available indicators and tools. Build EA Simple does not have any set strategy, but with it you can use a combination of indicators and use them as signals or filters and build your strategy!
Indicators available: Price Action Fast Moving Average Slow Moving Average Adaptive Moving Average Triple Exponential Moving Average Relative Strength Ind
FREE
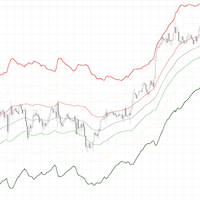
This indicator shows the support and resistance levels of the price.
If the price crosses -1.618 and the closing price is continuously higher than -1.618, go long, stop loss -1.618, first take profit Middle, second take profit +1.618, third take profit +3.618.
If the price crosses +1.618 and the closing price is continuously lower than +1.618, go short, stop loss +1.618, first take profit Middle, second take profit -1.618, third take profit -3.618.
In a volatile market, the price hovers betw
FREE
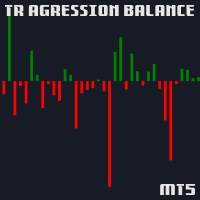
Shows the agression balance (buy agression deals - sell agression deals) in a histogram. The agression is calculated on every tick of a given candle and is the sum of volume of all the market buys minus all of the market sell trades. If the ticker does not have real volume, tick volume is used insted;
Very useful to determine if a given candle is dominated by bulls or bears
It is necessary for the data provider to have a list of trades (times & sales) as well as the agressor (buy/sell) data.
FREE

The Fisher Transform is a technical indicator created by John F. Ehlers that converts prices into a Gaussian normal distribution. The indicator highlights when prices have moved to an extreme, based on recent prices. This may help in spotting turning points in the price of an asset. It also helps show the trend and isolate the price waves within a trend. The Fisher Transform is a technical indicator that normalizes asset prices, thus making turning points in price clearer. Takeaways Turning poi
FREE

Hello, This indicator is a unique high reliability 7-in-1 multicurrency indicator comprising these sub-indicator’s: A Trend Power Crossover Indicator. A Percent Change Crossover Indicator. A Currency Overbought/Oversold Indicator. A Currency Deviation Indicator. A Currency Impulse Signal Indicator. A Trend Power Indicator. A Currency Volatility Indicator. The main advantage of this indicator is that it's reasoning by currency and not by currency pair. The values of each sub-indicator are calcula
FREE

Symbol: EURUSD Timeframe:M15 Recomended: M15 No dangerous strategies Fixed Stop loss Recomended settings: deafult Multiple strategies Recomended lot size: Deposit Lot size 1000€. 0.01 2000€. 0.02 5000€. 0.05 10000€. 0.1 Backtest 2020-2024 till now Please use good risk and money manegement Possible to set money and account protections If you need help or other recomendations please ask me More info: https://www.mql5.com/en/users/martin6223 Check my other products: Ki
FREE
이것은 무료 MT5 전문 고문입니다. 이것은 신경망에 대한 첫 번째 시도이며 앞으로 더 복잡한 버전을 만들 계획입니다. 저는 최근 Joy Moyo 강사로부터 Udemy의 신경망 MQL5 과정을 수강했습니다. MQL5.com에서 작성자 Dmitriy Gizlyk 의 NeuralNetwork 기사를 읽으면서 더 많은 것을 배우고 있습니다. 쉬워진 신경망(53부): 보상 분해 - MQL5 기사
신경망에 공급되는 입력은 강세 및 약세 전환에 대해 관찰된 RSI 값입니다.
또한 추세선 채널 그라데이션 값도 있습니다. 저는 역전파(Back Propagation)를 사용하여 실시간으로 입력에 대한 가중치를 자동으로 조정했습니다.
알고는 다음과 같이 설명했습니다. GBPUSD, M15 차트 사용된 지표: RSI, RTR 추세 채널 모든 표시기가 표시됩니다. 매수/매도 거래를 위한 신경망 필터입니다. 그것 없이는 훨씬 더 많은 거래가 있을 것입니다. Neural Network가
FREE

Description: For a comprehensive understanding of our indicators, we invite you to explore the entire Q&A section within this MQL5 blog post here . The "Live Account Statistics" Indicator is a powerful technical analysis tool that provides real-time insights into the performance of your trading account. With this indispensable tool, you can access crucial account statistics, such as balance, equity, drawdown, and more, allowing you to make data-driven trading decisions. Key Features: Real-Ti
FREE

Blahtech Moving Average indicator is a multitimeframe version of the standard Moving Average indicator. It is also enhanced with customisable alerts, period breaks and other configuration options. The 50 day and 200 day moving averages are widely followed by investors and traders, with breaks above and below the MA lines considered to be signals of interest. Links [ Install | Update | Training | All Products ]
Feature Highlights Up to three timeframes Configurable calculation variabl
FREE
If you love this indicator, please leave a positive rating and comment, it will be a source of motivation to help me create more products <3 Key Takeaways The Laguerre RSI is an enhanced version of the traditional Relative Strength Index (RSI) that incorporates Laguerre filters to smooth the price data. This helps reduce the noise and volatility that are often seen in the standard RSI, providing a cleaner and more reliable indicator for spotting trends, reversals, and overbought or oversold con
FREE
BBTrend is a relatively new indicator developed by John Bollinger to work with Bollinger Bands. It is one of only a few indicators that can signal both strength and direction making it a very valuable tool for traders.
Calculations The calculations are fairly simple. The default periods of 20 and 50 are shown, but these can be changed through the parameters. Lower = MathAbs(lowerBB(20) - lowerBB(50)) Upper = MathAbs(upperBB(20) - upperBB(50)) BBTrend = (lower - upper) / middleBB(20)
Interpret
FREE

계정 대시보드 통계
계정의 이익과 손실을 파악하기 위해 집중적으로 볼 수 있도록 도와주는 도구이므로 이를 추적할 수 있으며 손실 분석을 통해 얻은 위험도 알 수 있습니다. 계정에서 다운로드하고 활성화한 후 EURUSD H1과 같은 기호에 연결해야 합니다. 그러면 이 순간부터 도구가 통계 모니터링을 시작합니다.
패널이 완전히 고급이므로 숨기고 원하는 위치로 이동할 수 있습니다. 주요 특징은 계정 운영에 따라 다음과 같습니다. 일일 기간(매일 갱신되는 일일 손익) 주간 기간(매주 갱신되는 주간 손익) 월간 기간(매월 갱신되는 월간 손익) 연간 기간(매년 갱신되는 연간 손익) 최대 드로다운(잔고에 따라 도달한 최대 위험을 모니터링하는 매초 제어) 예를 들어 잔액이 1000 USD이고 드로우다운 표시가 10%인 경우 어느 시점에서 계정의 총 위험이 100 USD에 도달했음을 의미합니다.
FREE

Trend Panel은 사용자가 선택한 10개 쌍을 사용하여 시간 프레임 M1 - D1의 확인된 추세 방향을 표시하는 간단하고 편리한 도구입니다.
이 표시기는 모든 전략/템플릿에 방향 확인을 추가한 다음 차트를 다른 쌍 또는 기간으로 빠르게 변경하기 위한 깨끗한 대화식 인터페이스로 작동하도록 설계되었습니다. 그룹채팅 : https://www.mql5.com/en/users/conorstephenson
구매 후 설정 조언과 무료 전문가 고문을 위해 저에게 연락하십시오! 내 제품은 MQL5에서만 판매되는 제품입니다 . 다른 곳에서 이 제품을 본다면 모조품입니다. 속지 마세요. 주요 특징들 차트 패널을 정리하면 시간 프레임의 추세 방향을 빠르게 결정할 수 있습니다. 대화형 기능. 차트에 있는 양초의 색상을 변경합니다. 현재 및 과거 추세를 쉽게 볼 수 있습니다. 페어 및 타임프레임 버튼은 클릭 시 작동하여 현재 열려 있는 차트를 변경합니다. 템플릿 설정에 가장 적합한 위치로 차트의
FREE

MT4 버전 | FAQ Owl Smart Levels Indicator 는 Bill Williams 의 고급 프랙탈, 시장의 올바른 파동 구조를 구축하는 Valable ZigZag, 정확한 진입 수준을 표시하는 피보나치 수준과 같은 인기 있는 시장 분석 도구를 포함하는 하나의 지표 내에서 완전한 거래 시스템입니다. 시장과 이익을 취하는 장소로. 전략에 대한 자세한 설명 표시기 작업에 대한 지침 고문-거래 올빼미 도우미의 조수 개인 사용자 채팅 ->구입 후 나에게 쓰기,나는 개인 채팅에 당신을 추가하고 거기에 모든 보너스를 다운로드 할 수 있습니다 힘은 단순함에 있습니다!
Owl Smart Levels 거래 시스템은 사용하기 매우 쉽기 때문에 전문가와 이제 막 시장을 연구하고 스스로 거래 전략을 선택하기 시작한 사람들 모두에게 적합합니다. 전략 및 지표에는 눈에 보이지 않는 비밀 공식 및 계산 방법이 없으며 모든 전략 지표는 공개되어 있습니다. Owl Smart Levels를 사
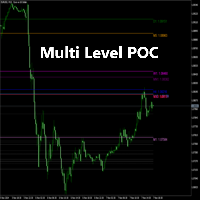
Detailed Description:
The Multi Level POC Indicator is designed for traders who want to identify critical price levels based on volume analysis across multiple timeframes. Key Features:
Multi-Timeframe POC Calculation: Automatically calculates and displays the POC from multiple timeframes, including M1, M5, H1, D1, and more. Intermediate Levels Display: In addition to the primary POC levels, the indicator also plots intermediate levels based on the POC. Custom Precision and Depth Settings: Us
FREE

대칭 삼각형, 비대칭 삼각형 또는 직각 삼각형과 같은 삼각형 패턴, 상승 쐐기 또는 하강 쐐기와 같은 쐐기 패턴, 확장 패턴 및 추세 채널에 대한 패턴 탐색기
이 지표는 과거의 패턴과 현재의 패턴을 탐색하며, 수동으로 추세선이나 삼각형을 그려 시간을 절약하고 차트에 가장 좋은 패턴을 그리는 자동 분석에 사용하려는 사람들에게 가장 적합한 지표입니다.
특징 :
- 최적의 패턴을 조정하고 찾기 위해 즉시 ZigZag 확장 깊이를 변경하는 패널
- 패턴을 지그재그의 이전 막대로 다시 이동하여 과거에 발생한 일을 탐색하고 추세선이 존중되는지 여부를 탐색하고 가격 동작을 이해할 수 있습니다.
이 지표를 사용하여 이전의 과거 패턴을 탐색하고 분석하고 학습하여 마스터 전략을 도출합니다.
- 전환 버튼에서 추세 채널 또는 추세선에서 쐐기 또는 삼각형 모드로 즉시 전환
- 패턴이 변경되지 않도록 일시 중지하고 경고에 대한 가격 터치를 계속 확인합니다.
- 레벨 터치에 대한 다양한 유형
자동화된 고급 거래 시스템. EA는 고전적인 스토캐스틱 지표의 신호에 따라 거래합니다. 포지션을 종료하기 위해 지능형 후행 시스템을 사용하고 보류 주문을 사용하여 평균화합니다. 장점: 완전 자동화된 거래 시스템 로봇 작동을 위한 맞춤형 발진기 신호 직관적으로 쉬운 입력 변수 설정 모든 유형의 악기와 모든 시간대에 적합 내장형 조정 가능한 트레일링 시스템 메모! 표시줄은 EA에 표시되지 않습니다. Problem solving -> HERE / MT4 version -> HERE 전략: 스토캐스틱 지표를 사용하면 과매수 및 과매도 값, 지나치게 낮거나 높은 가격 수준 및 가격 반전 가능성을 사용할 수 있습니다. 스토캐스틱 오실레이터는 0에서 100까지의 범위에서 두 개의 라인으로 구성되어 있습니다. 상단 라인보다 높으면 과매수 상태이고, 하단 라인 아래에는 과매도 상태입니다. 권장 값: 보수 작업의 경우 80/20, 공격적인 작업의 경우 70/30 오실레이터 라인: %K, 선택

The principle of this indicator is very simple: detecting the trend with Moving Average, then monitoring the return point of graph by using the crossing of Stochastic Oscillator and finally predicting BUY and SELL signal with arrows, alerts and notifications. The parameters are fixed and automatically calculated on each time frame. Example: If you install indicator on EURUSD, timeframe M5: the indicator will detect the main trend with the Moving Average on this timeframe (for example the Moving

The principle of this indicator is very simple: detecting the trend with Moving Average, then monitoring the return point of graph by using the crossing of Stochastic Oscillator and finally predicting BUY and SELL signal with arrows, alerts and notifications. The parameters are fixed and automatically calculated on each time frame. Example: If you install indicator on EURUSD, timeframe M5: the indicator will detect the main trend with the Moving Average on this timeframe (for example the Moving
Rinse and Repeat indicator for 3 day/session/week setups. Indicator daily features: Daily close/high/low Weekly open/high/low/close Month open/high/low/close Daily breakouts Daily failed breakouts Asia/London/New York sessions Inside days Outside days Green days Red days
Indicator weekly features:
Weekly breakouts Week dividers Indicator other features: Dashboard with bar end countdown and running PnL
FREE
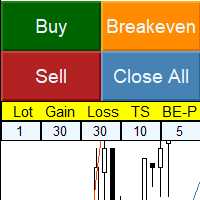
Simple panel with Stop loss (Loss), Stop gain (Gain) , Trailing stop (TS) and Breakeven (BE-P).
Lot is the number of contracts to be traded.
Gain is the number, in points, that the stop gain will be positioned. If you don't want to put stop gain, just put 0 (zero) in place and when you open the order it won't have this stop.
Loss is the number, in points, that the stop loss will be placed. If you don't want to put stop loss, just put 0 (zero) in place and when you open the order it won't ha
FREE
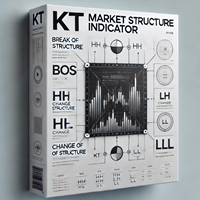
The KT Market Structure intelligently detects and displays Break of Structure (BOS) , Change of Character (CHoCH) , Equal Highs/Lows (EQL) , and various significant swing high/low points using our proprietary algorithm for accurate pattern detection. It also offers advanced pattern analysis by effectively demonstrating the captured profit for each pattern. A fully automated EA based on this indicator is available here: KT Market Structure EA MT5
Features
Accurate Pattern Detection: Our advance

KMeans Price Zones Detector와 함께하는 트레이딩의 미래에 오신 것을 환영합니다. 이 혁신적인 MetaTrader 지표는 기계 학습의 힘을 활용하여 주요 가격대를 식별합니다. 이 도구는 가격 데이터에서 중심점을 동적으로 감지하기 위해 KMeans 클러스터링 알고리즘을 사용하여 가격이 지지선, 저항선 또는 통합에 직면할 가능성이 높은 영역을 강조합니다. 혁신적인 KMeans 알고리즘 KMeans Price Zones Detector는 KMeans 클러스터링 알고리즘을 고급적으로 활용하여 두드러집니다. 이 알고리즘은 효율성과 정확성으로 패턴 인식에서 알려져 있으며, 기계 학습의 기본 요소입니다. 역사적인 가격 데이터를 분석함으로써, 이 지표는 중요한 가격 수준을 나타내는 클러스터 또는 중심점을 식별합니다. 그런 다음 이러한 중심점을 사용하여 지지선과 저항선을 계산하여 트레이더에게 가격 반전, 돌파 및 통합의 가능성에 대한 중요한 정보를 제공합니다. 주요 특징 동적 영
FREE

DawnDuskDynamics EA DawnDuskDynamics is a sophisticated trading algorithm that leverages the well-known Morning Star and Evening Star candlestick patterns to identify potential market reversals. This Expert Advisor is designed for traders looking to automate their trading strategies on major currency pairs, ensuring a systematic approach to forex trading. Key Features: Trading Strategy : Utilizes the Morning Star and Evening Star patterns to determine entry points, enhancing the probability of
FREE

The Kijun-Sen Envelope is a powerful trend-following indicator based on the Kijun-Sen line from the Ichimoku Kinko Hyo system. This tool creates dynamic upper and lower bands around the Kijun-Sen, forming an envelope that helps traders identify market trends, potential reversals, and overbought/oversold conditions.
Key Features: • Trend Confirmation – Helps determine whether the market is in a strong uptrend, downtrend, or ranging phase. • Support & Resistance Zones – The envelope acts as
FREE

Andrew Pitch fork is one of the most interesting string trend & Channel & Fibo technical analysis , it's like ALL in ONE tool would be very enough for you.
Using 2 Andrew pitch Forks with 2 different time frames on same chart is really very hard working and might be impossible , but with this indicator is possible now , moreover , using this method as Candle Volume based analysis give strong trust for your trade.
I assume if you are having 1 daily pith fork lets say with 22 Candle value , and
FREE

속도를 위해 약간 변경되었습니다. 테스터는 이메일로 나에게 쓰기,관심이 새로운 고문이 필요합니다 777basil@mail.ru
표시기는 역사의 가격 변화를 기반으로 계산되며 수학적으로 계산되며 데이터가 다시 수신 될 때마다 다시 계산됩니다. 그것은 다른 시간대에 사용할 수 있습니다. 70%의 지표의 경계에서 가격 이동 또는 통합 방향의 변화가 있습니다. 이 방법으로,당신은 추세와 국경에서 채널의 중간에 보트를 거래 할 수 있습니다. 저항/지원 수준을 결정하기 위해 추세 거래에서 사용하는 것이 좋습니다. 비디오에서 표시기가 어떻게 작동하는지 확인할 수 있습니다:
https://youtu.be/UG2ZZEH9B_U
통신 연락처 777basil@mail.ru 우리는 당신의 작업에 대한 지표 인 전문가를 준비 할 것입니다.
FREE

The Market Momentum indicator is based on the Volume Zone Oscillator (VZO), presented by Waleed Aly Khalil in the 2009 edition of the International Federation of Technical Analysts journal, and presents a fresh view of this market valuable data that is oftenly misunderstood and neglected: VOLUME. With this new approach of "seeing" Volume data, traders can infer more properly market behavior and increase their odds in a winning trade.
"The VZO is a leading volume oscillator; its basic usefulness
FREE

GoldMaster EA를 이용한 MetaTrader 5에서의 XAU/USD 거래
GoldMaster EA는 MetaTrader 5 플랫폼에서 XAU/USD(금) 거래를 위해 설계된 완전 자동화된 거래 도구입니다. 복잡한 설정 없이 자동 거래를 탐색하고자 하는 트레이더에게 적합합니다. 주요 특징: 자동 거래: EA가 모든 거래 작업을 독립적으로 처리합니다. 사전 설정: 수동 설정이 필요 없으며 사용이 간편합니다. 소규모 계좌 최적화: 적은 예치금으로도 효율적으로 작동하도록 설계되었습니다. 위험 관리: 잠재적인 손실을 효과적으로 관리하는 기능이 포함되어 있습니다. 호환성: M1(1분) 시간대에 최적화되어 있으며, IOC(즉시 실행 또는 취소), FOK(전량 실행 또는 취소), Return과 같은 다양한 주문 실행 모드를 지원합니다. 사용 방법: MetaTrader 5 플랫폼의 XAU/USD M1 차트에 EA를 부착합니다. 시장 분석과 거래 실행을 EA에 맡깁니다. 추천 사항: EA

이 다중 시간 프레임 및 다중 기호 표시기는 이중 상단/하단, 머리 및 어깨, 페넌트/삼각형 및 플래그 패턴을 식별합니다. 또한 네크라인/삼각형/깃대 이탈이 발생한 경우에만 경고를 설정하는 것도 가능합니다(넥라인 이탈 = 상단/하단 및 헤드&숄더에 대한 확인된 신호). 지표는 단일 차트 모드에서도 사용할 수 있습니다. 이 옵션에 대한 자세한 내용은 제품의 블로그 . 고유한 규칙 및 기술과 결합하여 이 표시기를 사용하면 자신만의 강력한 시스템을 생성(또는 강화)할 수 있습니다. 특징
Market Watch 창에 표시되는 모든 기호를 동시에 모니터링할 수 있습니다. 하나의 차트에만 지표를 적용하고 전체 시장을 즉시 모니터링하십시오. M1에서 MN까지 모든 시간 프레임을 모니터링할 수 있으며 패턴이 식별되거나 중단될 때 실시간 경고를 보냅니다. 모든 Metatrader 기본 경고 유형이 지원됩니다. RSI를 추세 필터로 사용하여 잠재적 반전을 적절히 식별할 수

이 강력한 도구는 자동으로 추세 라인을 식별하여 거래 전략을 간소화하고보다 정보에 근거한 결정을 내릴 수 있도록 도와줍니다. MT4 버전
주요 기능 자동 추세 라인 감지 : "기본 추세선"표시기는 잠재적 인 추세 라인에 대한 시장을 스캔하고 차트에 즉시 표시합니다.이것은 귀중한 시간을 절약하고 중요한 트렌드를 놓치지 않도록합니다. 사용자 친화적 인 패널 : 우리의 지표에는 다양한 트렌드 라인을 쉽게 그릴 수있는 아름답고 직관적 인 패널이 제공됩니다.이 패널은 모든 경험 수준의 거래자를 위해 설계되어 몇 번의 클릭만으로 추세선을 추가, 편집 또는 제거 할 수 있습니다. 좋아하는 트렌드 라인을 저장하고 관리하십시오. : 가장 중요한 트렌드 라인을 추적하십시오.우리의 지표는 선호하는 추세선을 저장하여 차트를 다시 방문 할 때마다 항상 사용할 수 있도록합니다. 다목적 응용 프로그램 : 당신이 외환, 주식 또는 암호 화폐 거래에 관계없이 "기본 추세선"지표는 다양한 시장에 적
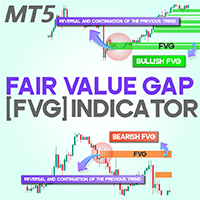
Fair Value Gap or FVG indicator MT5
The Fair Value Gap (FVG) Indicator is a valuable asset for traders using MetaTrader 5, designed to highlight market inefficiencies. An FVG occurs when an imbalance between supply and demand causes a rapid price movement. To understand this, picture three consecutive candlesticks; the space between the first and third candlestick represents the "FVG." This indicator automatically marks these gaps on the chart using dynamic boxes—green for bullish FVGs and red
FREE
A 'Seconds Period' chart, offering enhanced precision for charting and analysis. Especially beneficial during volatile market conditions and intraday trading. This indicator addresses the limitations of MT5's predefined timeframes, allowing for finer granularity down to second intervals.
Since only one EA can run per chart, being an Indicator allows for the additional advantage of running an EA alongside the Seconds Timeframe Candles Indicator on the same chart. Compatible with any intraday tim
FREE

CandleBot 소개 - 캔들스틱 패턴 식별 및 거래의 궁극적인 무료 도구! CandleBot을 사용하여 시장에서 유리하게 나가세요. 간편하게 상승 및 하락하는 흡수, 아침 및 저녁 별, 그리고 망치 신호를 인식하세요. 일정 기간 동안의 시가, 고가, 저가 및 종가에서 유래한 캔들스틱 패턴은 가격 움직임의 시각적 표현으로, 시장 센티먼트를 분석하고 잠재적인 추세 반전이나 지속을 예측하는 데 도움을 줍니다. 캔들스틱 패턴 이해하기: 흡수 패턴: 두 개의 캔들스틱으로 이루어져 있으며, 두 번째 캔들이 첫 번째를 완전히 덮습니다. 하락 트렌드 종료 시 나타나는 상승 흡수는 잠재적인 상승 트렌드 반전을 나타내며, 상승 트렌드 종료 시 나타나는 하락 흡수는 가능한 하락 트렌드 반전을 시사합니다. 흡수 캔들의 몸통이 클수록 신호가 강합니다. 망치 패턴: 상단 근처에 작은 몸통과 긴 아래 그림자를 가진 단일 캔들스틱으로 망치를 닮았습니다. 망치가 나타나면 하락 트렌드 후의 반전이 예상되며,
FREE

Previous Candle Levels MT5 shows the previous candle levels, it shows the previous candle Open High Low Close levels (OHLC Levels) in different time frame. It's designed to help the trader to analyse the market and pay attention to the previous candle levels in different time frame. We all know that the OHLC Levels in Monthly, Weekly and Daily are really strong and must of the time, the price strongly reacts at those levels. In the technical analysis, the user can use them as a support and res
FREE
The indicator is a line right at yesterday's closing price. With the indicator, there is no need for adding or deleting previous day close lines each new day. T he line gives you an instant visual reference point for support, resistance, and market sentiment. Whether you are day trading or swing trading, this line helps you quickly gauge where the market closed last session and how current price action relates to that level. It works seamlessly across all timeframes - from 1-minute charts to d
FREE
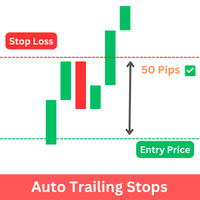
The Expert Advisor (EA) developed is specifically designed for scalping trading strategies . It's functions as a trailing stop manager for any positions opened by the user. The EA continuously monitors open positions and dynamically adjusts the stop-loss level as the price moves in favor of the trade. This trailing stop mechanism helps traders by managing ongoing trades that have taken by the trader by automatically tightening the stop-loss level as the trade progresses, thereby reducing poten
FREE
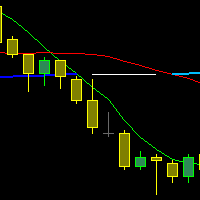
The indicator draws three Moving Averages. Two short ones cross a long one.
At the same time, the long MA changes color: If both short MAs are above the long one - first color; If both short MAs are below the long one - second color; If the two short MAs are on opposite sides of the long one - third color. All three MAs are based on closing prices with a smoothing method of "simple."
cross MA cross 3 MA cross three Moving Average across Moving cross Moving crossing MA crossing MA across MA
FREE

For MT4 version please click here . Introduction Most traders use candle patterns as a confirmation tool before entering a trade. As you know there are lots of candle patterns out there. However I realized most of them can be generalized in simple rules. So I developed my own candle pattern(Although I cannot say for sure this is mine). pattern description The pattern consists of three consecutive candles. This is true for most of the patterns out there (considering there is a confirmation neces
FREE
Advanced MACD is a safe and fully automated EA. This EA uses MACD indicator with double confirmation set and filtering by range of latest price movements. Every order has stop-loss and the EA has implemented advanced filtering functions together with spread and slippage protections. This EA does NOT use the dangerous strategies like Martingale, etc. Advanced MACD is NOT a tick scalper that produces high number of trades per day and it is NOT dependent on every point of price. This EA is

Introducing the Fair Value Gap Indicator : A Simple and Effective Trading Tool The Fair Value Gap Indicator is designed to help traders easily identify and utilize Fair Value Gaps (FVGs) in their trading strategies. FVGs highlight price imbalances that the market often revisits, offering potential trade entry or exit opportunities. Whether you're a beginner or an experienced trader, this indicator simplifies the process of spotting these valuable zones, allowing you to trade with clarity and co
FREE

The strategy is based on finding top and bottoms during the night flat range. The night flat range usually lasts during the Pacific and Asian trading session and is characterized by low volatility. Most night scalpers have one weakness, that is, small gains and few big losses which wipe all the small gains. This Scalper is using Neutral network to avoid days that can potentially have high volatility and result in big loses, Neutral network does this accurately . The Neutral network has currently
FREE

Do you want to see the most relevant supports and resistances at a glance? Tired of tracing the levels by hand? Multi Levels Detector is an indicator for MetaTrader that will draw supports and resistances according to the parameters entered, and also offers the possibility of executing an alert every time the price reaches any of its levels.
SETTINGS UsePercentage: Allows you to configure whether the distances between levels will be measured in points, or by a percentage of the asset.
TimeFram
FREE

Здравствуйте. После долгого пути разработки остановился на виртуальном сеточнике. У робота всего два режима автоматический и ручной. Автоматическая торговля, а также для тестера: M15, Н1 настройка Virtual_Grid_default рекомендуется true. Автомат без замечаний работает на форексе золоте и ByBit эфириум. На других инструментах, пока недостаточно статистики Ручная торговля на всех таймфреймах меньше часовика Обязательно посмотрите видео по последнему обновлению. Вся информация по работе советника
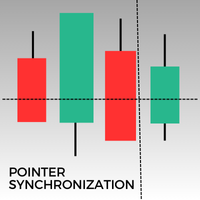
이 지표는 MetaTrader 5에서 동일 자산의 모든 열린 차트에서 포인터를 동기화합니다. 예를 들어, 한 차트에서 가격 34.45에 포인터를 놓으면 동일 자산의 다른 모든 차트에서도 동일한 가격에 포인터가 표시됩니다. 이를 통해 여러 창에서 일관되고 동기화된 분석이 가능합니다.
FREE

Volume Weighted Average Price (VWAP) is a trading benchmark commonly used by Big Players that gives the average price a Symbol has traded throughout the day. It is based on both Volume and price. Additionally we put in this indicator the MVWAP (Moving Volume Weighted Average Price). For those who do not know the usage and the importance od this indicator I recommend a great article about this subject at Investopedia ( https://www.investopedia.com/articles/trading/11/trading-with-vwap-mvwap.asp )
FREE
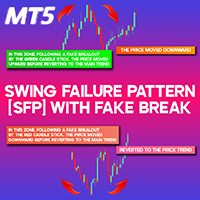
Swing Failure Pattern (SFP) with Fake Break Indicator for MT5 The Swing Failure Pattern (SFP) Indicator in MetaTrader 5 is designed to identify deceptive breakouts in financial markets. This pattern appears when the price momentarily surpasses key levels, such as previous highs or lows, triggering stop-loss orders and liquidity traps. However, instead of continuing in that direction, the price swiftly reverses, signaling a false breakout . The main function of the SFP pattern is to exploit liqui
FREE

The indicator has been designed for use on FORTS, but it can also work on other markets, at brokers broadcasting the required data. A peculiarity of these data is that they cannot be requested from the broker's server as a section of history, but can only be obtained for the current moment. The indicator periodically requests the broker, collects to a file and displays the following history from the stored file: The weighted average price. The volume of buy pending orders. The volume of sell pen
FREE

알고리즘은 Currency Power Meter 표시기의 아이디어를 기반으로 합니다. 이 버전에서 표시되는 값의 수는 무제한이며 코드가 더 간결하고 빠르며 현재 막대의 값은 표시기 버퍼를 통해 얻을 수 있습니다. 표시가 보여주는 것 : 얇은 밴드와 통화 앞의 위쪽 숫자는 지난 N시간 동안의 상대 강도 지수를 보여주고(N은 변수 '시간'의 매개변수에서 설정됨), 더 넓은 밴드는 일일 지수를 보여줍니다. 입력 매개변수에서 지정하는 이 통화를 사용하는 통화 쌍이 많을수록(중개인이 쌍에 대한 견적을 제공한다고 가정) 인덱스에 가중치가 더 많이 부여됩니다(그러나 "비주요" 또는 이국적인 통화 쌍에 주의할 수 있습니다. 전체 그림을 왜곡). 예를 들어 EURUSD만 지정하면 유로에 대한 상대 지수는 이 쌍만을 기준으로 계산되고 EURGBP를 추가하면 유로 지수는 두 쌍을 기반으로 계산되어 더 많은 가중치를 얻게 됩니다. 데이터 활용 방법 : 지수 값이 낮거나 높을수록 중요한 뉴스가 없을
FREE
이 EA는 이동 평균 크로스오버를 사용하여 거래합니다. 완전히 사용자 정의 가능한 설정, 유연한 위치 관리 설정, 사용자 정의 가능한 거래 세션, 마틴게일 및 역 마틴게일 모드와 같은 많은 유용한 기능을 제공합니다. [ 설치 가이드 | 업데이트 가이드 | 문제 해결 | 자주하는 질문 | 모든 제품 ] 사용 및 감독 용이 완전히 사용자 정의 가능한 이동 평균 설정 그것은 두 가지 다른 거래 행동을 구현합니다 맞춤형 손익분기점, SL, TP 및 후행 정지 ECN/비 ECN 중개인을 위한 작업 2-3-4-5 자리 기호에 대해 작동 거래는 NFA/FIFO를 준수할 수 있습니다. 거래는 반대 신호에서 마감될 수 있습니다. 마틴게일 및 역 마틴게일 기능을 구현합니다. 주중 및 시간별로 거래 필터링
내장된 자금 관리 EA는 네 가지 다른 동작을 구현합니다. 일반: 강세 크로스오버에서 매수하고 약세 크로스오버에서 매도 역: 강세 크로스오버에서 매도하고 약세 크로스오버에서 매수 매수만: 강세 크로스

Gatotkaca Support Resistance Trendline Indicator is a simple indicator that detects support, resistance and trendlines. It will helps you find breakout momentum based on lines calculated by this indicator. This is conceptually based on fractals, but with customizable periods. Compatible for any timeframes. You can customize how this indicator work by setting up the period input.
FREE

IlanisNeuro MT5 - expert variation Ilanis . The expert Advisor uses averaging. A neural network is used to open positions. The network was trained on seven major currency pairs (EURUSD, GBPUSD, AUDUSD, NZDUSD, USDJPY, USDCHF, USDCAD) in the interval 2010-2019. Compared to the MT4 version , the expert Advisor was able to multi-currency trading from a single chart and was retrained on fresh data. Version monitoring for МТ4: https://www.mql5.com/en/signals/339250 Free version: https://www.mql5.c
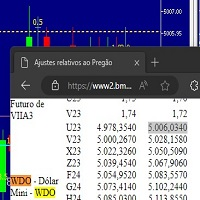
Este script marca no gráfico do ativo MINDOL da activ trades o ponto de ajuste do contrato futuro do Mini Dolar (WDO),
***ATENÇÃO*** para este script funcionar é necessário autorizar a URL da BMF Bovespa no Meta Trader. passo a passo: MetaTrader 5 -> Ferramentas -> Opções -> Expert Adivisors * Marque a opção "Relacione no quadro abaixo as URL que deseja permitir a função WebRequest" e no quadro abaixo adicione a URL: https://www2.bmf.com.br/ este indicador usa a seguinte página para buscar o a
FREE

Gold Breakout Sniper (Strategy_2_59_158) Automated Gold Trading EA on the 1-Hour Timeframe Developed specifically for gold traders (XAUUSD), with a strong focus on safety, capital preservation, and minimizing the risk of account wipeout.
Key Features of This EA: • Utilizes a Breakout Trading strategy, analyzing and opening trades when price breaks through key support or resistance levels • Executes Buy/Sell orders only when precise technical conditions are met • Every trade is set with a clear

Stochastic indicator alerts when EA Available in comments , must have indicator installed buys stochastic main line is above signal line stochastic is below 30 rsi 5 is below 20 sell stochastic main line is below signal line stochastic is above 70 rsi 5 is above 80 ADD to chart Stochastic k 30 - d 9 - slowing 3, levels 30/70 rsi 5 lelels 20.80
Full alerts push, mobile , email ect All input settings variable feel free to contact for more information or alert sugestions
FREE

This EA script implements a triangular arbitrage strategy, which exploits price discrepancies between three related currency pairs (EURUSD, GBPUSD, and EURGBP). The strategy aims to profit from temporary mispricing in the market by simultaneously buying and selling the same currency pair through different routes. This approach is based on the law of one price, which states that in an efficient market, the price of a security should be the same across all markets. Importance: This strategy is imp
FREE

Indicator and Expert Adviser EA Available in the comments section of this product. Download with Indicator must have indicator installed for EA to work.
Mt5 indicator alerts for bollinger band and envelope extremes occurring at the same time. Buy signal alerts occur when A bullish candle has formed below both the lower bollinger band and the lower envelope Bar must open and close below both these indicators. Sell signal occur when A bear bar is formed above the upper bollinger band and upper
FREE

O Indicador valida a força da tendência utilizando o volume negociado. Os candles são mostrados na cor verde indicando força compradora e cor vermelha na força vendedora. O movimento é encerrado pelo SAR parabólico. Vantagens: Filtra distorções de preço sem volume financeiro; Filtra consolidações e movimentos laterais; Filtra divergências de volume pelo indicador Money Flow. Desvantagens: Não filtra todos os falsos rompimentos, visto que rompimentos importantes geram altos volumes financeiros; N
FREE

The Martinware Manual Trading Helper indicator is aimed at helping people start their lives in manual trading. It can be used to display both some generic images at the right side of the graph, where custom operational remarks may be displayed or just a blank rectangle hiding the chart while backtesting. Moreover, it can periodically play a list of sounds. To show a blank rectangle, let the first image name input field empty and select the desired color. To show one or more custom images inste
FREE

I think you all know Donchian Channels. so I am not going to write about it.
With this indicator I tried to create Donchian Trend Ribbon by using Donchian Channels.
How it works ?
- it calculates main trend direction by using the length that is user-defined. so you can change it as you wish
- then it calculates trend direction for each 9 lower lengths. if you set the length = 20 then the lengths are 19, 18,...11
- and it checks if the trend directions that came from lower lengths is same
FREE
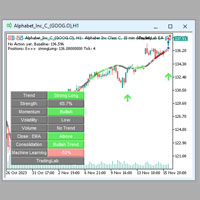
This EA will work together with TradingLab AI Private Indicator. Consider to copy trades from my signal here on MQL5 or subscribe to the private indicator if you don't have it already.
Checkout the private indicator website or watch the video linked in the store.
How it works: Step 1) The EA analyze the trend once it receives a signal from the indicator. It will open a small position and continue to monitor.
Step 2) The EA will automatically open a larger position if the position is prof

Just Keep CALM and Trade SMART This EA is only for serious traders, who wants really robust strategy for longterm and sustainable profits. Strategy uses MACD direction change for finding trading opportunities. It is fully automatic and doesn't require any action from you. Just attach it to the EURUSD H1 chart and let this EA works for you. This EA has passed 9 robustness tests , indicating a quality strategy.
Benefits for you Plug & Play system - just attach to the chart, configure your ri

Start earning profits by copying All trades are sent by our successful Forex trader & are extremely profitable. You can earn profits by copying trades daily Trial Period included You'll also get access to extremely powerful trading education which is designed in a simple way for you to become a profitable trader, even if you have no trading experience. https://ec137gsj1wp5tp7dbjkdkxfr4x.hop.clickbank.net/?cbpage=vip
FREE

Please check the " What's new " tab regularly for a complete and up-to-date list of all improvements + parameters. FREE indicator for my trading utility Take a Break . This indicator allows you to manage multiple other EAs with just one Take a Break EA instance. Simply specify the corresponding Chart Group in the indicator(s) and Take a Break EA settings and you are good to go.
Setup examples (Indicator + EA)
As a prerequisite, add the URL https://trading.custom-solutions.it to the list of al
FREE

Простой советник основанный на сигналах индикатора Relative Strength Index (RSI) в зоне перекупленности - продаем, в перепроданности - покупаем. Моя версия всем известного "Dynamic". Я рекомендую использовать этот советник в полуавтомате.
Добавляйтесь в друзья, присылайте свои интересные стратегии. Возможно после обсуждения всех нюансов напишу советника бесплатно . Параметры: "_Slippage" - Проскальзывание; "_ M
FREE

EA 설명: 이 자동 거래 EA는 장기적으로 지속 가능하고 적응 가능하며 높은 성능을 제공하기 위해 설계되었습니다. 지원 없이 판매되는 많은 EA와 달리, 이 EA는 유연성과 엄격한 리스크 관리 접근 방식으로 차별화됩니다. 통합된 각 전략은 다양한 시장 상황에 적응하도록 세심하게 테스트되었으며, 최적의 커버리지를 보장합니다. 고급 맞춤형 자금 관리 기능을 갖춘 이 EA는 성능을 유지하고 변동성이 높은 환경에서도 사용자의 자본을 보호하는 것을 목표로 합니다. 스토리텔링
진행 중인 특별 혜택 현재 2 명의 사용자가 $49 특별 혜택을 이용했습니다! 가격이 $99 로 인상되기 전까지 단 8 자리만 남아 있으며, 최종 가격인 $199에 도달합니다. 주요 기능: 전략 다양화: 이 EA는 다양한 시장 조건에 적응할 수 있도록 고급 전략(mean-reversion, 단기 및 장기 트렌드, 브레이크아웃, 모멘텀, 변동성 및 레인지)을 통합합니다. 멀티 심볼 및 멀티 타임프레임 거래: 여러 심볼(
The Kalires Channel Indicator is a technical indicator used to evaluate trend direction and potential trading opportunities. This is a hybrid indicator that combines Kauffman Adaptive Moving Average (KAMA), linear regression and smoothing. The Kalires Channel Indicator consists of two lines: one central and two outer bands. The central line is a smoothed KAMA modified according to the direction of the trend. The outer bars represent two linear regression lines drawn above and below the center l
FREE

If you love this indicator, please leave a positive rating and comment, it will be a source of motivation to help me create more products <3 What is Schaff Trend Cycle indicator? The Schaff Trend Cycle (STC) is a technical analysis indicator used in trading and investing to identify trends and generate trading signals. The STC is designed to identify trends and trend reversals by measuring the strength of the trend and the speed of price changes. The STC indicator helps to identify trends in a
FREE

The indicator IQuantum shows trading signals for 10 symbols in the daily chart: AUDCAD, AUDUSD, EURUSD, GBPCAD, GBPCHF, GBPUSD, NZDUSD, USDCAD, USDCHF, and USDJPY.
Signals of the indicator are produced by 2 neural models which were trained independently from one another. The inputs for the neural models are normalised prices of the symbols, as well as prices of Gold, Silver and markers of the current day.
Each neural model was trained in 2 ways. The Ultimate mode is an overfitted neural model
FREE

The HammerStar indicator is designed to search for the Hammer and Shooting Star patterns on charts of any currency pairs.
Hammer Downward trend.
The lower shadow is not less than 2 and no more than 3 times larger than the body.
There is no upper shadow, or it is very short (no more than 10% of the candlestick range).
The color of the body in the long game is not important, with the short - white hammer is much stronger than the black one.
Confirmation is suggested.
Shooting Star Uptrend.
The u
FREE
MetaTrader 마켓은 거래로봇과 기술지표를 판매하기에 최적의 장소입니다.
오직 어플리케이션만 개발하면 됩니다. 수백만 명의 MetaTrader 사용자에게 제품을 제공하기 위해 마켓에 제품을 게시하는 방법에 대해 설명해 드리겠습니다.
트레이딩 기회를 놓치고 있어요:
- 무료 트레이딩 앱
- 복사용 8,000 이상의 시그널
- 금융 시장 개척을 위한 경제 뉴스
등록
로그인
계정이 없으시면, 가입하십시오
MQL5.com 웹사이트에 로그인을 하기 위해 쿠키를 허용하십시오.
브라우저에서 필요한 설정을 활성화하시지 않으면, 로그인할 수 없습니다.