YouTubeにあるマーケットチュートリアルビデオをご覧ください
ロボットや指標を購入する
仮想ホスティングで
EAを実行
EAを実行
ロボットや指標を購入前にテストする
マーケットで収入を得る
販売のためにプロダクトをプレゼンテーションする方法
MetaTrader 5のための無料のエキスパートアドバイザーとインディケータ - 11

Thermo MAP is a multicurrency and multitimeframe indicator that display a smart heat map based on proprietary calculations. Watch how Forex market moved and is currently moving with a single dashboard and have a consistent and good idea of what is happening!
It can be suitable for both scalping or medium/long term, just select options that better fit your trading style Symbols list are automatically sorted based on the preferred column. There is the possibility to click on: First row, timefram
FREE

Local_Timeは、チャート下部に指定の時差または、自動計算された時差でオリジナルの時間目盛りを追加します。
時間目盛りには、「DD.MM hh:mm」「DD MMM hh:mm」「MM-DD hh:mm」「MM/DD hh:mm」「DD hh:mm」「hh:mm」などなど対数のフォーマットに対応しています。
時差計算の必要性がない方でも、標準の時間目盛を消して、この時間目盛でサーバー時間の表示形式を変えるだけで、チャートの見やすさがアップするでしょう。
また、この日時バーよりも下にサブウインドウが作られてしまった場合は、赤いバーが表示されクリックすると最下部に移動する機能も付いています。
表示イメージは、スクリーンショットをご覧ください。
how to use
https://www.mql5.com/en/blogs/post/752455
FREE

Ai Drawdown Protector は、ドローダウンを監視するための外国為替市場の最新技術です。プロップ会社や FX トレーダーがエクイティとバランスを追跡するためによく使用されます。一番良い点は、無料であることです。 期間限定オファー: AI Drawdown Protector は、期間限定で無料でご利用いただけます。 Ai Drawdown Protector には、1 秒あたり 10 回ドローダウンを計算するタイマー機能があります。ドローダウンが限度に達したことを検出すると、警告を生成し、その日のオープンおよび保留中のすべての取引を終了します。特に、エクイティに基づいてドローダウンを追跡するため、他の EA からの取引を決済できます。
機能:
作業用の美しいグラフィック パネル 無料 究極のドローダウン モニター システム すべてのペアのエクイティに基づいてロットを計算します。 24 時間 365 日稼働可能 簡単なセットアップ 固定ロットまたはリスク パーセントのいずれかでパネル上で売買 ビッド、アスク、スプレッド、マージン、フリー マージンなどの重要な情報
FREE

前書き インベストメントキャッスルインジケーターは、以下の問題を解決することを期待して作成されました。
1.さまざまな時間枠でトレンドの正しい方向を決定します。
2.ヒット率、勝率をチャートに表示します。
3.このインジケーターはチャートを再描画しません。
4.このインジケーターは Investment Castle EA に組み込まれています。
*設定されたファイル、更新などについては、Webサイトをチェックしてください: https://www.investmentcastle.com
免責事項 「インベストメントキャッスルインジケーター」とその名前が付いたすべての製品は、トレーダーが取引をサポートするために使用できるツールとして明確に見なされるべきです。これを念頭に置いて、このツールがどれだけうまく機能するか、または効果的であるかは、トレーダーの入力や最適化に完全に依存します。
トレーダーとして、投資キャッスルインジケーターを使用する前に、まずデモまたはトライアルアカウントのさまざまなパラメーターの入力設定を徹底的にバックテストすることにより、投資キ
FREE

HUGE ANNOUNCEMENT!!! With the purchase of Tropic Funder EA, you can obtain my Boxer Pro trading indicator FREE! Message me after purchase and I will send you a restriction-free copy of Boxer Pro indicator, as well as give you the ability to obtain the all-new, unannounced Boxer Ultimate EA absolutely FREE as well! That's two amazing new highly anticipated systems unreleased to the public until now, ABSOLUTELY FREE!!! Introducing Tropic Funder EA for GBPUSD H1 A groundbreaking trading system val
FREE

This indicator draws the Donchian Channel, filling the background with colors. The color of the middle line is changed following the current trend, based on the standard interpretation of the Donchian Channel.
Input Parameters: Period of the Channel (default is 20) Validate Signals (boolean value to filter out false breakouts, default is false) Background Settings
Show Background (default is true) U ptrend Color (default is DodgerBlue ) Downtrend Color (default is Orchid) Background Tr
FREE

Introduction to Fractal Moving Average Fractal Moving Average indicator was designed as part of Fractal Pattern Scanner. Inside Fractal Pattern Scanner, Fractal Moving Average Indicator was implemented as multiple of chart objects. With over thousands of chart object, we find that it was not the best and efficient ways to operate the indicator. It was computationally too heavy for the indicator. Hence, we decide to implement the indicator version of Fractal Moving Average indicator to benefit ou
FREE
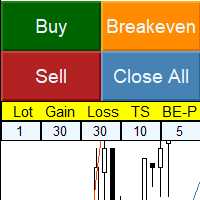
Simple panel with Stop loss (Loss), Stop gain (Gain) , Trailing stop (TS) and Breakeven (BE-P).
Lot is the number of contracts to be traded.
Gain is the number, in points, that the stop gain will be positioned. If you don't want to put stop gain, just put 0 (zero) in place and when you open the order it won't have this stop.
Loss is the number, in points, that the stop loss will be placed. If you don't want to put stop loss, just put 0 (zero) in place and when you open the order it won't
FREE
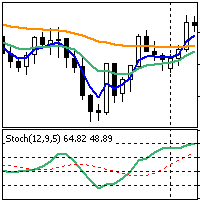
This is a simple trend strategy for Forex. Recommended timeframe is H1, the default settings are for the GBPUSD currency pairs (for other timeframes and currency pairs, it is necessary to select other indicator settings). The following indicators are used in the strategy: Exponential Moving Average: EMA (4) — blue Exponential Moving Average: EMA (13) — green Exponential Moving Average: EMA (50) — orange. Stochastic Oscillator (12,9,5), levels — 20, 40, 60, 80. A buy trade is opened at the openin
FREE
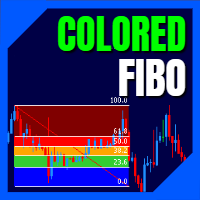
LT Colored Fibo is a simple indicator that paints the price zones between Fibonacci Retracement levels. Its configuration is extremely simple. It is possible to change the colors of each level of the retracement, choose between background or front of the chart and also work only with the current asset or all open. If you found a bug or have any suggestion for improvement, please contact me. Enjoy!
This is a free indicator, but it took hours to develop. If you want to pay me a coffee, I appreci
FREE

これが究極のRVIインジケータです。 警告矢印を追加 潜在的な抵抗レベルを特定することができます 読み値を改善するための2つの追加フィルタ それはさらに良好な結果を示すために平滑化される m1からm30までの短い時間枠で構成されていました ひどく悪くはありません スクリーンショットmacdのように、このインジケータを追加のフィルタとともに使用することをお勧めします これが究極のRVIインジケータです。 警告矢印を追加 潜在的な抵抗レベルを特定することができます 読み値を改善するための2つの追加フィルタ それはさらに良好な結果を示すために平滑化される m1からm30までの短い時間枠で構成されていました ひどく悪くはありません スクリーンショットmacdのように、このインジケータを追加のフィルタとともに使用することをお勧めします
FREE
(This is the free version of our trade manager, download it for free and test it, and provide feedback. If you are satisfied with its capabilities, you can try out its bigger brother the Deriv Scalp Manager also available from us.)
EA Summary If you are a scalping trader who wants to place and close trades quickly and efficiently, you need a powerful tool that can help you achieve your goals. That's why we created the Deriv Trade Assistant EA, a smart and easy-to-use expert advisor that a
FREE

VR Assistant Charts — これは、MetaTrader 取引ターミナル ウィンドウでグラフィカル オブジェクトを操作するトレーダーにとって便利なツールです。このプログラムを使用すると、マウスをワンクリックするだけで、MetaTrader ターミナル内のトレンド ライン、フィボナッチ レベル、ギャン ファン、その他のグラフィック要素の色、スタイル、太さ、その他の特性を変更できます。 設定、設定ファイル、デモ版、説明書、問題解決方法は、以下から入手できます。 [ブログ]
レビューを読んだり書いたりすることができます。 [リンク]
のバージョン [MetaTrader 4] このユーティリティは、グラフィカル オブジェクトを使用して金融商品を分析するトレーダーの単調な作業を大幅に容易にします。すべての操作は、コンピューターのマウスを使用してチャート上で直接実行されます。このプログラムは、MetaTrader 4 および MetaTrader 5 取引プラットフォーム用のテクニカル指標の形式で実装されており、他の指標、アドバイザー、スクリプトと同時に使用することが可能
FREE

hello,
king binary sureshot mt5 binary indicator,
1 minute candle
1 minute expire
Join Our Telegram
https://t.me/KINGBINARYOFFICIAL
Alright. This indicator works on MT5 and is very easy to use. When you receive a signal from it, you wait for that candle with the signal to close and you enter your trade at the beginning of the next new candle. A red arrow means sell and a green arrow means buy. All arrows comes with a long dotted like for easy identification of trade signal. Are you oka
FREE

This Advanced Pivots Point is a MT5 Indicator and the essence of this technical indicator is to transform the accumulated history data. Pivot Point Indicator provides for an opportunity to detect various peculiarities and patterns in price dynamics which are invisible to the naked eye. Pivot Points Fibonacci retracements Previous day’s open, high, low, and close.
FREE

One of the good and important features in MT4 is the availability of the iExposure indicator. With the iExposure indicator, traders can see a comparison of ongoing open positions and how much funds have been used, and more importantly what is the average value of these open positions.
Unfortunately this indicator is not available on MT5.
This indicator is iExposure MT4 which I rewrote using the MT5 programming language. This indicator can be used like iExposure on MT4 with the same function
FREE

Volatility Doctor Desert Eagleをご紹介します:爆発的なトレード成功のための究極のスキャルピングアルゴリズム!
あなたの取引ゲームを革命化する準備はできていますか?もうこれ以上探す必要はありません。Volatility Doctor Desert Eagleは、精度、コントロール、収益性を備えたトレーダーを力強く支えるために設計された究極のスキャルピングアルゴリズムです。以下は、Volatility Doctor Desert Eagleが他のどの製品よりも優れている理由です。
1) シンプルで直感的: 複雑な用語や急な学習カーブは不要です。当社のアルゴリズムはシンプルで理解しやすいパラメータを備えており、すべてのスキルレベルのトレーダーがそのパワーを活用できるようにしています。
2) データに基づく意思決定: 市場のボラティリティの強力な指標を活用して、トレードの意思決定に役立てます。推測に別れを告げ、データに基づいた戦略を歓迎しましょう。
3) 完全な制御: 各個別の設定に完全な制御権を持ちます。アルゴリズムをユニークなトレードスタイル
FREE
This EA trades untested fractals using pending orders. It offers many trading behaviors and flexible position management settings, plus many useful features like customizable trading sessions and a martingale mode. [ Installation Guide | Update Guide | Troubleshooting | FAQ | All Products ] Easy to use and supervise It implements 4 different trading behaviors Customizable break-even, SL, TP and trailing-stop Works for ECN/Non-ECN brokers Works for 2-3-4-5 digit symbols Trading can be NFA/FIFO C
FREE

This indicator shows current major support and resistance, if one exists. And as a support or resistance is broken it shows the new current, if any. To identify support and resistance points it uses the high and low points identified on the current chart. Allows too you to inform the maximum number of bars used to consider a support or resistance point still valid.
FREE

StopLevel メーターはSTOPLEVELレベルを制御します。レベルが変わると、アラートで合図します。 STOPLEVEL- ストップ注文を出すための現在の終値からのポイントでの最小オフセット、またはポイントでの最小許容ストップロス/テイクプロフィットレベル。 STOPLEVELのゼロ値は、ストップロス/テイクプロフィットの最小距離に制限がないこと、またはトレーディングサーバーが端末に送信できない動的レベル制御のための外部メカニズムを使用していることを意味します。 2番目のケースでは、STOPLEVELは実際には「フローティング」です。 インジケーター設定: color_-レベルのゾーンの色 draw_bars-レベルゾーンを表示するためのバーの数 width_price-価格ラベルの厚さ
FREE
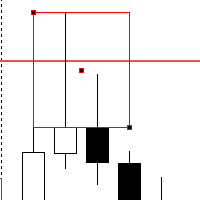
Introducing our Rejection Block Scanner – a powerful and intuitive tool designed to revolutionize your trading by effortlessly identifying key rejection zones across various timeframes. This cutting-edge scanner is crafted to cater to both beginner and experienced traders, offering unparalleled insights into potential market turning points.
**Key Features:**
1. **Multi-Timeframe Analysis:** Uncover opportunities on a grand scale! Our Rejection Block Scanner meticulously scans multiple timef
FREE

少し速度のために変更されました。 テスターは、電子メールで私に書いて、興味を持っている新しい顧問のために必要とされます777basil@mail.ru
インジケータは履歴の価格変化に基づいて計算され、数学的に計算され、データが再び受信されるたびに再計算されます。 それは異なる時間枠で使用することができます。 70%のインジケータの境界から、価格の動きや統合の方向に変化があります。 このようにして、トレンドとチャネルの中央の両方を国境から取引することができます。 抵抗/サポートレベルを決定するためにトレンド取引でそれを使用する方が良いです。 ビデオでは、インジケータの動作を確認できます: https://youtu.be/UG2ZZEH9B_U 通信のための連絡先 777basil@mail.ru 私たちは、専門家、あなたのタスクのための指標を準備します。
インジケータは履歴の価格変化に基づいて計算され、数学的に計算され、データが再び受信されるたびに再計算されます。 それは異なる時間枠で使用することができます。 70%のインジケータの境界から、価格の動きや統合の方向に変化が
FREE

The indicator analyzes the chart and identifies Doji candlesticks. Shows their appearance and signals the appearance of such a candle (if allowed in the parameters). Also, this indicator shows the strength of the reversal in the form of bars of different colors (the more green, the more likely the rise, the more red - the fall in price). The direction of the signal depends on the direction of the previous candles, as the Doji signals a reversal or correction. In the indicator settings, you can
FREE

この指標を使用すると、日中の範囲のローカルトレンドの強さに対する価格変化のダイナミクスを追跡することができます 推薦された期間:M5-H1 価格チャネルPROインジケータは再描画されず、レベルは変更されません 指標を使用した取引は非常に簡単です
販売取引を開くには、方法:
1. 新しい現地価格の最大値を待ちます 2. 価格はチャネルの中央にロールバックする必要があります(緑色の線) 3. 新しいろうそくの販売マークを開く 4. ストップロスをチャンネルの上限より上に設定します(青い線) 5. 価格が反転してローカル最小値が更新されたら、収益性の高いゾーンの注文を閉じます
購入取引を開く方法:
1. 新しいローカル最低価格を待ちます 2. 価格はチャネルの中央にロールバックする必要があります(緑色の線) 3. 新しいキャンドルの購入トラックを開きます 4. チャンネルの下の境界線(赤い線)の下にストップロスを設定します。 5. 価格が反転してローカルの最大値が更新されたら、収益性の高いゾーンの注文を閉じます
Price Channel PRO指標を他
FREE

Introducing the Accelerator Divergence Indicator, a powerful tool designed to enhance your Forex trading experience. This innovative indicator is specifically crafted to identify market divergence, providing traders with valuable insights for more informed decision-making. The Accelerator Divergence Indicator utilizes advanced algorithms to detect divergence in the market, visually guiding traders with precision-drawn lines that highlight key points of interest. Divergence occurs when the price
FREE
A neural network Expert Advisor based on two moving averages with the training mode. Train the Expert Advisor on selected examples and make a profit in real life. The EA can work on any instrument and in any timeframe.
Trading Algorithm of the EA Two moving averages are analyzed by the neural network core, which produces commands to buy or sell. the values of two moving averages, fast (FMA) and slow (SMA), are provided to the first layer, at the second layer it calculates two neurons responsib
FREE

スタイルが重要だから
キャンドルの色や背景の明暗を変えたり、グリッドを付けたり消したりするために、いちいちプロパティをクリックするのが面倒なのはよくわかります。ここでは、1つのクリックで解決策です。 トレーダーが望むキャンドルのスタイルを選択するための3つのカスタマイズ可能なボタン。 昼と夜のモードを切り替えるには、1つのボタン。 チャート上のグリッドを表示または非表示にするには、1つのボタン。 ***** 設定で、ボタンを画面上のどこに表示するかを選択できます*****。 私の他の製品をチェックすることを検討してください https://www.mql5.com/en/users/javimorales.fer/seller
ストキャスティックRSIとは何ですか?
ストキャスティックRSI(StochRSI)は、テクニカル分析で使用される指標で、ゼロから1(または一部のチャートプラットフォームではゼロから100)の範囲で、標準の価格データではなく、相対強度指数(RSI)の値の集合にストキャスティックオシレーター式を適用して作成されたものです。
執筆者
ハビエル
FREE

Introduction To Time Box Indicator Time Box Indicator is a must have indicator for any trader. It will display daily, weekly and Monthly box according to your preferences. Yet, you can extend any important price levels in your chart automatically. You can use them as the significant support and resistance levels. It is very simple but effective tool for your trading.
Graphic Setting Use White Chart Line Style for Current Open price
Daily Setting Update Timeframe for daily box Number of days
FREE

Cluster Luck FX for GBPJPY H1 Chart EXPERIENCE CLUSTER LUCK AND ITS PERFORMANCE ABSOLUTELY FREE!!! Embark on a trading journey with Cluster Luck FX, a cutting-edge Expert Advisor specifically calibrated for the GBPJPY H1 timeframe. Boasting a repository of 100 dynamic strategies, this EA is a powerhouse for rapid-fire trades that demand precision and speed. Optimized for Contemporary Market Pulse: Cluster Luck FX represents the zenith of optimization, finely-tuned for the market’s pulse over the
FREE

Draw and Sync Objects Multiple Charts 1. Draw objects by key press. ( You must: 1. Press Function key => 2. Click where you want to draw => 3. Draw it => 4. Press ESC to complete). (If you don't want to draw after pressing function key, you must press ESC to cancel). 2. Developing : Sync selected objects to multiple charts by button. 3. Developing: Hide objects that do not belong to the current symbol (Objects drawn with this indicator will belong to the symbol they are plotted on. When your c
FREE

ST Ultimate Rectangle
Introducing our latest MT5 indicator: the upgraded Rectangle Object Indicator. This powerful tool boasts an enhanced rectangular object, allowing for simultaneous color fill and outlining. Plus, it offers the flexibility to display prices conveniently at both the top and bottom of the rectangle. Streamline your trading analysis with this versatile indicator, designed to provide clarity and precision in every trade.
We value your input in further refining our indicator
FREE

RENKO Reversal by StockGamblers Actually working RENKO in MT5. Uses "custom symbols" for drawing. You can apply any indicators with complete peace of mind. The movement of the last price is displayed in real during the formation of the "brick". Put the script in the MQL5/Experts folder. More precisely: C:\Users\user\AppData\Roaming\MetaQuotes\Terminal\terminal_number\MQL5\Experts Settings: ValuePerBar - height of the "brick" in points revCandle - multiplier for the height of the turning "brick".
FREE

This indicator calculates the volume profile and places labels that correspond to the VAH, VAL and POC levels, for each candle individually.
Indicator operation features The indicator works on the timeframes from M3 to MN, but it uses the history data of smaller periods: M1 - for periods from M3 to H1, M5 - for periods from H2 to H12, M30 - for the D1 period, H4 - for the W1 period, D1 - for the MN period. The color and location of the VAL, VAH and POC labels on the current candle are consider
FREE

The Monthly Weekly Open Line is an indicator that plots: The current month open line that will extend till the last week on the month. Weekly lines that span the look back days period that you have set . Each line will extend from the respective weekly Monday zero GMT till friday of the respective week. Monthly and Weekly open lines can be used to build very powerfull anc consistent trading strategies. They act as natural S/R price barriers.
FREE

The Hybrid Stochastic indicator is a Stochastic RSI described by the famous Tushar Chande and Stanley Kroll in their book called " The New Technical Trader" . The main goal of this indicator is to generate more Overbought and Oversold signals than the traditional Relative Strength indicator (RSI). Combining these 2 indicators expands the range of the overbought and oversold territory. The idea behind it is to use the Stochastic formula over RSI values. If you want to know more about its internal
FREE

この指標は、こちらからダウンロードできるMy candleの完全版のデモ版です: Candle Patterns Creator 完全版では、独自のローソク足ルールを作成したり、従来のローソク足パターンを戦略に合わせてより正確に修正することができます。 この指標にはいくつかのローソク足ルールの例が含まれていますが、ここではいくつかをご紹介します: Pattern Rule Candle Green C > O Candle Red C < O Doji C = O Hammer (C > O and (C-O) *2 < O-L and (C-O) *0.5 > H-C) or (C < O and (O-C) *2 < C-L and (O-C) *0.5 > H-O) Hammer Green C > O and (C-O) *2 < O-L and (C-O) *0.5 > H-C Hammer Red C < O and (O-C) *2 < C-L and (O-C) *0.5 > H-O Marubozu (C > O and C-O > (H-L) * 0.7 ) or
FREE

The DJ_M5_810504785_L_OD_CF_1522_SQX is an algorithmic trading strategy for MetaTrader, tested on DJ using the M5 timeframe from December 7, 2017, to June 2, 2023. There is no need to set up parameters, all settings are already optimized and fine-tuned.
Recommended broker RoboForex because of EET timezone.
You can find the strategy source code for StrategyQuant at the link: http://webdev.quantmonitor.net/listing/dow-jones-bollinger-master/
Key details are:
MagicNumber: 810504785 Mai
FREE

Cybertrade Agile and Flexible - MT5 (Your strategy in any market) Flexible EA regarding parameterization, where the trader can configure his own setup, risk management and trading plan. Our EA is an advanced, high quality solution, always developed with attention focused on performance and flexibility of use and also always attentive to the need of traders to work in different ways. With the diversity of indicators and parameters available, it is possible to develop an infinity of setups. Any i
FREE

This indicator calculates gann support and resistance prices with use gann pyramid formulation and draw them on the chart. And If you want, Indicator can alert you when the current price arrive these pivot levels. Alert Options: Send Mobil Message, Send E-mail, Show Message and Sound Alert Levels: S1, S2, S3, S4, S5, R1, R2, R3, R4, R5 Inputs: GannInputPrice: Input price for gann pyramid formulation. GannInputDigit: How many digit do you want to use for calculation formula. (The number and the
FREE
これは、外国為替ペア、株価指数、個別株、債券、およびいくつかの商品を含むほとんどの市場で取引できる、高い勝率の平均回帰戦略です。 このエキスパートアドバイザーは、堅牢で機能することが実証された取引原則と統計ルールに基づいて構築されており、BS はありません。 ターゲット市場に合わせて Expert Advisor をバックテストして最適化します。 相関関係のない複数の市場で EA を実行し、より優れた分散ポートフォリオと信頼性の高いパフォーマンスとリターンを実現します。 取引市場の最適化とバックテストの結果に基づいて、最も可能性の高い結果の予測シミュレーション テストを実行します。 希望するドローダウンとパフォーマンスに合わせて取引ごとのリスクを設定し、それに応じてライブ戦略で取引ロットサイズを設定します。 あなたがリスクを調整するためにこの部分に注意を払い、相関関係のない商品の小さなバスケットで戦略を取引する場合、統計的な可能性をすべて自分に有利に置くことになります。 製品が気に入ったら、レビューを書いてください。
これは経済的なアドバイスではなく、教育と娯楽のみを目的としてい
FREE

This indicator allows you to measure retracements of price between any two points in either direction. It displays the price points, percentages and also displays the extension levels.
User may Modify and Add addition levels and extensions." User may also Add multiple Fibonacci indicators on the chart and change their colors, style and sizes.
Can be used on any timeframe.
This is the only Fibonacci Tool you'll need to measure and trade on Structure.
MT4 Version Available as well.
ADDI
FREE

Genaral: Not martingale, not a grid; Use on EURUSD Use on M5
Signals: There is a good rational algorithm. Work of two indicators: Chaikin and DeMarker (from 2 timeframes) (you can set a separate Timeframe for each indicator)
Stop Loss/Take Profit: There is a good money management system (there are several type for trailing stop loss); There is virtual levels of Stop Loss / Take Profit; There is smart lot (percent by risk) or fix lot
Important: EA can work on closed candles, and on c
FREE

この専門家アドバイザーは、 Rule Plotter インジケーター内で作成された戦略をテストおよび実行するために設計されています。 使用方法: Rule Plotter - プログラミング不要のトレードシステムを作成するツール を無料でダウンロードしてください。 次に、Rule Plotter インジケーターで戦略を開発してください。 最後に、この専門家アドバイザーを使用して作成した戦略を実行してください。 パラメータ: Strategy : Rule Plotter インジケーター内で作成したトレードシステムです。 Lot: 取引量。0に設定すると、専門家アドバイザーは最小取引量で取引します。 Take: 利益を取るティック数。0に設定すると、取引に利益を取らないことを意味します。 Stop: 損失を止めるティック数。0に設定すると、取引に損失を止めないことを意味します。 Magic ID: このパラメータを使用すると、同じアセットでこの専門家アドバイザーの複数のバージョンを実行でき、Magic ID番号だけを変更すればよくなります。 新しいプロジェクトを公開したときに通知を受ける
FREE

((M1 Eurusd 10年セット))についてはコメント#1を参照してください。 1- EAが機能している間は、チャートに別のインジケーターを追加することはできません。 2-そのようなチャートでEAを停止したい場合は、チャートから削除します。 Ctrl-Eを押すと、すべてのEAが停止し、他のチャートでチャンスを逃し、トレーリングストップが自動的に停止するためです。 3-各チャートは1つのEAで機能し、異なるマジックナンバーuは例を追加します:(chart#1)1231242(chart#2)1231352 4-コンピュータとインターネットがノートを処理できる場合は、同時に100以上のチャートを開くことができます(Eaはインジケーターに直接基づいているため、インジケーターに複雑なアルゴリズムは必要ありません) 5-各チャートにはフレームとEA(マジックナンバーが異なる)があります。他のフレームでより良いチャンスが見られる場合は、チャートを変更できます 6-大きなフレームは色付きの領域を見る必要がなく、特別にH12 H4 H1デイリーで動作するレディセットがあります(セットやその他の質問
FREE

Outside day trading strategy looks for a specific pattern in the price chart of a security.
The pattern is characterized by a larger range than the previous day, with the high of the day higher than the previous day's high and the low of the day lower than the previous day's low.
Works with many symbols, such as BTCUSD, GBPUSD,USDCAD, oil, gas, and others. PLEASE RATE! Thank you very much!
FEATURES:
- Real Strategy - Daily Bar Strategy - Exit the trade if the day was profitable - ATR multip
FREE
PREDICTOR MASTER(プレディクターマスター):
商品紹介:Predictor Master エキスパートアドバイザー
Predictor Master エキスパートアドバイザーは、効率的かつ精度の高い金融市場での取引を目指した先進の自動取引システムです。この強力なEAは、カスタム指標とインテリジェントな戦略の組み合わせを活用して、収益性の高い取引機会を追求します。
カスタム指標「Predictor」: Predictor Masterの中心は、革新的なカスタム指標である「Predictor(プレディクター)」です。この指標は、過去の市場パターンから学習する最新のニューラルネットワークによって駆動されています。上昇トレンド(bull)と下降トレンド(bear)の情報を使用することで、Predictor Masterは将来の市場方向をより確率的に特定し、正確なエントリーや出口のシグナルを提供します。
サポート&レジスタンス戦略とオーダーグリッド: Predictor Masterは、サポートとレジスタンスに基づく戦略を採用し、取引のエントリーポイントと出口ポ
FREE

説明 :
外国為替市場(PSAR)で専門的で人気のあるインジケーターの1つに基づいた新しい無料インジケーターをご紹介します。このインジケーターは元のパラボリックSARインジケーターの新しい変更です。プロSARインジケーターでは、ドットと価格チャートのクロスオーバーを見ることができます。クロスオーバーはシグナルではありませんが、動きの終わりの可能性について話します。新しい青いドットで購入を開始し、最初の青いドットの1 atr前にストップロスを配置し、最後にドットが価格チャートを横切るとすぐに終了できます。
売買シグナルを開く方法は? 最初の青い点によるオープンバイトレードと最初の赤いドットによるオープンセルトレード
正しいストップロスはどこにありますか? 安全なストップロスは最初のドットにある可能性があります(最初の青いドットの買いの場合と最初の赤い点の売りの場合)
正しいテイクプロフィットはどこにありますか? テイクプロフィットはストップロス距離とRRに基づいて調整できるので、私の提案は2 RRで、ストップロスの2倍です。
利益を上げているのにtpを達成でき
FREE

Imagine VWAP, MVWAP and MIDAS in one place... Well, you found it! Now you can track the movement of Big Players in various ways, as they in general pursue the benchmarks related to this measuring, gauging if they had good execution or poor execution on their orders. Traders and analysts use the VWAP to eliminate the noise that occurs throughout the day, so they can measure what prices buyers and sellers are really trading. VWAP gives traders insight into how a stock trades for that day and deter
FREE

Airiamu ni aimashou. Kanojo wa māchingēru ya guriddo shisutemu o shiyō shite imasen. Tesuto wa EURUSD H 1 de okonawa remashitaga, hoka no tsūka pea mo kinō suru kanōsei ga arimasu. Watashi wa kono botto o sakusei suru tame ni nemurenu tsuki o nan-kagetsu mo tsuiyashimashitaga, tekisetsuna tesuto o hete hajimete, kyōyū suru junbi ga dekita to kanjimashita. Okonawa reta tesuto no sukurīnshotto ga fukuma rete imasu. Deforuto settei wa watashi ga shiyō shita monodesu. Gaikoku kawase torihiki ni wa t
FREE

John Bollinger created this indicator in 2010 as a way to read the original indicator (Bollinger Bands) in a more "technical" way, shown as an oscillator. The typical range of the Bollinger Bands %B is 0 - 0.5 - 1.0, where "0" represents the lower band, the "0.5" the middle band, and "1" the upper band. The line on the indicator represents the Closing prices. As simple as that.
SETTINGS
Bollinger Bands period of analysis Standard Deviation multiplier Shift Price type to be analyzed
If you
FREE

Fundamentação teórica A VWAP é uma média móvel ajustada pelo volume, ou seja o peso de cada preço corresponde ao volume de ações negociadas no período, dando mais importância ao período em que se tenha mais negociações. [1] VWAP = sum(price[i]*volume[i]) / sum(volume[i]) Metodologia É possível configurar o período que será utilizado para o calculo da VWAP, a cor, a espessura e o estilo da linha. A linha é desenhada desde a o começo da série disponível apenas uma vez para economizar recursos com
FREE

This indicator show Gann Swing Chart (One Bar) with multi layer wave. 1. Wave layer F1: Gann waves are drawn based on candles. SGann wave(Swing of Gann) is drawn based on Gann wave of wave layer F1. 2. Wave layer F2: Is a Gann wave drawn based on the SGann wave of wave layer F1. SGann waves are drawn based on Gann waves of wave layer F2. 3. Wave layer F3: Is a Gann wave drawn based on the SGann wave of wave layer F2. SGann waves are drawn based on Gann waves of wave layer F3. ---------Vi
FREE

For MT4 version please click here . Introduction Most traders use candle patterns as a confirmation tool before entering a trade. As you know there are lots of candle patterns out there. However I realized most of them can be generalized in simple rules. So I developed my own candle pattern(Although I cannot say for sure this is mine). pattern description The pattern consists of three consecutive candles. This is true for most of the patterns out there (considering there is a confirmation neces
FREE

Minimalist style BB indicator fully filled with a single color. Indicator type: Technical Indicator You are too confused with the complicated zigzag lines in the BB indicator, especially when your strategy has many indicators combined, it looks like a mess and we will no longer see any candlesticks on the chart for technical analysis s. This indicator was born to solve that. See more: New tradingview indicator: Order Block TV | Minimalist Price Action Strategy | Subscribe It is designed
FREE

Highly configurable Macd indicator.
Features: Highly customizable alert functions (at levels, crosses, direction changes via email, push, sound, popup) Multi timeframe ability Color customization (at levels, crosses, direction changes) Linear interpolation and histogram mode options Works on strategy tester in multi timeframe mode (at weekend without ticks also) Adjustable Levels Parameters:
Macd Timeframe: You can set the lower/higher timeframes for Macd. Macd Bar Shift: you can set the
FREE

This EA uses the 20-period simple moving average (SMA).
Buy position when the price above the SMA and Sell vice-versa.
Extra indicators use to confirm the entry open.
The EA will use trailing stop loss to take the maximum profit.
Step positions will executed when the last floating position is met.
This EA tested on XAUUSD pair and may works on other pairs.
Good Luck!
FREE

There is a science, named Quantitative Finance, that allows to study the financial derivative pricing models using the methods of theoretical and mathematical physics.
Lately I came across a paper that describes a new indicator for technical analysis that combines ideas from quantum physics and brings them to finance. I got interested in it and decided I would teach how to implement indicators based on a scientific papers in MQL5.
The original Moving Mini-Max paper [2] is written by Z.K. Sila
FREE

This Mt5 Indicator Signals when there is two opposite direction bars engulfed by current bar. has a recent Exponential Moving Average Cross and past bar was oversold/bought Expert Advisor Available in Comments Free Version Here : https://www.mql5.com/en/market/product/110114?source=Site  ; Full Alerts for mt5 terminal , phone , email, print to file, print to journal Buy Signal ( blue line ) Past ema cross ( set at 30 bars back ) Past bar rsi is oversold ( level 40 ) Engulfing bar closes
FREE

VR グリッド インジケーターは、ユーザー定義の設定を使用してグラフィカル グリッドを作成するように 設計 されています。 標準グリッド とは異なり、VR グリッドは 円形レベル を構築するために使用されます。ユーザーの選択に応じて、ラウンド レベル間のステップは任意に設定できます。さらに、他のインジケーターやユーティリティとは異なり、VR Grid は期間が変更されたり、端末が再起動されたりした場合でも、 グリッドの位置を維持 します。 設定、設定ファイル、デモ版、説明書、問題解決方法は、以下から入手できます。 [ブログ]
レビューを読んだり書いたりすることができます。 [リンク]
のバージョン [MetaTrader 4] 垂直レベル は実際の時間間隔に基づいており、 欠落している または存在しない期間は無視します。したがって、レベル間のステップは、ユーザーが選択した値に厳密に対応します。 VR グリッド インジケーターを使用すると、トレーダーは任意のレベルで 垂直線と水平線のスタイル 、色、太さを変更できます。これにより、金融商品の ラウンドレベル を制御できます。 ラウ
FREE

This is the Chandelier Exit trend indicator applied to heiken ashi candles based on "G TREND GUNBOT" by "LUIS_GANDATA_G_TREND" on tradingview. Heiken ashi candles filter out many of the chops and therefore as an input to Chandelier Exit you achieve well filtered Buy and Sell signals. Also you can choose to apply the trend indicator to normal candles via input tab. (two in one indicator) This is a non-repaint and light processing load indicator. You can message in private chat for further change
FREE
Trade donchian breakouts with complete freedom. This EA can trade any breakout period, any timeframe, with pending or market orders- as desired- and implements many other useful features for the exigent trader, like customizable trading sessions and week days, a martingale mode and inverse martingale mode. [ Installation Guide | Update Guide | Troubleshooting | FAQ | All Products ] Easy to use and supervise Customizable trading direction Customizable donchian breakout period It can trade using
FREE

This EA uses the MACD Crossover Strategy. Entries opened when the signal and MACD line cross each other. The Buy position entered only when the cross is below the zero line while the Sell position entered above the zero line. The Moving Average Convergence/Divergence (MACD) is an oscillator that combines two exponential moving averages (EMA)—the 26-period and the 12-period—to indicate the momentum of a bullish or bearish trend. MACD can be used to signal opportunities to enter and exit positions
FREE

Always backtest before using.
MintyGrid is a simple EA that has an RSI indicator. On winning trades MintyGrid will take profit based on configuration. On losing trades MintyGrid uses a grid strategy to place resistance points using a martingale/reverse-martingale strategy to be prepared for when the market swings in the opposite direction. MintyGrid can be configured to run on many currency pairs simultaneously and will work as long as the pairs are similar in price. MintyGrid always trades w
FREE

O Indicador valida a força da tendência utilizando o volume negociado. Os candles são mostrados na cor verde indicando força compradora e cor vermelha na força vendedora. O movimento é encerrado pelo SAR parabólico. Vantagens: Filtra distorções de preço sem volume financeiro; Filtra consolidações e movimentos laterais; Filtra divergências de volume pelo indicador Money Flow. Desvantagens: Não filtra todos os falsos rompimentos, visto que rompimentos importantes geram altos volumes financeiros; N
FREE

The DR IDR Range Indicator plots ADR, ODR and RDR ranges for a given amount of days in the past. A key feature that appears is that it calculates the success rate of the ranges for the shown days. This indicator is perfect for backtest since it shows ranges for all of the calculated days, not just the most recent sessions. PRO VERSION
https://www.mql5.com/en/market/product/93360 Remember: this free version counts neutral days as true days , so stats might be slightly inflated. To get perfect
FREE

DESCRIPCION GENERAL * Bot automático * Bot de uso exclusivo de la plataforma binary.com donde se podemos encontrar los Sintéticos * Mercado de Sintéticos recomendado Range Break 200 * Deposito mínimo para el Bot 1 000 USD CONFIGURACION * No cambiar los valores de las Bandas de Bollinguer * En el parámetro TP_of_SL poner 100 * El stop loss es automático *Temporalidad de vela recomendada 1 minuto Como recomendación si quieres usarlo con menos capital se sugiere que cambies el parámetro de mu
FREE

Channels indicator does not repaint as its based on projecting the falling and raising channels. As a trader you need a path to be able to place your buy and sell trades such as: Supply and Demand , Falling & raising channels. Falling and raising channels can be in any time frame and also can be in all time frames at the same time and the price always flows within these channels. Experienced trades will draw the key levels and channels around the time frames. But, they will not be able to draw
FREE

Presentation
Another indicator that makes scalping on tick charts easier, it displays an Heiken Ashi graph in Ticks.
It allows to detect entry points and trend reversals. Recommended number of ticks in a candle : 5, 13 or 21.
Parameters Ticks in candle: Number of ticks in a candle (default 5), Displays Trend arrows : displays a trend arrow based on EMA8 and EMA20 crossing, Displays MM50, Displays MM100, Max Candle (CPU): number of candles max to manage, low value will save ressources of
FREE

Introducing Market Maven FX – The Comprehensive Trading Solution for GBP/USD H1 Unlock the potential of your Forex trading with Market Maven FX, a cutting-edge expert advisor designed specifically for the GBP/USD H1 chart. With an ensemble of 16 sophisticated strategies, Market Maven FX meticulously monitors the market dynamics, ensuring trades are executed with precision and strategic insight. Key Performance Metrics: Total Net Profit: $28,593.77, showcasing robust profitability in a challengin
FREE

Free version of the TickScalper indicator. The Tick Scalp indicator is a trading assistant for a scalping trader. Works in a separate window. Tracks the momentary activity of the market, shows the graph of the movement of ticks and the strength of bulls or bears. Sometimes it can anticipate the beginning of a strong movement before any other indicators. Helps the trader to make a decision to open the desired order. Designed to work on any instrument. Used timeframes from M1 to M15. Has simple a
FREE
MetaTraderマーケットは自動売買ロボットとテクニカル指標を販売するための最もいい場所です。
魅力的なデザインと説明を備えたMetaTraderプラットフォーム用アプリを開発するだけでいいのです。マーケットでプロダクトをパブリッシュして何百万ものMetaTraderユーザーに提供する方法をご覧ください。
取引の機会を逃しています。
- 無料取引アプリ
- 8千を超えるシグナルをコピー
- 金融ニュースで金融マーケットを探索
新規登録
ログイン