YouTubeにあるマーケットチュートリアルビデオをご覧ください
ロボットや指標を購入する
仮想ホスティングで
EAを実行
EAを実行
ロボットや指標を購入前にテストする
マーケットで収入を得る
販売のためにプロダクトをプレゼンテーションする方法
MetaTrader 5のための無料のエキスパートアドバイザーとインディケータ - 13

The indicator displays the size of the spread for the current instrument on the chart. Very flexible in settings. It is possible to set the maximum value of the spread, upon exceeding which, the color of the spread label will change, and a signal will sound (if enabled in the settings). The indicator will be very convenient for people who trade on the news. You will never enter a trade with a large spread, as the indicator will notify you of this both visually and soundly. Input parameters: Aler
FREE

Build your EA with Build EA Simple, with it you can build your strategy with the available indicators and tools.
Build EA Simple does not have any defined strategy, but with it you can use combinations of indicators and use them as signals or filters and build your strategy!
Build EA Simple is a simplified version of Build EA that doesn't have as many tools. Discover Build EA Pro https://www.mql5.com/pt/market/product/88859?source=Unknown%3Ahttps%3A%2F%2Fwww.mql5.com%2Fpt%2Fmarket%2Fmy
I
FREE

AC Pivot Panel
AC Pivot Panel is a pivot point indicator including favorite selection panel accessible in the chart. For pivot traders, It is well convenient to easily and quickly can adjust their pivots setting in the chart. To reaching this goal, a panel has been considered to user can easily switch to each pivot levels by different method and time period. In the current version: All pivots including supports and resistance can be selected to display or disappear in the chart just by
FREE

Raymond Cloudy Day For EA: Introducing the Raymond Cloudy Day indicator, a revolutionary trading tool created by Raymond and expertly developed for the MT5 platform. This innovative indicator integrates a cutting-edge calculation method with advanced algorithms, surpassing traditional Pivot Points to enhance trading strategies with unparalleled precision. [Source Code] : View
Key Features: Innovative Calculation Method: The core of the Raymond Cloudy Day indicator features a unique calculatio
FREE

Bem-vindo a uma nova era de trading com o indicador AI Moving Average, um avançado indicador do MetaTrader 5 projetado para fornecer aos traders insights preditivos sobre os movimentos do mercado. Esta ferramenta combina o poder da IA com a confiabilidade de uma média móvel exponencial sem atraso para oferecer previsões precisas e oportunas das tendências futuras dos preços. Modelo Inovador de Regressão Linear O AI Moving Average aproveita um modelo de aprendizado de máquina de regressão linear
FREE

「Envelope of Adaptive Moving Average」インジケーターは、金融市場で賢明な意思決定を支援するツールです。これは、トレードにおけるトレンドの方向やエントリーおよび出口の可能性ポイントを明確に示すために設計されています。
このインジケーターは適応型移動平均に基づいており、市場のボラティリティの変化に自動的に適応します。これにより、穏やかな時期からボラティルな時期まで、さまざまな市場状況で有用です。このインジケーターは適応型移動平均を包む2本のラインを表示します。これらのラインはサポートとレジスタンスの重要なレベルを識別するのに役立ち、資産を買うか売るかの判断をより的確に行うのに役立ちます。
高度なテクニカルツールであるにもかかわらず、理解しやすく使いやすいため、初心者から経験豊富なトレーダーまでに適しています。このインジケーターは市場の変動に適応できる能力を持っており、さまざまな状況で効果的です。市場のトレンドを明確に視覚化し、衝動的な取引を避けるのに役立ちます。このインジケーターはトレーディングツールボックスの中で貴重なツールとなることでしょ
FREE

StopLevel メーターはSTOPLEVELレベルを制御します。レベルが変わると、アラートで合図します。 STOPLEVEL- ストップ注文を出すための現在の終値からのポイントでの最小オフセット、またはポイントでの最小許容ストップロス/テイクプロフィットレベル。 STOPLEVELのゼロ値は、ストップロス/テイクプロフィットの最小距離に制限がないこと、またはトレーディングサーバーが端末に送信できない動的レベル制御のための外部メカニズムを使用していることを意味します。 2番目のケースでは、STOPLEVELは実際には「フローティング」です。 インジケーター設定: color_-レベルのゾーンの色 draw_bars-レベルゾーンを表示するためのバーの数 width_price-価格ラベルの厚さ
FREE

This indicator shows current major support and resistance, if one exists. And as a support or resistance is broken it shows the new current, if any. To identify support and resistance points it uses the high and low points identified on the current chart. Allows too you to inform the maximum number of bars used to consider a support or resistance point still valid.
FREE

このアカウントで無料製品をサポートしてください。こちらのリンクを使用して、私たちの 推奨ブローカー に登録してください。
進化した取引ソリューションのご紹介:16以上のストラテジーを統合した専門家アドバイザー 自動取引の可能性を解き放ち、16以上の利益をもたらす戦略を一つの堅牢なツールに包括した専門家アドバイザー(EA)を誇らしくご紹介します。このEAは、グリッドやマーチンゲール戦略のようなリスクのある手法を採用せず、安全で信頼性の高い取引体験を提供する包括的な取引アプローチを誇っています。 安全性を最優先に: このEAの設計思想の基盤は安全性です。グリッドやマーチンゲール戦略を採用せずに動作するため、攻撃的な取引手法に伴う無用なリスクを最小限に抑えます。さらに、組み込まれた資産保護機能は大幅な資金の引き下げに対する防御壁となり、資本の安全性を確保する重要な機能です。 カスタマイズ可能な柔軟性: 適応性の重要性を認識し、当社のEAはカスタマイズ可能な設定を提供します。それには、希望に応じて同時に開くポジションや取引の数を制限する能力も含まれます。この柔軟性により、EAの機能を個々の
FREE

Fundamentação teórica A VWAP é uma média móvel ajustada pelo volume, ou seja o peso de cada preço corresponde ao volume de ações negociadas no período, dando mais importância ao período em que se tenha mais negociações. [1] VWAP = sum(price[i]*volume[i]) / sum(volume[i]) Metodologia É possível configurar o período que será utilizado para o calculo da VWAP, a cor, a espessura e o estilo da linha. A linha é desenhada desde a o começo da série disponível apenas uma vez para economizar recursos com
FREE

Highly configurable Williams %R indicator. Features: Highly customizable alert functions (at levels, crosses, direction changes via email, push, sound, popup) Multi timeframe ability Color customization (at levels, crosses, direction changes) Linear interpolation and histogram mode options Works on strategy tester in multi timeframe mode (at weekend without ticks also) Adjustable Levels Parameters:
Williams %R Timeframe: You can set the current or a higher timeframes for Williams %R. Williams
FREE

Average Session Range: Calculate and Average the Sessions High-Low Range of Specific Time Sessions Over Multiple Days. The Session Average Range is a sophisticated and precise tool designed to calculate the volatility of specific time sessions within the trading day. By meticulously analyzing the range between the high and low prices of a defined trading session over multiple days, this tool provides traders with a clear and actionable average range. **Note:** When the trading platform is closed
FREE

Relative Volume or RVOL is an indicator that averages the volume of X amount of days, making it easy to compare sessions volumes.
The histogram only has 3 colors:
Green - Above average volume
Yellow - Average volume
Red - Below average volume
The default setting is 20 days, which corresponds more or less to a month of trading.
In this version is possible to choose between tick and real volumes (if you are using a broker which offers future contracts)
With the data obtaine
FREE

VWAP RSJ is an indicator that plots the Hourly, Daily, Weekly and Monthly VWAP Lines.
Large institutional buyers and mutual funds use the VWAP ratio to help move into or out of stocks with as small of a market impact as possible. Therefore, when possible, institutions will try to buy below the VWAP, or sell above it. This way their actions push the price back toward the average, instead of away from it. Based on this information I developed this indicator that combines 4 types of VWAP T
FREE

The Spider ZIGZAG is an algorithm to determine how critical the current peak is by spreading several lines with different parameters instead of one line between each 2 peaks. 1. The more zigzag's lines meet at a peak the higher probability the market will go for correction or change direction. 2. Usually when 3-4 zigzag's lines meet at a peak, the market enters a correction period, this don't happen instantly, it might take some time. 3. Usually when 5-6 zigzag's lines meet at a peak, th
FREE

Displays a digital clock or a countdown (until new bar) in the chart in realtime.
Benefits: Current time always in sight for market open/close, economic data, etc. Displays accurate time (server/broker time) Keep an eye on how much time is left until a new bar starts (countdown) Clearly visible (set color, size, font, position) Always runs/refreshes every second even without new price tick Hint: To display the most accurate time, use the server (broker) clock setting combined with the time (ho
FREE

Hull Moving Average is more sensitive to the current price activity than a traditional Moving Average. It faster responds to trend change and more shows the price movement more accurately. This is a color version of the indicator. This indicator has been developed based in the original version created by Sergey <wizardserg@mail.ru>. Suitable for all timeframes.
Parameters Period - smoothing period, recommended values are 9 to 64. The larger the period, the softer the light. Method - smoothing
FREE

Prop Challenger EA is based on candlestick formation and trading time. Prop Challenger EA's strategy is to recognize the candlestick formation and position yourself approximately 3 minutes after the New York Stock Exchange opens. The positions that are in plus are accompanied by additional purchases and tight traillingstop! EA was tested in the XAUUSD M5, H1 strategy tester and adapted to this symbol. Experience trading at the highest level. With very small draw-down and the certainty of large l
FREE

The strategy is based on finding top and bottoms during the night flat range. The night flat range usually lasts during the Pacific and Asian trading session and is characterized by low volatility. Most night scalpers have one weakness, that is, small gains and few big losses which wipe all the small gains. This Scalper is using Neutral network to avoid days that can potentially have high volatility and result in big loses, Neutral network does this accurately . The Neutral network has currently
FREE

Volume Weighted Average Price or VWAP is an indicator wich shows different average prices on chart. This is very useful to find strong negotiation price areas and as trend following.
Configurations: Day, Week and Month - Show different VWAPs according to the period. You can change each line style on "colors" tab.
Any doubt or suggestion please contact us. Enjoy! This is a free indicator, but it took hours to develop. If you want to pay me a coffee, I appreciate a lot <3 PayPal, Skrill, Ne
FREE

This indicator is based on the Parabolic SAR indicator. It helps the user identifying whether to buy or sell. It comes with an alert that will sound whenever a new signal appears. It also features an email facility. Your email address and SMTP Server settings should be specified in the settings window of the "Mailbox" tab in your MetaTrader 5. Blue arrow up = Buy. Red arrow down = Sell. Line = Trailing Stop. You can use one of my Trailing Stop products that automatically move the Stop Loss and i
FREE

The indicator IQuantum shows trading signals for 10 symbols in the daily chart: AUDCAD, AUDUSD, EURUSD, GBPCAD, GBPCHF, GBPUSD, NZDUSD, USDCAD, USDCHF, and USDJPY.
Signals of the indicator are produced by 2 neural models which were trained independently from one another. The inputs for the neural models are normalised prices of the symbols, as well as prices of Gold, Silver and markers of the current day.
Each neural model was trained in 2 ways. The Ultimate mode is an overfitted neural mo
FREE

If you like to use traditional Moving Averages (like SMAs and EMAs) to provide your trades for dynamic levels of Support and Resistance, you will love the Adaptive Moving Average (AMA). Created in 1995 by Perry Kaufman and presented to the world in his book " Smarter Trading : Improving Performance in Changing Markets ", the Adaptive Moving Average (also known as KAMA - Kaufman Adaptive Moving Average) has the goal to be the perfect companion for following a trend without noise, but s
FREE
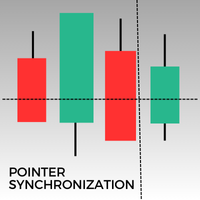
このMetaTrader 5インジケーターは、同じアセットのすべての開いているチャートにポインターを自動的に同期します。1分足チャートであれ、日足チャートであれ、ポインターはすべての開いているウィンドウで同じ価格に自動的に揃います。この機能により、一貫した迅速な分析が可能になり、意思決定が向上します。複数のチャート間でポインターを同期させることは、異なる時間枠で価格変動の正確な概要を維持しようとするトレーダーにとって、貴重なツールです。
FREE

Highly configurable RSI indicator. Features: Highly customizable alert functions (at levels, crosses, direction changes via email, push, sound, popup) Multi timeframe ability Color customization (at levels, crosses, direction changes) Linear interpolation and histogram mode options Works on strategy tester in multi timeframe mode (at weekend without ticks also) Adjustable Levels Parameters:
RSI Timeframe: You can set the current or a higher timeframes for RSI. RSI Bar Shift: you can set th
FREE

One of the best trend indicators available to the public. Trend is your friend. Works on any pair, index, commodities, and cryptocurrency Correct trend lines Multiple confirmation lines Bollinger Bands trend confirmation Trend reversal prediction Trailing stop loss lines Scalping mini trends Signals Alerts and Notifications Highly flexible Easy settings Let me know in the reviews section what you think about it and if there are any features missing.
Tips: Your confirmation line will predict tr
FREE

トレンドパネルは、ユーザーが選択した10ペアを使用して、時間枠M1〜D1の確認されたトレンド方向を表示するシンプルで便利なツールです。 インディケータは、任意の戦略/テンプレートに方向性の確認を追加するように設計されており、チャートを別のペアまたは時間枠にすばやく変更するためのクリーンなインタラクティブインターフェイスとしても機能します。 グループチャット: https://www.mql5.com/en/users/conorstephenson セットアップのアドバイスと無料のエキスパートアドバイザーについては、購入後に私に連絡してください! 私の製品はMQL5でのみ販売されています 。この製品を他の場所で見た場合、それは模倣品です。だまされてはいけません。 主な機能
チャート上のパネルをきれいにして、時間枠の傾向をすばやく判断できるようにします。 インタラクティブ機能。 チャート上のキャンドルの色を変更します-現在と過去のトレンドを簡単に確認できます。 ペアと時間枠のボタンはクリックすると機能し、現在開いているチャートを変更します。 チャートのパネルをクリックして、テンプレート
FREE

You may find this indicator helpfull if you are following a session based strategy. The bars are colored according to the sessions. Everything is customisable.
Settings: + Asia Session: zime, color, high, low + London Session: zime, color, high, low + US Session: zime, color, high, low
Please feel free to comment if you wish a feature and/or give a review. Thanks.
FREE

XAUUSD H1 Broker- VANTAGE RAW/EXNESS ZERO ACCOUNT MINIMUM DEPOSIT 200$ XAUUSD H1 According to the margin adjust the risk setting trade with EA goldsmith. And get your dream i have used for 3 to 5 months it works better and in live market working 100% dont judge while while checking with backset, only for xauusd i have set files, if your willing to trad
FREE

This indicator detects Sandwich Bars of several ranges, an extremely reliable breakout pattern. A sandwich setup consists on a single bar that engulfs several past bars, breaking and rejecting the complete price range. [ Installation Guide | Update Guide | Troubleshooting | FAQ | All Products ] Easy and effective usage Customizable bar ranges Customizable color selections The indicator implements visual/mail/push/sound alerts The indicator does not repaint or backpaint The indicator could not b
FREE

Break Even Line by MMD
The Break Even line is a useful indicator for people using strategies that allow simultaneous trades in both directions, such as the MMD methodology. This indicator is useful when playing statistical models and averaging positions in accumulation and distribution zones. The indicator draws levels by summing positions in three groups: positions included in BUY, positions included in SELL and all positions included.
Functionality description:
Show BUY BELine - shows
FREE

Edgeweasel ORB: 典型的なオープニングレンジブレイクアウト(ORB)エキスパートアドバイザーを超えるEA。この多機能なマルチアセットツールは、市場が開く直後に複数の金融商品を同時にスキャンし、取引機会を見つけることに優れています。設定可能なRSIフィルターを使用し、買われ過ぎや売られ過ぎの市場条件を正確にターゲットにし、全体的なパフォーマンスと成功率を大幅に向上させます。 多様なグローバルユーザーベースにサービスを提供するために、このアドバイザーは英語、ロシア語、 中国語 、 スペイン語、ポルトガル語(ブラジル)、ドイツ語*を含む多言語サポートを提供しています。その戦略は実証済みで堅牢であり、グリッドやマーチンゲール戦略への依存を避けています。戦略の設計に沿って、すべてのポジションと未決済の注文は、毎取引日の終わりに体系的にクローズされます。さらに、ランダムな時間設定を含む独特の機能があり、これによりユーザーはバックテストの結果とランダムな条件下で生成された結果を比較することができます。この機能は、正確なエキスパートアドバイザー(EA)の設定の重要性を強調しています。
FREE

(USDCHF,CADCHF,GBPCHF) 5MINUTES TIMEFRAME MIN 50$ ACCOUNT (EA IS IN LOW LEVEL RISK SETTING SO PROFIT WILL LOW.AFTER PURCHASE CONTACT OUR TEAM TO GET SETUP) Introducing "Grid Trend Reversal" Expert Advisor! Are you tired of manually analyzing market trends and waiting for the perfect moment to enter or exit tr
FREE
Trade donchian breakouts with complete freedom. This EA can trade any breakout period, any timeframe, with pending or market orders- as desired- and implements many other useful features for the exigent trader, like customizable trading sessions and week days, a martingale mode and inverse martingale mode. [ Installation Guide | Update Guide | Troubleshooting | FAQ | All Products ] Easy to use and supervise Customizable trading direction Customizable donchian breakout period It can trade using
FREE

The Monthly Weekly Open Line is an indicator that plots: The current month open line that will extend till the last week on the month. Weekly lines that span the look back days period that you have set . Each line will extend from the respective weekly Monday zero GMT till friday of the respective week. Monthly and Weekly open lines can be used to build very powerfull anc consistent trading strategies. They act as natural S/R price barriers.
FREE
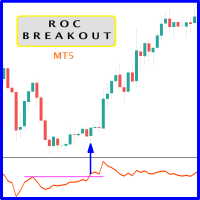
When prices breakout resistance levels are combined with Rate of Change oscillator "ROC" oscillator breaks out its historical resistance levels then probability emerges to record farther prices. It's strongly encouraged to confirm price breakout with oscillator breakout since they have comparable effects to price breaking support and resistance levels; surely, short trades will have the same perception. Concept is based on find swing levels which based on number of bars by each side to confirm
FREE

Breakout MV : This Expert Advisor offers you one of the most fundamental trading strategy, combining Moving Average and Volums indicators!
Key Features : Consistent Performance : Breakout strategy has demonstrated a robust performance across various market conditions, by capitalizing on significant price movements. Strategic Trade Execution : We select the desired range, and once the price approaches these levels and the indicators confirm our entry, we open a trade. The trade will close ei
FREE

Blahtech Moving Average indicator is a multitimeframe version of the standard Moving Average indicator. It is also enhanced with customisable alerts, period breaks and other configuration options. The 50 day and 200 day moving averages are widely followed by investors and traders, with breaks above and below the MA lines considered to be signals of interest. Links [ Install | Update | Training | All Products ]
Feature Highlights Up to three timeframes Configurable calculation variab
FREE

このアルゴリズムは、Currency PowerMeterインジケーターのアイデアに基づいています。このバージョンでは、表示される値の数は無制限であり、そのコードはよりコンパクトで高速であり、現在のバーの値はインジケーターバッファーを介して取得できます。 インジケーターが示すもの :細いバンドと通貨の前の上の数字は過去N時間の相対力指数を示し(Nは変数「時間」のパラメーターで設定されます)、広いバンドは日次インデックスを示します。入力パラメーターで指定するこの通貨を使用する通貨ペアが多いほど(ブローカーがペアの見積もりを提供すると仮定)、インデックスの重みが大きくなります(ただし、「非メジャー」通貨またはエキゾチック通貨のペアには注意してください。全体像を歪める)。たとえば、EURUSDのみを指定した場合、ユーロの相対インデックスはこのペアのみに基づいて計算されます。EURGBPを追加すると、ユーロインデックスは2つのペアに基づいて計算され、より重み付けされた値が取得されます。 データの使用方法 :重要なニュースがない場合、インデックス値が低い/高いほど、技術的な修正またはトレンドの継
FREE

The "Simple Trading Controller" for MetaTrader 5 sets a new standard for speed and efficiency in opening and closing market positions. Crafted with a clean and intuitive design, this tool is a response to the specific needs of traders, ensuring a seamless and rapid trading experience. All it provides is: Quick BUY and SELL Buttons Open multiple operations at the same time Set Trade Size Set Stop Loss Take Profit Points Close All Positions Let's go and see the advantages of using "Simple Trading
FREE

The XU_H4_910440109_S_PS_CF_SQX is an algorithmic trading strategy for MetaTrader, tested on XAUUSD (Gold) using the H4 timeframe from April 1, 2004, to April 24, 2024. There is no need to set up parameters, all settings are already optimized and fine-tuned.
Recommended broker RoboForex because of EET timezone.
You can find the strategy source code for StrategyQuant at the link: http://quantmonitor.net/listing/gold-bulls-power-trader/
Key details are:
Parameters
MagicNumber: 91044
FREE

Schaff Trend Cycle (STC) "CON ALERTAS"
El Indicador Schaff Trend Cycle (STC) es una herramienta técnica utilizada en el trading e inversión para identificar tendencias y generar señales de compra o venta. ¿Qué es el Schaff Trend Cycle? El STC fue desarrollado por Doug Schaff para mejorar las medias móviles incorporando análisis de ciclos. Su objetivo es identificar tendencias y cambios de tendencia midiendo la fuerza y velocidad de los cambios de precio. Es un oscilador que mide la velocida
FREE

This auxiliary indicator displays time left before closing on the current timeframe with continuous update . It also shows the last trade price and variation from a previous day close in percentage and points. This indicator is pretty handy for daytraders and scalpers who want to precisely monitor closing and opening of candles.
Indicator parameters Show in shifted end - Default: False. Display time and values on screen. If True, Displays only time to close aside last candle. Distance from the
FREE

There is a science, named Quantitative Finance, that allows to study the financial derivative pricing models using the methods of theoretical and mathematical physics.
Lately I came across a paper that describes a new indicator for technical analysis that combines ideas from quantum physics and brings them to finance. I got interested in it and decided I would teach how to implement indicators based on a scientific papers in MQL5.
The original Moving Mini-Max paper [2] is written by Z.K. Sila
FREE

This is the Volume Avarage Weighted Price (VWAP) it's a indicator that shows where is the avarage of the current volumes and the levels at which the price is considered premium, above the second upper band, or discount, under the second lower band, it's also very usefull to use the VWAP level as a target for operations since it's a very liquid level so the price it's attracted to it. feel free to leave a feedback either positive or negative based on your expereince with this indicator, enjoy the
FREE

Always backtest before using.
MintyGrid is a simple EA that does not use indicators. On winning trades MintyGrid will take profit based on configuration. On losing trades MintyGrid uses a grid strategy to place resistance points using a martingale/reverse-martingale strategy to be prepared for when the market swings in the opposite direction. MintyGrid always trades within its grid configuration. Recommended usage is on a cent account with at least 100 EUR (10000 Euro Cents) and high leverage
FREE

True Days is a tool designed specifically for the trader who wants to catch intraday volatility in price charts. True day makes it easier for the trader to avoid trading in the dead zone - a period in time where markets are considered dead or non volatile. The trader can concentrate on finding opportunities only during periods of profound market movements. By default the indicator gives you a true day starting at 02:00 to 19:00 hours GMT+2. You can adjust according to your Time Zone. By deafult
FREE

The "Trend Fishing Indicator" is a powerful custom indicator designed to help traders identify potential trend reversal points and capitalize on market momentum. This indicator uses multiple moving averages of varying periods to evaluate short-term and long-term market trends. By comparing the short-term moving averages against the long-term ones, it generates clear buy and sell signals that can guide traders in making informed trading decisions. Key Features: Multiple Moving Averages : Incorpor
FREE

Indicator IRush uses a modified version of a popular indicator RSI (Relative Strength Index) to look for entries on a daily chart or lower. The indicator has been set up and tested with the major symbols: AUDUSD, EURUSD, GBPUSD, USDCAD, USDCHF, and USDJPY. An automated trading with this indicator is implemented in the expert advisor Intraday Rush . This expert advisor can open, trail and close its trades. Check it out, it may be exactly what you are looking for!
A Correct Reading of IRush
Th
FREE

The purpose of using Smart money index (SMI) or smart money flow index is to find out investors sentiment. The index was constructed by Don Hays and measures the market action. The indicator is based on intra-day price patterns. The beginning of the trading day is supposed to represent the trading by retail traders. The majority of retail traders overreact at the beginning of the trading day because of the overnight news and economic data. There is also a lot of buying on market orders and shor
FREE

Are you tired of trading without a clear direction ? Do market fluctuations and noise leave you feeling overwhelmed ?
Here is the solution you've been searching for! Imagine an indicator that simplifies trading, cuts through market noise, and provides crystal-clear signals. The Heiken Ashi OHLC Indicator does just that!
What does the Heiken Ashi OHLC Indicator do? It transforms traditional candlestick charts into a trader's dream. Instead of dealing with erratic price movements, you'll wi
FREE

Do you want to see the most relevant supports and resistances at a glance? Tired of tracing the levels by hand? Multi Levels Detector is an indicator for MetaTrader that will draw supports and resistances according to the parameters entered, and also offers the possibility of executing an alert every time the price reaches any of its levels.
SETTINGS UsePercentage: Allows you to configure whether the distances between levels will be measured in points, or by a percentage of the asset.
TimeFr
FREE

すべてのストラテジーをスキャンし、選択したアクティブのすべてのタイムフレームでの買いポイントと売りポイントを表示するスキャナーをお持ちになったことはありますか? それがまさにこのスキャナーが行うことです。このスキャナーは、 Rule Plotter: プログラミング不要のストラテジー作成ツール で作成した買いシグナルと売りシグナルを表示し、さまざまなアクティブとタイムフレームで実行するために設計されています。 Rule Plotterのデフォルトストラテジーは陽線と陰線だけです。つまり、Rule Plotter内に何のストラテジーも描かない場合、このスキャナーは選択したアクティブのすべてのタイムフレームでのキャンドルの色を表示します。キャンドルが陰線の場合は赤で、陽線の場合は緑です。 好きなだけストラテジーを作成 標準のストラテジーに制限されることはありません。Metatraderで利用可能なすべての指標を使用して従来のストラテジーを構築するか、お好きな指標を使用してカスタムストラテジーを構築できます。 このスキャナーはRule Plotterが提供するもののほんの一部であり、Rule
FREE

The Color Candles Indicator uses custom colors to highlight candles that follow the main market trend, based on the Moving Average. This simplifies the analysis of price movements, making it clearer and more direct. When the price is above the rising Moving Average, candles are highlighted indicating a BUY opportunity. When the price is below the declining Moving Average, candles are highlighted indicating a SELL opportunity.
Input Parameters : Period Method Applied Price
The moving avera
FREE

Andrew Pitch fork is one of the most interesting string trend & Channel & Fibo technical analysis , it's like ALL in ONE tool would be very enough for you.
FYI, This indicator will expire by end of July 2022.
Using 2 Andrew pitch Forks with 2 different time frames on same chart is really very hard working and might be impossible , but with this indicator is possible now , moreover , using this method as Candle Volume based analysis give strong trust for your trade.
I assume if you are hav
FREE

Airiamu ni aimashou. Kanojo wa māchingēru ya guriddo shisutemu o shiyō shite imasen. Tesuto wa EURUSD H 1 de okonawa remashitaga, hoka no tsūka pea mo kinō suru kanōsei ga arimasu. Watashi wa kono botto o sakusei suru tame ni nemurenu tsuki o nan-kagetsu mo tsuiyashimashitaga, tekisetsuna tesuto o hete hajimete, kyōyū suru junbi ga dekita to kanjimashita. Okonawa reta tesuto no sukurīnshotto ga fukuma rete imasu. Deforuto settei wa watashi ga shiyō shita monodesu. Gaikoku kawase torihiki ni wa t
FREE

The provided code is an example of an Expert Advisor (EA) written in MQL5, a programming language used for creating algorithmic trading systems in MetaTrader 5. Here is a breakdown of the code:
The code begins with various input parameters and settings defined using the input keyword. These parameters allow customization of the EA's behavior, such as entry lots, stop loss, take profit, and indicator parameters.
Several constant values and variables are declared, including session time setti
FREE

The "Standardize" indicator is a technical analysis tool designed to standardize and smooth price or volume data to highlight significant patterns and reduce market noise, making it easier to interpret and analyze.
Description & Functionality: Standardization : The indicator standardizes price or volume values by subtracting the mean and dividing by the standard deviation. This converts the data into a distribution with zero mean and standard deviation of one, allowing different data sets
FREE
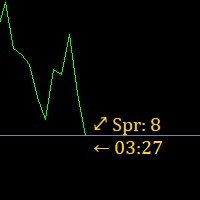
Super simple, convenient, useful tool. Allows displaying the end time of a candle (standard) and expanding the symbol's spread in real time.
The countdown tool is smooth, not jerky or slow like some other tools
Useful tool for professional traders specializing in short-term and long-term trading.
Contact author or user guide: https://www.mql5.com/en/channels/metool_trading
FREE

PreCogniTrade : Un Indicador Técnico Avanzado para Predecir el Mercado (Fase Beta) El PreCogniTrade es un indicador técnico revolucionario diseñado para los traders que buscan una ventaja competitiva en los mercados financieros. Este indicador no solo analiza las tendencias actuales, sino que también predice los movimientos futuros de los precios con una precisión asombrosa, lo que lo convierte en una herramienta de incalculable valor para cualquier estrategia de trading. Características Pr
FREE

Volume Weighted Average Price (VWAP) is a trading benchmark commonly used by Big Players that gives the average price a Symbol has traded throughout the day. It is based on both Volume and price. Additionally we put in this indicator the MVWAP (Moving Volume Weighted Average Price). For those who do not know the usage and the importance od this indicator I recommend a great article about this subject at Investopedia ( https://www.investopedia.com/articles/trading/11/trading-with-vwap-mvwap.asp
FREE
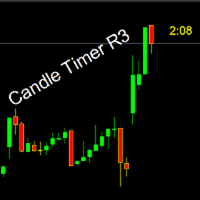
Timer remaining to finish the candle. A simple informative indicator of how much time is left until the current candle ends. In a simple, easy and objective way. In the input parameters, enter the desired color of the clock, the font size and the displacement to the right of the candle. I hope I helped with this useful and free tool. Make good use and good business.
FREE

This indicator shows the breakeven line level for the total number of open positions of the current symbol with P/L value and total volume. This indicator is helpful to decide the exit level when using a trading grid strategy. The style of the breakeven line is customizable to choose the color, line shape and font size of the positions description. Send mobile notification when crossing a positive P/L target
FREE
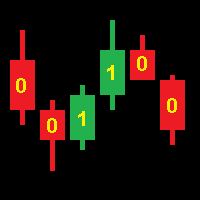
Operation of the CodEx Expert Advisor is based on patterns composed of consecutive candles. Positions are closed when opposite signals appear. Sequences of candles are encoded into an integer according to the following rule. The code number must be converted to binary form and the highest bit must be discarded. The resulting sequence of bits encodes a continuous sequence of candles, where 1 is a bullish candle, 0 is a bearish candle. The higher bits encode the earlier candles. For example: 19[10
FREE

In which direction should I trade today? For “TREND followers”, we need to determine the TREND . This indicator determines the Trend based on the price High, Low and Close of every bar, for a given period and timeframe. Calculating and plotting the Trend UP and Trend DOWN lines. If the: “Trend UP” line (Green) is above the “Trend DOWN” line (Red), then it is a BULLISH Trend (see "Screenshots" tab). “Trend DOWN” line (Red) is above the “Trend UP” line (Green), then it is a BEARISH Trend (see "
FREE
White label available. contact us for more info. dushshantharajkumar@gmail.com
Chart Walker X Engine "Chart Walker" stands as a pinnacle of precision in the realm of MT5 trading signal engines. Leveraging advanced algorithms and cutting-edge technology, Chart Walker meticulously scans financial markets, discerning patterns, trends, and indicators with unparalleled accuracy. Its robust architecture allows it to analyze vast datasets swiftly, providing traders with real-time insights and action
FREE

Elevate your trading with this Metatrader 5 expert – the Position Volume Calculator. This tool takes the guesswork out of risk management and profit optimization. Simply input your desired stop-loss points with dragging the stop-loss line, and let the expert advisor compute the optimal position volume for your trade. Plus, with customizable reward ratios, it's easier than ever to set your take-profit points for maximum gains. Trade with confidence and precision. Try the Position Volume Calculat
FREE

Introduction
Auto Chart Alert is a convenient tool to set alert for your trading in your chart. With Auto Chart Alert, you can set the alert line in one click in your desired location in your chart. You can even set alert over the sloped lines in your chart. Auto Chart Alert is a great tool when you have to watch out importnat support and resistance levels for your trading. You can receive the sound alert, email and push notification when the price hit the alert line at you desired location. A
FREE

コアラトレンドラインがバージョン1.2にアップグレードされました
最終アップグレードの改善:ユーザーがトレンドラインを2番目、3番目、またはX番目の最高点または最低点に接続できるようにする新しいパラメーターが追加されました。
私の要求 :
**親愛なるお客様はコアラトレンドラインであなたのレビューをリリースしてください、そしてあなたのフィードバックによって私に改善させてください。
コアラのトレンドラインが無料の指標である理由
無料の指標は適格なツールでなければならないと私は信じています。
他の無料製品についてはどうですか?
緑のコアラのロゴが入った商品はすべて私の無料商品です
https://www.mql5.com/en/users/ashkan.nikrou/seller#products
コアラトレンドラインの紹介:
トレーダーがトレンドをよりよく見つけるのを助けるためにこのインジケーターを作成しました。このインジケーターは現在のトレンドラインを示すことができます。
ご存知のように、トレンドラインは2つの最高点または最低点の間
FREE

En esta versión, las alertas están funcionando y en la versión que publicó, la zona muerta de atr era solo una zona muerta sin atr, por lo que también la convirtió en una zona muerta de atr.
Indicator input parameters input int Fast_MA = 20; // Period of the fast MACD moving average input int Slow_MA = 40; // Period of the slow MACD moving average input int BBPeriod=20; // Bollinger period input double BBDeviation=2.0; // Number of Bollinger deviations input int Sensetiv
FREE
MetaTraderプラットフォームのためのアプリのストアであるMetaTraderアプリストアで自動売買ロボットを購入する方法をご覧ください。
MQL5.community支払いシステムでは、PayPalや銀行カードおよび人気の支払いシステムを通してトランザクションをすることができます。ご満足いただけるように購入前に自動売買ロボットをテストすることを強くお勧めします。
取引の機会を逃しています。
- 無料取引アプリ
- 8千を超えるシグナルをコピー
- 金融ニュースで金融マーケットを探索
新規登録
ログイン