MetaTrader 5용 무료 Expert Advisor 및 지표 - 11

Thermo MAP is a multicurrency and multitimeframe indicator that display a smart heat map based on proprietary calculations. Watch how Forex market moved and is currently moving with a single dashboard and have a consistent and good idea of what is happening!
It can be suitable for both scalping or medium/long term, just select options that better fit your trading style Symbols list are automatically sorted based on the preferred column. There is the possibility to click on: First row, timefram
FREE

이 도구는 지정되거나 자동으로 계산된 시차가 있는 원본 시간 척도를 차트 하단에 추가합니다.
이 편리한 도구를 사용하면 차트의 가독성을 높이고 자신이나 국가에 익숙한 시간 형식으로 차트를 표시하여 정신적 스트레스를 줄일 수 있습니다.
시차를 계산할 필요가 없더라도 기본 시간 척도를 Local_Time으로 바꾸면 차트의 가독성을 높일 수 있습니다.
Local_Time은 "DD.MM hh:mm", "DD MMM hh:mm", "MM-DD hh:mm", "MM/DD hh:mm", "DD hh:mm", " hh:mm"을 사용하며 다른 국가의 사람들이 사용할 수 있도록 설계되었습니다.
유연한 매개변수 설정을 사용하면 기본 시간 척도 삭제, 시차 자동 또는 수동 계산, 일광 절약 시간 조정, 척도 간 간격 조정 등 필요에 맞게 Local_Time을 사용자 정의할 수 있습니다.
Local_Time 아래에 서브 윈도우가 생성되면 빨간색 바가 나타나며, 이를 클릭하면 하단
FREE
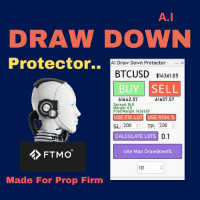
Ai Drawdown Protector는 하락을 모니터링하기 위한 외환 시장의 최신 기술입니다. 소품 회사와 FX 거래자가 자산과 잔액을 추적하는 데 일반적으로 사용됩니다. 가장 좋은 부분? 그것은 무료입니다. 기간 한정 제공: AI Drawdown Protector는 제한된 기간 동안만 무료로 제공됩니다. Ai Drawdown Protector에는 초당 10회 감소를 계산하는 타이머 기능이 있습니다. 하락폭이 한도에 도달했음을 감지하면 경고를 생성하고 해당 날짜의 모든 미결제 및 보류 거래를 종료합니다. 특히, 자본을 기준으로 손실을 추적하기 때문에 다른 EA의 거래를 정산할 수 있습니다.
특징:
작업하기 좋은 아름다운 그래픽 패널 무료 최고의 드로다운 모니터 시스템 모든 쌍의 자산을 기준으로 랏을 계산합니다. 연중무휴 24시간 근무 가능 쉬운 설정 고정 로트 또는 위험 비율로 패널에서 구매 및 판매 입찰, 요청, 스프레드, 마진 및 여유 마진과 같은 중요한
FREE

Investment Castle Indicator has the following features: 1. Dictates the direction of the trend in different Timeframes . 2. Shows the hit rate and winning rate on the chart. 3. This indicator does not repaint the chart. 4. This indicator is built-in the Support & Resistance based Investment Castle EA which works with Psychological Key Levels "Support & Resistance" Indicator.
FREE

HUGE ANNOUNCEMENT!!! With the purchase of Tropic Funder EA, you can obtain my Boxer Pro trading indicator FREE! Message me after purchase and I will send you a restriction-free copy of Boxer Pro indicator, as well as give you the ability to obtain the all-new, unannounced Boxer Ultimate EA absolutely FREE as well! That's two amazing new highly anticipated systems unreleased to the public until now, ABSOLUTELY FREE!!! Introducing Tropic Funder EA for GBPUSD H1 A groundbreaking trading system val
FREE

This indicator draws the Donchian Channel, filling the background with colors. The color of the middle line is changed following the current trend, based on the standard interpretation of the Donchian Channel.
Input Parameters: Period of the Channel (default is 20) Validate Signals (boolean value to filter out false breakouts, default is false) Background Settings
Show Background (default is true) U ptrend Color (default is DodgerBlue ) Downtrend Color (default is Orchid) Background Tr
FREE

Introduction to Fractal Moving Average Fractal Moving Average indicator was designed as part of Fractal Pattern Scanner. Inside Fractal Pattern Scanner, Fractal Moving Average Indicator was implemented as multiple of chart objects. With over thousands of chart object, we find that it was not the best and efficient ways to operate the indicator. It was computationally too heavy for the indicator. Hence, we decide to implement the indicator version of Fractal Moving Average indicator to benefit ou
FREE
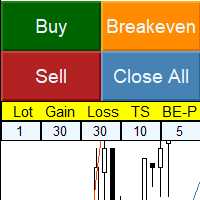
Simple panel with Stop loss (Loss), Stop gain (Gain) , Trailing stop (TS) and Breakeven (BE-P).
Lot is the number of contracts to be traded.
Gain is the number, in points, that the stop gain will be positioned. If you don't want to put stop gain, just put 0 (zero) in place and when you open the order it won't have this stop.
Loss is the number, in points, that the stop loss will be placed. If you don't want to put stop loss, just put 0 (zero) in place and when you open the order it won't
FREE
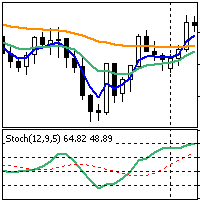
This is a simple trend strategy for Forex. Recommended timeframe is H1, the default settings are for the GBPUSD currency pairs (for other timeframes and currency pairs, it is necessary to select other indicator settings). The following indicators are used in the strategy: Exponential Moving Average: EMA (4) — blue Exponential Moving Average: EMA (13) — green Exponential Moving Average: EMA (50) — orange. Stochastic Oscillator (12,9,5), levels — 20, 40, 60, 80. A buy trade is opened at the openin
FREE
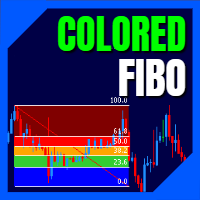
LT Colored Fibo is a simple indicator that paints the price zones between Fibonacci Retracement levels. Its configuration is extremely simple. It is possible to change the colors of each level of the retracement, choose between background or front of the chart and also work only with the current asset or all open. If you found a bug or have any suggestion for improvement, please contact me. Enjoy!
This is a free indicator, but it took hours to develop. If you want to pay me a coffee, I appreci
FREE

The Alert Arrows RVI indicator is an advanced version of the Relative Vigor Index (RVI) indicator, enhanced with alert arrows functionality. It has the ability to identify potential support and resistance levels, providing traders with valuable insights into market dynamics. Key Features: Alert Arrows: Alert arrows have been integrated into the RVI indicator, offering visual cues for potential trading opportunities. Additional Filters: Two additional filters have been incorporated to enhance ind
FREE
(This is the free version of our trade manager, download it for free and test it, and provide feedback. If you are satisfied with its capabilities, you can try out its bigger brother the Deriv Scalp Manager also available from us.)
EA Summary If you are a scalping trader who wants to place and close trades quickly and efficiently, you need a powerful tool that can help you achieve your goals. That's why we created the Deriv Trade Assistant EA, a smart and easy-to-use expert advisor that a
FREE

VR Assistant Charts — 이는 MetaTrader 거래 터미널 창에서 그래픽 개체로 작업하는 거래자를 위한 편리한 도구입니다. 이 프로그램을 사용하면 한 번의 마우스 클릭으로 MetaTrader 터미널에서 추세선, 피보나치 수준, Gann 팬 및 기타 그래픽 요소의 색상, 스타일, 두께 및 기타 특성을 변경할 수 있습니다. 설정, 세트 파일, 데모 버전, 지침, 문제 해결 등은 다음에서 얻을 수 있습니다. [블로그]
다음에서 리뷰를 읽거나 작성할 수 있습니다. [링크]
버전 [MetaTrader 4] 이 유틸리티는 그래픽 개체를 사용하여 금융 상품을 분석할 때 거래자의 단조로운 작업을 크게 촉진합니다. 모든 작업은 차트에서 직접 컴퓨터 마우스를 사용하여 수행됩니다. 이 프로그램은 MetaTrader 4 및 MetaTrader 5 거래 플랫폼에 대한 기술 지표 형태로 구현되므로 다른 지표, 조언자 및 스크립트와 동시에 사용할 수 있습니다. 제어는 컴퓨터 마우스를
FREE

hello,
king binary sureshot mt5 binary indicator,
1 minute candle
1 minute expire
Join Our Telegram
https://t.me/KINGBINARYOFFICIAL
Alright. This indicator works on MT5 and is very easy to use. When you receive a signal from it, you wait for that candle with the signal to close and you enter your trade at the beginning of the next new candle. A red arrow means sell and a green arrow means buy. All arrows comes with a long dotted like for easy identification of trade signal. Are you oka
FREE

This Advanced Pivots Point is a MT5 Indicator and the essence of this technical indicator is to transform the accumulated history data. Pivot Point Indicator provides for an opportunity to detect various peculiarities and patterns in price dynamics which are invisible to the naked eye. Pivot Points Fibonacci retracements Previous day’s open, high, low, and close.
FREE

One of the good and important features in MT4 is the availability of the iExposure indicator. With the iExposure indicator, traders can see a comparison of ongoing open positions and how much funds have been used, and more importantly what is the average value of these open positions.
Unfortunately this indicator is not available on MT5.
This indicator is iExposure MT4 which I rewrote using the MT5 programming language. This indicator can be used like iExposure on MT4 with the same function
FREE

Volatility Doctor Desert Eagle을 소개합니다: 폭발적인 거래 성공을 위한 궁극의 스캘핑 알고리즘!
거래 게임을 혁신하려면 준비가 되었나요? Volatility Doctor Desert Eagle을 찾아보지 마십시오. 이 알고리즘은 정밀도, 통제 및 수익성으로 트레이더를 강화하기 위해 설계된 궁극의 스캘핑 알고리즘입니다. 다음은 Volatility Doctor Desert Eagle이 다른 모든 것보다 뛰어나게 만드는 이유입니다.
1) 간단하고 직관적입니다: 복잡한 용어나 가파른 학습 곡선이 없습니다. 당사 알고리즘은 간단하고 이해하기 쉬운 매개 변수를 자랑하며 모든 경험 수준의 트레이더가 그 힘을 활용할 수 있도록합니다.
2) 데이터 기반 결정: 시장 변동성의 강력한 측정치의 힘을 활용하여 거래 결정을 수립하십시오. 추측을 작별하고 데이터 기반 전략에 인사를 올리십시오.
3) 완벽한 통제: 각 개별 설정에 대한 완전한 통제를 가지세요. 알고리즘
FREE
This EA trades untested fractals using pending orders. It offers many trading behaviors and flexible position management settings, plus many useful features like customizable trading sessions and a martingale mode. [ Installation Guide | Update Guide | Troubleshooting | FAQ | All Products ] Easy to use and supervise It implements 4 different trading behaviors Customizable break-even, SL, TP and trailing-stop Works for ECN/Non-ECN brokers Works for 2-3-4-5 digit symbols Trading can be NFA/FIFO C
FREE

This indicator shows current major support and resistance, if one exists. And as a support or resistance is broken it shows the new current, if any. To identify support and resistance points it uses the high and low points identified on the current chart. Allows too you to inform the maximum number of bars used to consider a support or resistance point still valid.
FREE

StopLevel 미터는 STOPLEVEL 레벨을 제어합니다. 레벨이 변경되면 경고로 신호를 보냅니다. STOPLEVEL - 스탑 주문을 하기 위한 현재 종가에서 포인트 단위의 최소 오프셋, 또는 포인트 단위로 허용되는 최소 손절매/이익 실현 수준. STOPLEVEL 값이 0이라는 것은 손절/이익 실현을 위한 최소 거리에 대한 제한이 없거나 거래 서버가 터미널로 전송할 수 없는 동적 수준 제어를 위해 외부 메커니즘을 사용한다는 사실을 의미합니다. 두 번째 경우에 STOPLEVEL은 실제로 "부동" 상태입니다. 표시기 설정: color_ - 레벨의 구역 색상 draw_bars - 레벨 영역을 표시하기 위한 막대의 수 width_price - 가격 라벨의 두께 미터는 STOPLEVEL 레벨을 제어합니다. 레벨이 변경되면 경고로 신호를 보냅니다. STOPLEVEL - 스탑 주문을 하기 위한 현재 종가에서 포인트 단위의 최소 오프셋, 또는 포인트 단위로 허용되는 최소 손절매/
FREE
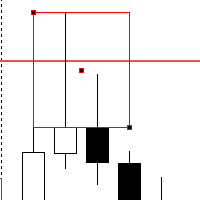
Introducing our Rejection Block Scanner – a powerful and intuitive tool designed to revolutionize your trading by effortlessly identifying key rejection zones across various timeframes. This cutting-edge scanner is crafted to cater to both beginner and experienced traders, offering unparalleled insights into potential market turning points.
**Key Features:**
1. **Multi-Timeframe Analysis:** Uncover opportunities on a grand scale! Our Rejection Block Scanner meticulously scans multiple timef
FREE

속도를 위해 약간 변경되었습니다. 테스터는 이메일로 나에게 쓰기,관심이 새로운 고문이 필요합니다 777basil@mail.ru
표시기는 역사의 가격 변화를 기반으로 계산되며 수학적으로 계산되며 데이터가 다시 수신 될 때마다 다시 계산됩니다. 그것은 다른 시간대에 사용할 수 있습니다. 70%의 지표의 경계에서 가격 이동 또는 통합 방향의 변화가 있습니다. 이 방법으로,당신은 추세와 국경에서 채널의 중간에 보트를 거래 할 수 있습니다. 저항/지원 수준을 결정하기 위해 추세 거래에서 사용하는 것이 좋습니다. 비디오에서 표시기가 어떻게 작동하는지 확인할 수 있습니다:
https://youtu.be/UG2ZZEH9B_U
통신 연락처 777basil@mail.ru 우리는 당신의 작업에 대한 지표 인 전문가를 준비 할 것입니다.
FREE

The indicator analyzes the chart and identifies Doji candlesticks. Shows their appearance and signals the appearance of such a candle (if allowed in the parameters). Also, this indicator shows the strength of the reversal in the form of bars of different colors (the more green, the more likely the rise, the more red - the fall in price). The direction of the signal depends on the direction of the previous candles, as the Doji signals a reversal or correction. In the indicator settings, you can
FREE

이 지표를 사용하면 일중 범위의 지역 추세의 강도에 상대적인 가격 변화의 역 동성을 추적 할 수 있습니다 추천 기간:M5-H1 가격 채널 프로 표시기는 다시 그리지 않고 레벨을 변경하지 않습니다 표시기를 사용하여 거래하는 것은 매우 간단합니다
판매 거래를 여는 방법:
1. 새로운 현지 가격 최대를 기다립니다 2. 가격은 채널의 중간(녹색 선)으로 롤백해야합니다 3. 새 촛불에 판매 표시를여십시오 4. 정지 손실을 채널의 상한(파란색 선)이상으로 설정하십시오 5. 가격이 역전되고 로컬 최소값이 업데이트되면 수익성 영역에서 주문을 닫습니다
구매 거래를 여는 방법:
1. 새로운 지역 최소 가격을 기다리십시오 2. 가격은 채널의 중간(녹색 선)으로 롤백해야합니다 3. 새로운 촛불에 구매 트랙을 엽니 다 4. 채널의 하단 테두리(빨간색 선)아래 정지 손실을 설정합니다 5. 가격이 역전되고 로컬 최대 값이 업데이트되면 수익성 영역에서 주문을 닫습니다
가격 채널
FREE

Introducing the Accelerator Divergence Indicator, a powerful tool designed to enhance your Forex trading experience. This innovative indicator is specifically crafted to identify market divergence, providing traders with valuable insights for more informed decision-making. The Accelerator Divergence Indicator utilizes advanced algorithms to detect divergence in the market, visually guiding traders with precision-drawn lines that highlight key points of interest. Divergence occurs when the price
FREE
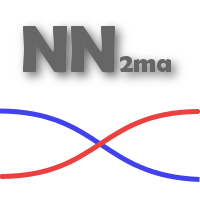
A neural network Expert Advisor based on two moving averages with the training mode. Train the Expert Advisor on selected examples and make a profit in real life. The EA can work on any instrument and in any timeframe.
Trading Algorithm of the EA Two moving averages are analyzed by the neural network core, which produces commands to buy or sell. the values of two moving averages, fast (FMA) and slow (SMA), are provided to the first layer, at the second layer it calculates two neurons responsib
FREE

스타일이 중요하기 때문에 촛불의 색상, 배경을 밝거나 어둡게 변경하고 격자를 넣거나 제거하기 위해 매번 속성을 클릭하는 것이 얼마나 성가신 일인지 압니다. 클릭 한 번으로 해결하는 방법은 다음과 같습니다. 차트에서 그리드를 표시하거나 숨기는 버튼 1개. 트레이더가 원하는 캔들 스타일을 선택할 수 있는 3개의 맞춤형 버튼. 주간 모드와 야간 모드 사이를 전환하는 버튼 1개. *****설정에서 화면에서 버튼을 표시할 위치를 선택할 수 있습니다.*** 내 다른 제품을 확인하는 것을 고려하십시오 https://www.mql5.com/en/users/javimorales.fer/seller 스토캐스틱 RSI란 무엇입니까? 스토캐스틱 RSI(StochRSI)는 0과 1(또는 일부 차트 플랫폼의 경우 0과 100) 범위의 기술적 분석에 사용되는 지표이며 스토캐스틱 오실레이터 공식을 상대 강도 지수(RSI) 값 세트에 적용하여 생성됩니다. 표준 가격 데이터보다 작가 트레이딩 알고리즘의 창시자 하비
FREE

Introduction To Time Box Indicator Time Box Indicator is a must have indicator for any trader. It will display daily, weekly and Monthly box according to your preferences. Yet, you can extend any important price levels in your chart automatically. You can use them as the significant support and resistance levels. It is very simple but effective tool for your trading.
Graphic Setting Use White Chart Line Style for Current Open price
Daily Setting Update Timeframe for daily box Number of days
FREE

Cluster Luck FX for GBPJPY H1 Chart EXPERIENCE CLUSTER LUCK AND ITS PERFORMANCE ABSOLUTELY FREE!!! Embark on a trading journey with Cluster Luck FX, a cutting-edge Expert Advisor specifically calibrated for the GBPJPY H1 timeframe. Boasting a repository of 100 dynamic strategies, this EA is a powerhouse for rapid-fire trades that demand precision and speed. Optimized for Contemporary Market Pulse: Cluster Luck FX represents the zenith of optimization, finely-tuned for the market’s pulse over the
FREE

Draw and Sync Objects Multiple Charts 1. Draw objects by key press. ( You must: 1. Press Function key => 2. Click where you want to draw => 3. Draw it => 4. Press ESC to complete). (If you don't want to draw after pressing function key, you must press ESC to cancel). 2. Developing : Sync selected objects to multiple charts by button. 3. Developing: Hide objects that do not belong to the current symbol (Objects drawn with this indicator will belong to the symbol they are plotted on. When your c
FREE

ST Ultimate Rectangle
Introducing our latest MT5 indicator: the upgraded Rectangle Object Indicator. This powerful tool boasts an enhanced rectangular object, allowing for simultaneous color fill and outlining. Plus, it offers the flexibility to display prices conveniently at both the top and bottom of the rectangle. Streamline your trading analysis with this versatile indicator, designed to provide clarity and precision in every trade.
We value your input in further refining our indicator
FREE

RENKO Reversal by StockGamblers Actually working RENKO in MT5. Uses "custom symbols" for drawing. You can apply any indicators with complete peace of mind. The movement of the last price is displayed in real during the formation of the "brick". Put the script in the MQL5/Experts folder. More precisely: C:\Users\user\AppData\Roaming\MetaQuotes\Terminal\terminal_number\MQL5\Experts Settings: ValuePerBar - height of the "brick" in points revCandle - multiplier for the height of the turning "brick".
FREE

This indicator calculates the volume profile and places labels that correspond to the VAH, VAL and POC levels, for each candle individually.
Indicator operation features The indicator works on the timeframes from M3 to MN, but it uses the history data of smaller periods: M1 - for periods from M3 to H1, M5 - for periods from H2 to H12, M30 - for the D1 period, H4 - for the W1 period, D1 - for the MN period. The color and location of the VAL, VAH and POC labels on the current candle are consider
FREE

The Monthly Weekly Open Line is an indicator that plots: The current month open line that will extend till the last week on the month. Weekly lines that span the look back days period that you have set . Each line will extend from the respective weekly Monday zero GMT till friday of the respective week. Monthly and Weekly open lines can be used to build very powerfull anc consistent trading strategies. They act as natural S/R price barriers.
FREE

The Hybrid Stochastic indicator is a Stochastic RSI described by the famous Tushar Chande and Stanley Kroll in their book called " The New Technical Trader" . The main goal of this indicator is to generate more Overbought and Oversold signals than the traditional Relative Strength indicator (RSI). Combining these 2 indicators expands the range of the overbought and oversold territory. The idea behind it is to use the Stochastic formula over RSI values. If you want to know more about its internal
FREE

이 지표는 My Candle Complete의 데모 버전으로, 여기에서 다운로드할 수 있습니다: Candle Patterns Creator 전체 버전을 사용하면 자신만의 캔들 규칙을 생성하고 전통적인 캔들 패턴을 전략에 맞게 수정하여 더 정확하게 조정할 수 있습니다. 이 지표에는 여러 가지 캔들 규칙 예제가 포함되어 있지만, 여기에서는 일부만을 소개합니다: Pattern Rule Candle Green C > O Candle Red C < O Doji C = O Hammer (C > O and (C-O) *2 < O-L and (C-O) *0.5 > H-C) or (C < O and (O-C) *2 < C-L and (O-C) *0.5 > H-O) Hammer Green C > O and (C-O) *2 < O-L and (C-O) *0.5 > H-C Hammer Red C < O and (O-C) *2 < C-L and (O-C) *0.5 > H-O Marubozu (C > O
FREE

The DJ_M5_810504785_L_OD_CF_1522_SQX is an algorithmic trading strategy for MetaTrader, tested on DJ using the M5 timeframe from December 7, 2017, to June 2, 2023. There is no need to set up parameters, all settings are already optimized and fine-tuned.
Recommended broker RoboForex because of EET timezone.
You can find the strategy source code for StrategyQuant at the link: http://webdev.quantmonitor.net/listing/dow-jones-bollinger-master/
Key details are:
MagicNumber: 810504785 Mai
FREE

Cybertrade Agile and Flexible - MT5 (Your strategy in any market) Flexible EA regarding parameterization, where the trader can configure his own setup, risk management and trading plan. Our EA is an advanced, high quality solution, always developed with attention focused on performance and flexibility of use and also always attentive to the need of traders to work in different ways. With the diversity of indicators and parameters available, it is possible to develop an infinity of setups. Any i
FREE

This indicator calculates gann support and resistance prices with use gann pyramid formulation and draw them on the chart. And If you want, Indicator can alert you when the current price arrive these pivot levels. Alert Options: Send Mobil Message, Send E-mail, Show Message and Sound Alert Levels: S1, S2, S3, S4, S5, R1, R2, R3, R4, R5 Inputs: GannInputPrice: Input price for gann pyramid formulation. GannInputDigit: How many digit do you want to use for calculation formula. (The number and the
FREE
이는 외환쌍, 주식 지수, 단일 주식, 채권 및 여러 상품을 포함한 대부분의 시장에서 거래될 수 있는 높은 승률 평균 회귀 전략입니다. 이 전문가 자문은 BS가 아닌 강력하고 효과적인 거래 원칙 및 통계 규칙을 기반으로 구축되었습니다. 귀하의 목표 시장에 대한 전문가 자문을 다시 테스트하고 최적화하십시오. 더 나은 다각화된 포트폴리오와 신뢰할 수 있는 성과 및 수익을 달성하려면 상관관계가 없는 여러 시장에서 EA를 실행하세요. 거래 시장의 최적화 및 백테스트 결과를 바탕으로 가장 가능성 있는 결과에 대한 예측 시뮬레이션 테스트를 수행합니다. 원하는 드로우다운 및 성과와 일치하도록 거래당 위험을 설정하고 실시간 전략에 따라 거래 로트 크기를 설정하십시오. 귀하가 위험을 보정하기 위해 이 부분을 관리하고 상관관계가 없는 작은 상품 바구니에서 전략을 거래할 경우 통계적 기회는 모두 귀하에게 유리하게 됩니다. 제품이 마음에 들면 리뷰를 작성하세요.
이는 재정적 조언이 아니며 교육 및
FREE

This indicator allows you to measure retracements of price between any two points in either direction. It displays the price points, percentages and also displays the extension levels.
User may Modify and Add addition levels and extensions." User may also Add multiple Fibonacci indicators on the chart and change their colors, style and sizes.
Can be used on any timeframe.
This is the only Fibonacci Tool you'll need to measure and trade on Structure.
MT4 Version Available as well.
ADDI
FREE

Genaral: Not martingale, not a grid; Use on EURUSD Use on M5
Signals: There is a good rational algorithm. Work of two indicators: Chaikin and DeMarker (from 2 timeframes) (you can set a separate Timeframe for each indicator)
Stop Loss/Take Profit: There is a good money management system (there are several type for trailing stop loss); There is virtual levels of Stop Loss / Take Profit; There is smart lot (percent by risk) or fix lot
Important: EA can work on closed candles, and on c
FREE

이 전문가 조언은 Rule Plotter 지표 내에서 만든 전략을 테스트하고 실행하기 위해 디자인되었습니다. 사용 방법: Rule Plotter - 프로그래밍 지식 없이 전략을 생성하는 도구 무료로 다운로드하십시오. 그런 다음 Rule Plotter 지표에서 전략을 개발하십시오. 마지막으로,이 전문가 조언을 사용하여 생성한 전략을 실행하십시오. 매개변수: Strategy : Rule Plotter 지표 내에서 생성한 거래 시스템입니다. Lot: 거래량; 0으로 설정하면 전문가 조언이 최소한의 거래량으로 거래합니다. Take: 틱 단위 수익 실현; 0으로 설정하면 거래에 이익실현이 없습니다. Stop: 틱 단위 손절; 0으로 설정하면 거래에 손절이 없습니다. Magic ID: 이 매개변수를 사용하면 동일한 자산에서 이 전문가 조언의 여러 버전을 실행할 수 있으며 Magic ID 번호만 변경하면 됩니다. 새로운 프로젝트를 게시할 때 알려드리기 위해 MQL5.com 에서 나를 친구로 추가
FREE

((M1 Eurusd 10 years set ))에 대한 주석 #1을 참조하십시오. ((M1 Eurusd 10 years set ))e daehan juseog #1eul chamjohasibsio. 1- EA가 작동하는 동안 차트에 다른 지표를 추가할 수 없습니다. 2- 그러한 차트에서 EA를 중지하려면 차트에서 제거하십시오. Ctrl-E를 누르면 모든 EA가 중지되고 다른 차트에서 일부 기회를 놓치고 후행 중지가 자동으로 중지되기 때문입니다. 3- 각 차트는 하나의 EA와 함께 작동하고 다른 매직 넘버를 추가할 것입니다. 예: (chart#1)1231242 (chart#2)1231352 4- 컴퓨터와 인터넷이 메모를 처리할 수 있는 경우 동시에 100개 이상의 차트를 열 수 있습니다(Ea는 지표에 직접 기반하기 때문에 지표가 있는 동안 복잡한 알고리즘이 필요하지 않기 때문에 매우 부드럽습니다) 5- 각 차트에는 프레임과 EA(다른 매직 넘버 사용)가 있습니다. 다른 프레임에서
FREE

Outside day trading strategy looks for a specific pattern in the price chart of a security.
The pattern is characterized by a larger range than the previous day, with the high of the day higher than the previous day's high and the low of the day lower than the previous day's low.
Works with many symbols, such as BTCUSD, GBPUSD,USDCAD, oil, gas, and others. PLEASE RATE! Thank you very much!
FEATURES:
- Real Strategy - Daily Bar Strategy - Exit the trade if the day was profitable - ATR multip
FREE
PREDICTOR MASTER:
Introducing the Product: Predictor Master Expert Advisor
The Predictor Master Expert Advisor is an advanced automated trading system designed to operate in the financial markets with efficiency and precision. This powerful EA utilizes a combination of custom indicators and intelligent strategies to seek profitable trading opportunities.
Custom Indicator "Predictor": The heart of Predictor Master is its innovative custom indicator called "Predictor." This indicator is pow
FREE

설명 :
우리는 외환 시장(PSAR)에서 전문적이고 인기 있는 지표 중 하나를 기반으로 하는 새로운 무료 지표를 도입하게 된 것을 기쁘게 생각합니다. 이 지표는 원래 포물선 SAR 지표에 대한 새로운 수정이며, 프로 SAR 지표에서 점과 가격 차트 사이의 교차를 볼 수 있습니다. 교차는 신호가 아니지만 이동 가능성의 끝을 말하는 것입니다. 새로운 파란색 점으로 매수를 시작하고 첫 번째 파란색 점 앞에 손절매를 1 attr 배치하고 마지막으로 점이 가격 차트를 교차하는 즉시 종료할 수 있습니다.
매수 또는 매도 신호를 여는 방법은 무엇입니까? 첫 번째 파란색 점으로 공개 매수 거래 및 첫 번째 빨간색 점으로 공개 매도 거래
정확한 손절매는 어디에 있습니까? 안전한 정지 손실은 첫 번째 점에 있을 수 있습니다(구매의 경우 첫 번째 파란색 점, 매도의 경우 첫 번째 빨간색 점)
올바른 이익실현은 어디에 있습니까? 이익실현은 손절매 거리와 RR에 따라 조정할 수 있으므
FREE

Imagine VWAP, MVWAP and MIDAS in one place... Well, you found it! Now you can track the movement of Big Players in various ways, as they in general pursue the benchmarks related to this measuring, gauging if they had good execution or poor execution on their orders. Traders and analysts use the VWAP to eliminate the noise that occurs throughout the day, so they can measure what prices buyers and sellers are really trading. VWAP gives traders insight into how a stock trades for that day and deter
FREE

Airiam-eul mannaboseyo. geunyeoneun mating-geil-ina geulideu siseutem-eul sayonghaji anhseubnida. teseuteuneun EURUSD H1eseo suhaengdoeeossjiman daleun tonghwa ssangdo jagdonghal su issseubnida. naneun i bos-eul mandeuneun de sugaewol-eul jam mos ilumyeo bonaessgo jeogjeolhan teseuteuleul geochin hueya gong-yuhal junbiga doeeossdago neukkyeossseubnida. wanlyodoen teseuteuui seukeulinsyas-i pohamdoeeo issseubnida. gibon seoljeong-eun naega sayonghaneun geos-ibnida. Forex geolaeeneun nop-eun wiheo
FREE

John Bollinger created this indicator in 2010 as a way to read the original indicator (Bollinger Bands) in a more "technical" way, shown as an oscillator. The typical range of the Bollinger Bands %B is 0 - 0.5 - 1.0, where "0" represents the lower band, the "0.5" the middle band, and "1" the upper band. The line on the indicator represents the Closing prices. As simple as that.
SETTINGS
Bollinger Bands period of analysis Standard Deviation multiplier Shift Price type to be analyzed
If you
FREE

Fundamentação teórica A VWAP é uma média móvel ajustada pelo volume, ou seja o peso de cada preço corresponde ao volume de ações negociadas no período, dando mais importância ao período em que se tenha mais negociações. [1] VWAP = sum(price[i]*volume[i]) / sum(volume[i]) Metodologia É possível configurar o período que será utilizado para o calculo da VWAP, a cor, a espessura e o estilo da linha. A linha é desenhada desde a o começo da série disponível apenas uma vez para economizar recursos com
FREE

This indicator show Gann Swing Chart (One Bar) with multi layer wave. 1. Wave layer F1: Gann waves are drawn based on candles. SGann wave(Swing of Gann) is drawn based on Gann wave of wave layer F1. 2. Wave layer F2: Is a Gann wave drawn based on the SGann wave of wave layer F1. SGann waves are drawn based on Gann waves of wave layer F2. 3. Wave layer F3: Is a Gann wave drawn based on the SGann wave of wave layer F2. SGann waves are drawn based on Gann waves of wave layer F3. ---------Vi
FREE

For MT4 version please click here . Introduction Most traders use candle patterns as a confirmation tool before entering a trade. As you know there are lots of candle patterns out there. However I realized most of them can be generalized in simple rules. So I developed my own candle pattern(Although I cannot say for sure this is mine). pattern description The pattern consists of three consecutive candles. This is true for most of the patterns out there (considering there is a confirmation neces
FREE

Minimalist style BB indicator fully filled with a single color. Indicator type: Technical Indicator You are too confused with the complicated zigzag lines in the BB indicator, especially when your strategy has many indicators combined, it looks like a mess and we will no longer see any candlesticks on the chart for technical analysis s. This indicator was born to solve that. See more: New tradingview indicator: Order Block TV | Minimalist Price Action Strategy | Subscribe It is designed
FREE

Highly configurable Macd indicator.
Features: Highly customizable alert functions (at levels, crosses, direction changes via email, push, sound, popup) Multi timeframe ability Color customization (at levels, crosses, direction changes) Linear interpolation and histogram mode options Works on strategy tester in multi timeframe mode (at weekend without ticks also) Adjustable Levels Parameters:
Macd Timeframe: You can set the lower/higher timeframes for Macd. Macd Bar Shift: you can set the
FREE

This EA uses the 20-period simple moving average (SMA).
Buy position when the price above the SMA and Sell vice-versa.
Extra indicators use to confirm the entry open.
The EA will use trailing stop loss to take the maximum profit.
Step positions will executed when the last floating position is met.
This EA tested on XAUUSD pair and may works on other pairs.
Good Luck!
FREE

There is a science, named Quantitative Finance, that allows to study the financial derivative pricing models using the methods of theoretical and mathematical physics.
Lately I came across a paper that describes a new indicator for technical analysis that combines ideas from quantum physics and brings them to finance. I got interested in it and decided I would teach how to implement indicators based on a scientific papers in MQL5.
The original Moving Mini-Max paper [2] is written by Z.K. Sila
FREE

This Mt5 Indicator Signals when there is two opposite direction bars engulfed by current bar. has a recent Exponential Moving Average Cross and past bar was oversold/bought Expert Advisor Available in Comments Free Version Here : https://www.mql5.com/en/market/product/110114?source=Site  ; Full Alerts for mt5 terminal , phone , email, print to file, print to journal Buy Signal ( blue line ) Past ema cross ( set at 30 bars back ) Past bar rsi is oversold ( level 40 ) Engulfing bar closes
FREE

VR 그리드 표시기는 사용자 정의 설정으로 그래픽 그리드를 생성하도록 설계 되었습니다. 표준 그리드 와 달리 VR 그리드는 원형 레벨 을 구축하는 데 사용됩니다. 사용자의 선택에 따라 라운드 수준 사이의 단계는 임의적일 수 있습니다. 또한 VR Grid는 다른 인디케이터나 유틸리티와는 달리 기간이 바뀌거나 단말기를 재부팅해도 그리드의 위치 를 유지합니다. 설정, 세트 파일, 데모 버전, 지침, 문제 해결 등은 다음에서 얻을 수 있습니다. [블로그]
다음에서 리뷰를 읽거나 작성할 수 있습니다. [링크]
버전 [MetaTrader 4] 수직 수준 은 실제 시간 간격을 기준으로 하며 누락 또는 존재하지 않는 기간은 무시 합니다. 따라서 레벨 사이의 단계는 사용자가 선택한 값과 엄격하게 일치합니다. VR 그리드 표시기를 사용할 때 트레이더는 모든 수준에서 스타일 , 수직선 및 수평선의 색상 및 두께를 변경할 수 있습니다. 이를 통해 금융 상품의 라운드 수준 을 제어할 수 있습니다.
FREE

This is the Chandelier Exit trend indicator applied to heiken ashi candles based on "G TREND GUNBOT" by "LUIS_GANDATA_G_TREND" on tradingview. Heiken ashi candles filter out many of the chops and therefore as an input to Chandelier Exit you achieve well filtered Buy and Sell signals. Also you can choose to apply the trend indicator to normal candles via input tab. (two in one indicator) This is a non-repaint and light processing load indicator. You can message in private chat for further change
FREE
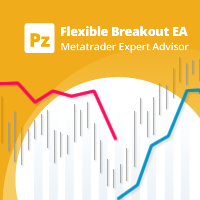
Trade donchian breakouts with complete freedom. This EA can trade any breakout period, any timeframe, with pending or market orders- as desired- and implements many other useful features for the exigent trader, like customizable trading sessions and week days, a martingale mode and inverse martingale mode. [ Installation Guide | Update Guide | Troubleshooting | FAQ | All Products ] Easy to use and supervise Customizable trading direction Customizable donchian breakout period It can trade using
FREE

This EA uses the MACD Crossover Strategy. Entries opened when the signal and MACD line cross each other. The Buy position entered only when the cross is below the zero line while the Sell position entered above the zero line. The Moving Average Convergence/Divergence (MACD) is an oscillator that combines two exponential moving averages (EMA)—the 26-period and the 12-period—to indicate the momentum of a bullish or bearish trend. MACD can be used to signal opportunities to enter and exit positions
FREE

O Indicador valida a força da tendência utilizando o volume negociado. Os candles são mostrados na cor verde indicando força compradora e cor vermelha na força vendedora. O movimento é encerrado pelo SAR parabólico. Vantagens: Filtra distorções de preço sem volume financeiro; Filtra consolidações e movimentos laterais; Filtra divergências de volume pelo indicador Money Flow. Desvantagens: Não filtra todos os falsos rompimentos, visto que rompimentos importantes geram altos volumes financeiros; N
FREE

The DR IDR Range Indicator plots ADR, ODR and RDR ranges for a given amount of days in the past. A key feature that appears is that it calculates the success rate of the ranges for the shown days. This indicator is perfect for backtest since it shows ranges for all of the calculated days, not just the most recent sessions. PRO VERSION
https://www.mql5.com/en/market/product/93360 Remember: this free version counts neutral days as true days , so stats might be slightly inflated. To get perfect
FREE

DESCRIPCION GENERAL * Bot automático * Bot de uso exclusivo de la plataforma binary.com donde se podemos encontrar los Sintéticos * Mercado de Sintéticos recomendado Range Break 200 * Deposito mínimo para el Bot 1 000 USD CONFIGURACION * No cambiar los valores de las Bandas de Bollinguer * En el parámetro TP_of_SL poner 100 * El stop loss es automático *Temporalidad de vela recomendada 1 minuto Como recomendación si quieres usarlo con menos capital se sugiere que cambies el parámetro de mu
FREE

Channels indicator does not repaint as its based on projecting the falling and raising channels. As a trader you need a path to be able to place your buy and sell trades such as: Supply and Demand , Falling & raising channels. Falling and raising channels can be in any time frame and also can be in all time frames at the same time and the price always flows within these channels. Experienced trades will draw the key levels and channels around the time frames. But, they will not be able to draw
FREE

Presentation
Another indicator that makes scalping on tick charts easier, it displays an Heiken Ashi graph in Ticks.
It allows to detect entry points and trend reversals. Recommended number of ticks in a candle : 5, 13 or 21.
Parameters Ticks in candle: Number of ticks in a candle (default 5), Displays Trend arrows : displays a trend arrow based on EMA8 and EMA20 crossing, Displays MM50, Displays MM100, Max Candle (CPU): number of candles max to manage, low value will save ressources of
FREE

Introducing Market Maven FX – The Comprehensive Trading Solution for GBP/USD H1 Unlock the potential of your Forex trading with Market Maven FX, a cutting-edge expert advisor designed specifically for the GBP/USD H1 chart. With an ensemble of 16 sophisticated strategies, Market Maven FX meticulously monitors the market dynamics, ensuring trades are executed with precision and strategic insight. Key Performance Metrics: Total Net Profit: $28,593.77, showcasing robust profitability in a challengin
FREE

Free version of the TickScalper indicator. The Tick Scalp indicator is a trading assistant for a scalping trader. Works in a separate window. Tracks the momentary activity of the market, shows the graph of the movement of ticks and the strength of bulls or bears. Sometimes it can anticipate the beginning of a strong movement before any other indicators. Helps the trader to make a decision to open the desired order. Designed to work on any instrument. Used timeframes from M1 to M15. Has simple a
FREE
MetaTrader 마켓은 과거 데이터를 이용한 테스트 및 최적화를 위해 무료 데모 거래 로봇을 다운로드할 수 있는 유일한 스토어입니다.
어플리케이션의 개요와 다른 고객의 리뷰를 읽어보시고 터미널에 바로 다운로드하신 다음 구매 전 트레이딩 로봇을 테스트해보시기 바랍니다. 오직 MetaTrader 마켓에서만 무료로 애플리케이션을 테스트할 수 있습니다.
트레이딩 기회를 놓치고 있어요:
- 무료 트레이딩 앱
- 복사용 8,000 이상의 시그널
- 금융 시장 개척을 위한 경제 뉴스
등록
로그인
계정이 없으시면, 가입하십시오
MQL5.com 웹사이트에 로그인을 하기 위해 쿠키를 허용하십시오.
브라우저에서 필요한 설정을 활성화하시지 않으면, 로그인할 수 없습니다.
