YouTubeにあるマーケットチュートリアルビデオをご覧ください
ロボットや指標を購入する
仮想ホスティングで
EAを実行
EAを実行
ロボットや指標を購入前にテストする
マーケットで収入を得る
販売のためにプロダクトをプレゼンテーションする方法
MetaTrader 5のための無料のエキスパートアドバイザーとインディケータ - 4

BREAKOUT ALGO is a game-changing trading algorithm designed to capitalize on price breakouts with unparalleled precision and efficiency. This innovative algorithm leverages the power of Fractals to identify key highs and lows in prices while utilizing the simple moving average indicator to determine trend directions with accuracy.
Breakout Algo is engineered to empower traders with the ability to seize breakout opportunities in the market, enabling them to make informed decisions and maximiz
FREE

Boom and crash Gold Miner v2 trend histogram which works in conjunction with the indicator above that has arrows as shown in the video. PLEASE Note: That the top indicator and the bottom indicator are two separate indicators. the top indicator is https://www.mql5.com/en/market/product/98066 the bottom one is free. which is the histogram at the bottom. the trend histogram trading tool that helps to easy detect the trend blue color indicates an uptrend. Orange color is a down trend.
FREE

This indicator combines TRIX (Triple Exponential Moving Average) with a Moving Average, which can be simple, exponential, smoothed or weighted.
This combination is very useful to identify the main trend and when it is changing to a new direction.
The indicator also has signals on the chart that indicates the TRIX crossing with the Moving Average, as well as pop-up alerts and push (in the MT5 app).
Enjoy it!
FREE

Trend Master Chart、必要なトレンド指標です。 チャートをオーバーレイし、色分けを使用してさまざまな市場のトレンド/動きを定義します。 2 つの移動平均と異なるオシレーターを組み合わせたアルゴリズムを使用します。 これら 3 つの要素の周期は変更可能です。 どの時間枠やペアでも機能します。
上昇トレンドまたは下降トレンド、およびこのトレンドへのさまざまなエントリーポイントを一目で識別できます。 たとえば、顕著な上昇トレンド (薄緑色) では、このトレンド内のさまざまな市場インパルスが濃い緑色のローソク足で表示されます。 設定可能なアラートを使用すると、これらの衝動を決して見逃すことがなくなります。
MT4のバージョンです。
入力パラメータ:
Period 1: 高速期間移動平均。
Period 2: 低速期間の移動平均。
Oscillator period: オシレーター周期。
Sell/Buy alert: 市場衝動アラート、トレンドエントリーポイント。 Bullish/Bearish alert: トレンドが
FREE

The trade strategy is based on three moving averages. To determine the trend, it uses three exponentially smoothed moving averages: FastEMA, MediumEMA and SlowEMA.
Trade signals:
Buy signal: FastEMA>MediumEMA>SlowEMA (upward trend). Sell signal: FastEMA<MediumEMA<SlowEMA (downward trend). Input parameters:
Inp_Signal_ThreeEMA_FastPeriod = 8; Inp_Signal_ThreeEMA_MediumPeriod = 38; Inp_Signal_ThreeEMA_SlowPeriod = 48; Inp_Signal_ThreeEMA_StopLoss = 400; Inp_Signal_ThreeEMA_TakeProfit = 900; I
FREE

Time Session OPEN-HIGH-LOW-CLOSE This Indicator Will Draw Lines Of OHLC Levels Of Time Session Defined By User. It Will Plot Floating Lines On Current Day Chart. Time Session Can Of Current Day Or Previous Day. You Can Plot Multiple Session Lines By Giving Unique ID To Each Session. It Can Even Show Historical Levels Of Time Session Selected By User On Chart To Do Backdating Test. You Can Write Text To Describe The Lines.
FREE

The indicator works to convert normal volume into levels and determine financial liquidity control points.
It is very similar in function to Fixed Volume Profile.
But it is considered more accurate and easier to use than the one found on Trading View because it calculates the full trading volumes in each candle and in all the brokers present in MetaTrade, unlike what is found in Trading View, as it only measures the broker’s displayed prices.
To follow us on social media platforms:
tel
FREE

Emulate TradingView drawing experience with magnet snap to the nearest price. A handy precision drawing tool for trading: ICT SMC (Smart Money Concept) Demand & Supply FVG (Fair Value Gap) Breakout Trend Following Reversal MTF (Multiple Timeframe) Price Action Support & Resistance Elliott Wave Supported drawing tools: Vertical Line Horizontal Line Trend Line Horizontal Ray (Angle Trend Line) Fibonacci Retracement Rectangle
Input: Threshold (px) : The distance in pixel unit to snap the
FREE

The Fibonacci Trader MQL5 expert advisor uses the Fibonacci levels to determine a buy or sell trade with the MACD as confirmation. The Fibonacci levels work as follows: Above 61.8
SELL if MACD trend is SELL Trading Range (Ability to select trading input parameters)
BUY if MACD trend is BUY SELL if MACD trend is SELL Below 23.6
BUY if MACD trend is BUY
Default settings are configured for EURUSD on M5 Chart. To work with the news server, you must add the URL ‘ http://ec.forexprostools.com/ ’
FREE

This indicator finds Three Drives patterns. The Three Drives pattern is a 6-point reversal pattern characterised by a series of higher highs or lower lows that complete at a 127% or 161.8% Fibonacci extension. It signals that the market is exhausted and a reversal can happen. [ Installation Guide | Update Guide | Troubleshooting | FAQ | All Products ] Customizable pattern sizes
Customizable colors and sizes
Customizable breakout periods Customizable 1-2-3 and 0-A-B ratios
It implements visua
FREE

COLORED TREND MA / MACD CANDLES draw MA Candles above/below Moving Average draw MACD Candles above and below 0 and Signal-Line
Your Advantage: a simple view of the trend direction a simple view over the higher trend direction a calmer chart for the eye clear rules can be defined Settings: Value Quick-Set : pre-Settings MACD 3 / 9 / 6 MACD customize MA Candles Fast EMA : 12 Slow EMA : 26 MACD SMA : 9 1. MA Period : default 14 and 20, which are my favorite for all timeframes, I believe in the 1
FREE
Candle_Timer_and_Spread インジケーターは、選択したシンボルのスプレッドとともに、ローソク足の終了までの時間と価格変化の割合を 1 つのチャートに表示します。
現在の時間枠のローソク足の終わりまでの時間と、その日の始値に対するパーセンテージでの価格変化のタイマーは、デフォルトでチャートの右上隅に表示されます。 パネルには、選択したシンボルのその日の始値に対する現在の価格のスプレッドと変化率が表示されます。パネルはデフォルトで左上隅に配置されます。
入力設定: Candle_Time_Lable_Settings - ローソク足の終わりまでの時間と現在のシンボルの価格の変化に関するタイマーのタイプの設定。 Font_Size - フォント サイズ。 X_offset - 横軸に沿ってシフトします。 Y_offset - 縦軸に沿ってシフトします。 Text_color - フォントの色。 Multi_Symbol_Settings - マルチシンボル パネルの設定。 Symbols_to_work - パネルに表示するシンボルをカンマで区切って手動で入力し
FREE

TickAll - Automated Trading Robot "Please test it in the BITCOIN 15-minute timeframe" Introduction: TickAll is an automated trading robot designed to assist both novice traders and professional traders in the Forex market. Utilizing advanced algorithms and up-to-date market analysis, TickAll helps you make the best trading decisions.
Our trading robot stands out from the rest due to its unique feature - the ability to sometimes incur losses yet ultimately generate profits. Unli
FREE
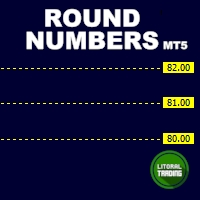
Round numbers (or key levels) is an amazing strategy. These numbers are strong support and resistance levels. So what this indicator does is draw horizontal lines on the chart to help you find these levels. Configurations: Key levels in pips - distance between the lines. Color - lines color. Style - lines style. Width - lines width. Display at background - draw lines in front or back of candles. Selectable - turn on or off the option to select the lines. Lines identification - identifica
FREE

Renko Expert Advisor based on Renko bar simulation. The EA has two options for building Renko bars. Classic and ATR. In the classic version, renko bars are marked with areas on the main chart; in the ATR version, renko bars are modeled and drawn in the indicator window. Modeling renko bars inside the EA allows you to optimize the robot better than drawing renko bars offline.
Telegramm channel Set file Our second robot RENKOTREND Does not use martingale! Trades opened by the robot co
FREE

This Indicator is based on 4 Exponential Moving Averages ie. 3 EMA-32 (applied to prices close, high & low), and EMA-200 (indicating trend direction). The EMA32-200 produces quality buy and sell entries indicated by arrows and signal alert that appears whenever the price moves above the EMA-200 and returns below the EMA-32s and returns to break above the previous swing high triggering a high probability buy entry. The Sell conditions are the opposite of the buy conditions.
FREE

The Expert Advisor for this Indicator can be found here: https://www.mql5.com/en/market/product/115445 The Break of Structure (BoS) and Change of Character indicator is a powerful tool designed to identify key turning points in price movements on financial charts. By analyzing price action, this indicator highlights instances where the market shifts from a trend to a potential reversal or consolidation phase.
Utilizing sophisticated algorithms, the indicator identifies breakouts where the str
FREE

Metatrader 5 version of the famous Andre Machado's Tabajara indicator. If you don't know Andre Machado's Technical Analysis work you don't need this indicator... For those who need it and for those several friend traders who asked this porting from other platforms, here it is...
FEATURES
8-period Moving Average 20-period Moving Average 50-period Moving Average 200-period Moving Average Colored candles according to the inflexion of the 20-period MA
SETTINGS You can change the Period of all M
FREE

ザ トレーダーのベストパートナー! 取引アシスタント: これは非常に機能が豊富な取引支援ツールです。 開発は簡単ではありません。Pro をサポートしてください。クリックしてジャンプしてください。
KトレードアシスタントプロMT5
取引アシスタントの操作手順
基本的な使用設定 基本: 言語選択スイッチをサポート (現在中国語と英語をサポート) 自動言語認識 バインディングをサポート ポジションを開閉するホットキー 、ショートカット キーを使用してポジションをすばやく開閉します... ポジションを閉じるためのショートカット キー。 ロック解除はほとんどの機能をサポートします リプレイ で使用できる操作 テスト環境 オープンポジションとクローズポジション: ワンクリックでポジションをオープン ( テイクプロフィットとストップロスの便利な設定、ロットサイズの自動計算などの便利な機能を含む) ワンクリックで閉じる (ロック)、ミニマリストスタイルのデザイン、クローズポジションのタイプ
FREE
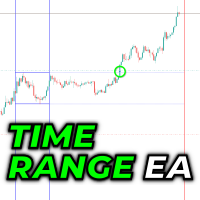
This is a simple Time Range Breakout EA with dynmaic lot size, trailing stop loss and day of week filter. The coding tutorial for the core logic is on my youtube channel.
If you have any questions or suggestions for improvement, you can write to me at any time.
Current components: Magicnumber Dynamic lot size (fix lots/fix amount/percent of account) Time range breakout entry signal
Day of week filter Trailing stop loss
FREE

Spike Catch Pro 22:03 release updates Advanced engine for searching trade entries in all Boom and Crash pairs (300,500 and 1000)
Programmed strategies improvements Mx_Spikes (to combine Mxd,Mxc and Mxe), Tx_Spikes, RegularSpikes, Litho_System, Dx_System, Md_System, MaCross, Omx_Entry(OP), Atx1_Spikes(OP), Oxc_Retracement (AT),M_PullBack(AT) we have added an arrow on strategy identification, this will help also in the visual manual backtesting of the included strategies and see h
FREE
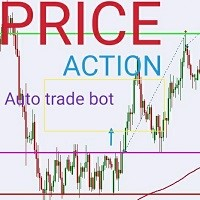
PRICE ACTION Semi-auto trade bot: (SPECIALLY DEIGNED FOR XAUUSD ) This is a simple quantitative model that trades GOLD(XAUUSD) using automatic price action analysis algorithms Place it on any symbol or timeframe. The position sizes are calculated by multiplying 0.01 per USD 500 on account to ensure low risk exposure and also leaving free margin for hedging positions that reduce the overall risk exposure . This is what leads to stability in the model though it is possible that the model like
FREE
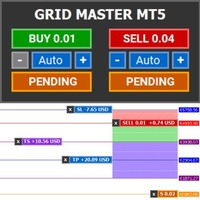
Introducing Grid Master MT5, your ultimate trading utility designed to revolutionize the management of single or multiple orders with unparalleled ease and effectiveness.
Evaluation version of Grid Master MT5 Some limitations are applied: - Maximum of 3 open positions and 1 pending order per side (Buy/Sell) - Trailing Stop feature disabled - Economic calendar and news protection disabled - Trade event push notifications disabled Features: Clean and user friendly UI: With the benefits of fellow
FREE

Raymond Cloudy Day For EA: Introducing the Raymond Cloudy Day indicator, a revolutionary trading tool created by Raymond and expertly developed for the MT5 platform. This innovative indicator integrates a cutting-edge calculation method with advanced algorithms, surpassing traditional Pivot Points to enhance trading strategies with unparalleled precision. [Source Code] : View
Key Features: Innovative Calculation Method: The core of the Raymond Cloudy Day indicator features a unique calculatio
FREE

Easy and Smart Trade Manager. Take your trading to the next level with it. This assistant has everything you need to do that. MT4 version
Basic features: Works with any FX, Crypto, Indices, Futures etc Several volume calculations methods, included risk calculation based on StopLoss level Several BreakEven modes Time close, timeout close and orders expiration Cancel pending orders level (OCO) Real and virtual StopLoss and TakeProfit One Click open and close trades Screenshots of your trades Cus
FREE
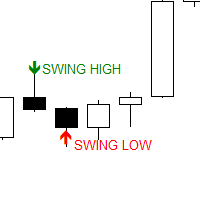
The Swing Point scanner scans for Swing High and Swing Low in real time and on the strategy Tester. It works on all time frames. Swing High is a candlestick High that has a Lower High on both side. Swing Low is a candlestick Low that has a Higher Low on both side.
Past Swing points are area where buy-side and sell-side liquidity can be found. This are areas where most traders place their buy and sell stops.
FREE

This Free Version I separate from Paid version to whom is newbies here and don't have much money to buy good EA. This EA working on AUDCAD with very small Balance and no martingale , No grid its just hedge positions opposite side to cover loss side until trailing Profits and loss together, last I am not make sure this ea work on your broker too so test demo before running on live account. My recommendation for first use : Pair : AUDCAD Time Frames : M15 Balance : 100$ or Above Use Force Trend M
FREE

This is a conventional volume indicator, which displays the ticks or real volume (if available from your broker). But it has others features like: 5 color schemes: single, when crossing with moving average, when crossing a specific level, when having different volume between bars and when candle change color. Being hable to have a customizable moving average. Being hable to have a value indicator line. Many thanks to Diego Silvestrin for the ideas to version 1.1 and Konstantin Demidov for
FREE
MeetAlgo RSI Trade EA MT5 trades using the RSI Indicator. It offers many customizable RSI trading scenarios and flexible position management settings, plus many useful features like customizable trading sessions, a martingale and inverse martingale mode. [ Installation Guide | Update Guide | Submit Your Problem | All Products ]
Functions Easy to use and customizable RSI setting. Customizable indicator settings Built-in money management Grid trading when trade in Loss Customizable break-
FREE

Dark Dione is a fully automatic Expert Advisor for Medium term Trading. This Expert Advisor needs attention, in fact presents highly customizable. Dark Dione is based on Dark Breakout MT5 indicator, these trades can be manage with some strategies. (Write a review at market to receive my best settings for free!) Optimization experience is required to Download the robot. My tests are indicative, for best results it is necessary to study the user manual and create your settings. All the s
FREE

Ichimoku Trend Alert is the Ichimoku Kinko Hyo indicator with Alerts and signal filters.
Ichimoku Trend Alert features: Optional check of Ichimoku cloud, Tenkan sen(Conversion Line), Kijun sen(Base Line), Senkou span A, Senkou span B, and Chikou span relative to price, and more. Popup, email, and phone notification alerts for selected symbols and timeframes.
There are 9 classic Ichimoku trend filters you can enable/disable in settings: Price/Cloud Order: Checks the price position relative
FREE

Introduction
The PF Maximizer is a game-changing non-repainting technical tool engineered to help traders distinguish genuine trend signals from erratic market fluctuations. By employing sophisticated algorithms and cutting-edge data analysis, this indicator efficiently filters out unwanted noise, empowering traders to identify the precise starting and ending points of substantial market moves.
Signal
Potential buy signal is generated when moving average is going up and the blue line c
FREE

El indicador utiliza múltiples marcos de tiempo para analizar las mejores entradas de compra en el auge 1000. Está diseñado para ayudar a operar únicamente en picos de auge. el indicador tiene dos flechas; los rojos y azules. la formación de la flecha roja indica que debe estar preparado para una flecha azul que es una señal de entrada de compra. el indicador no ofrece puntos de salida. siempre recopile 3 pips, es decir, si ingresó a una operación a 10230,200, puede salir a 10260,200 con SL a 1
FREE

Read more about my products
Gap Cather - is a fully automated trading algorithm based on the GAP (price gap) trading strategy. This phenomenon does not occur often, but on some currency pairs, such as AUDNZD, it happens more often than others. The strategy is based on the GAP pullback pattern.
Recommendations:
- AUDNZD
- TF M1
- leverage 1:100 or higher
- minimum deposit 10 USD
Parameters:
- MinDistancePoints - minimum height of GAP
- PercentProfit - percentage of profit relative
FREE
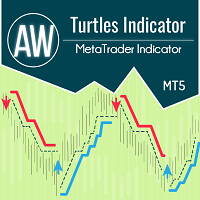
このインジケーターはタートル システムに従って機能し、古典的に 20 ローソク足と 55 ローソク足の時間間隔を想定しています。傾向は、指定された時間間隔にわたって監視されます。エントリーはサポートまたはレジスタンスレベルを下抜けた瞬間に行われます。出口シグナルは、同じ時間間隔のトレンドの反対方向への価格ブレイクアウトです。 利点:
金融商品: 通貨ペア、株式、商品、指数、暗号通貨 タイムフレーム: 古典的には D1、あらゆるタイムフレームでの作業にも適しています 取引時間: 24時間 資金管理戦略: 取引あたりのリスクは 1% 以下 追加注文を使用する場合、追加ポジションごとのリスクは 0.25% MT4バージョン -> こちら / AW Turtles EA -> こちら エントリールール: 1) 短いエントリー: エントリー条件は20日間の高値または安値をブレイクアウトすることです。
前のシグナルが成功した場合、取引はスキップされます。
注記!以前の取引が利益で終了した場合は、エントリをスキップします。ブレイクアウトが利益を生むことが突然判明した場合は、後で55
FREE

This Engulfing Candle Indicator as the name implies can detect engulfing candlestick patterns on the chart. The indicator alerts the user of the presence of an engulfing candle (Bearish engulfing candle and Bullish engulfing candle) by using visual representation of arrows on the chart. - Blue arrow for Bullish engulfing - Red arrow for Bearish engulfing Extra modifications can be added based on request.
FREE

The Penta-O is a 6-point retracement harmonacci pattern which usually precedes big market movements. Penta-O patterns can expand and repaint quite a bit. To make things easier this indicator implements a twist: it waits for a donchian breakout in the right direction before signaling the trade. The end result is an otherwise repainting indicator with a very reliable trading signal. The donchian breakout period is entered as an input. [ Installation Guide | Update Guide | Troubleshooting | FAQ | A
FREE

Just another Auto Fibonacci Retracement indicator . However, this is the most Flexible & Reliable one you can find for FREE. If you use this indicator and you like it, please leave a review/comment. If you are looking for a more advanced Fibo indicator, check this Free Trend-Based Fibo indicator . ### FEATURES ### Auto-calculate up to 7 Fibonacci levels on your customized frame. Adjust levels as your need. Use High/Low price or Open/Close price to calculate. Freeze the levels and don
FREE
Welcome! This is the RSI GridMaster Mini, the freely available compact version of the popular RSI GridMaster. This robot operates based on the RSI indicator with a grid strategy, allowing for continuous trading in response to market movements. The Mini version comes with a fixed lot size of 0.01 and trades exclusively on the hourly time frame. In this version, the number of settings has been minimized to simplify and streamline the trading process. You can find the full version by clicking here
FREE

Why Secutor and If It Can Be Used With Prop Trading Challenges? One of the dirty truths of financial markets is that reliable scalping and high frequency trading algorithms depend on highly complex mathematical functions created by the hands of the brightest minds of programmers and mathematicians. In the world of institutional trading, 50-60 year old technical analysis tools are never used for the validation of any trade decision.
We took the institution way in the development of Secutor EA.
FREE

Introduction
WaveTrend Plus is an amazing oscillator that can detect optimal entry points in the market with high precision using complex computations of price and momentum. This version packs many improvements compared to the original WaveTrend such as cleaner visuals, oversold/overbought signals and divergence detection
Signal
Buy when oversold signal appear (green dot below) or when a bullish divergence is detected (green dashed line)
Sell when overbought signal appear (red dot ab
FREE
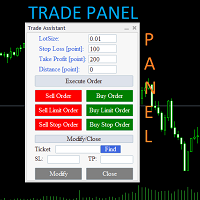
Trade Assistant Panel: Your Optimal Trading Ally "The Trade Assistant Panel" is a graphical tool for traders aiming to simplify and enhance their trading experience. It streamlines order execution and management, allowing you to focus on market analysis and decision-making. With just a few clicks, you can initiate various order types, ensuring that you always have full control over your trading strategy: Buy Orders Sell Orders Buy Stop Orders Buy Limit Orders Sell Stop Orders Sell Limit Orders Y
FREE

EA Builder allows you to create your own algorithm and adapt it to your own trading style . Classical trading, grid, martingale, combination of indicators with your personal settings , independent orders or DCA, visible or invisible TP/SL, trailing stop, loss covering system, break-even system, trading hours, automatic position size etc.. The EA Builder has everything you need to create your perfect EA . There is an infinite number of possibilities, build your own algorithm. Be creative! Pro v
FREE

本指标 基于 Zigzag 基础上... 增加了: 1.增加了箭头指示,使图表更鲜明 2.增加了价格显示,使大家更清楚的看清价格. 3.增加了报警等设置,可以支持邮件发送 原指标特性: 1.基本的波段指标构型. 2.最近的2个ZIGZAG点不具有稳定性,随着行情而改变,(就是网友所说的未来函数) 3.原指标适合分析历史拐点,波段特性,对于价格波动有一定的指导性.
Zigzag的使用方法一 丈量一段行情的起点和终点 (1)用ZigZag标注的折点作为起点和终点之后,行情的走势方向就被确立了(空头趋势); (2)根据道氏理论的逻辑,行情会按照波峰浪谷的锯齿形运行,行情确立之后会走回撤行情,回撤的过程中ZigZag会再次形成折点,就是回撤点; (3)在回撤点选择机会进场,等待行情再次启动,止损可以放到回撤的高点。 一套交易系统基本的框架就建立起来了。 Zigzag的使用方法二 作为画趋势线的连接点 趋势线是很常见的技术指标,在技术分析中被广泛地使用。 但一直以来趋势线在实战中都存在一个BUG,那就是难以保证划线的一致性。 在图表上有很多的高低点,到底该连接哪一个呢?不同的书上画趋势线的方
FREE

The Level Trend PRO indicator is designed to search for reversal entry points into a local trend. It works best on intraday candlesticks M15-H1
Expert Advisor for automatic trading on indicator signals: here Advantages of Level Trend PRO Never redraws its signals;
The possibility of using it as an independent strategy;
Has a support-resistance level;
It works on the stock market, indices, oil, gold and on all timeframes;
It has a notification function on the phone;
The indicator has prov
FREE
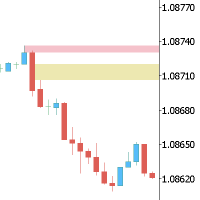
This Expert is the perfect companion for SMC/ICT users.
It allow to draw easily the Supply , Demand , Imbalance(fvg) zones as well set up MetaTrader alerts if price touchs the zone. Imbalance (fair value gap) have options to be displayed in full or based on the filling to the follwing candle, so you will never miss one.
You can also zoom on a clande with a specific period. Very usefull when you look at an 1h candle in the past and you want to see the details in M5.
How does it work ? Simpl
FREE

Phantom Menace EA for XAUUSD M15 Chart Introducing the Phantom Menace EA, an elite trading system with a minimum of 1:2 RR on every trade position meticulously designed for the XAUUSD on the M15 chart. This expert advisor leverages advanced algorithms to detect and capitalize on profitable trading opportunities in the volatile gold market, providing traders with a robust and reliable tool for short-term trading. Key Features: Precision and Efficiency: Phantom Menace EA is engineered for higher f
FREE

Williams Wizard は、市場向けに設計された自動取引システムであり、健全な取引原則に基づいて構築されています。そこにある他の多くのシステムとは異なり、グリッドシステムやマーチンゲール戦略に依存していません。これは、しばしば危険で予測不可能な取引につながる可能性があります.代わりに、この取引システムは、市場の勢いを測定し、潜在的な売買の機会を特定するのに役立つ、信頼性が高く効果的なテクニカル指標を使用します。 USDJPY 4 時間でこのエキスパート アドバイザーを使用することをお勧めしますが、もちろん、他の勢いのある取引ツールでも使用できます。表示されているバックテストは、2019 年から 2023 年までの USDJPY 4 時間で行われます。デフォルト設定から変更された唯一の入力パラメーターは、固定ロット サイズを使用する代わりに、取引ごとに固定口座残高の割合 (1%) を危険にさらすことでした。
FREE

Structure Blocks: a structured way to analyze market structure
This indicator is for you if you are a price action or smart money concept trader. It identifies market trends' ultimate highs and lows and intermediaries' swing lows and highs. It adjusts based on candles' body where most of the volume is, disregarding wicks. Need help or have questions? I am Lio , don't hesitate to reach out! I am always available to respond, help, and improve. How it works:
Each block consists of a move wit
FREE

これは非常にシンプルなインジケーターであり、誰にとっても使いやすいものです。 ただし、非常に視覚的で、便利で効果的です。 すべての外国為替シンボルと時間枠に適しています。 しかし、私のテストと調査から、時間枠 M1、M5、M15 での使用はお勧めしません。
設定。
- アラートのオン/オフを選択します (デフォルトはオン)。
- 2 つのアラート間の時間 (秒) を選択します。 デフォルトは 30 秒です
使い方?
- 上昇トレンド - バーの色が緑色の場合。 - 下降トレンド - バーの色がオレンジの場合。 - バーの色が変わると反転します。
使用上の推奨事項
上昇トレンドでの買いとバーの高値はほぼ同じです (緑色)。 下降トレンドでの売りとバーの高値はほぼ同じです (オレンジ色)。 反転が発生したときに市場に参入することは避け、2 または 3 バーの継続を検討してください。 必要に応じて、上昇トレンドと下降トレンドのバーの色を変更することもできます。
KPLスイングインジケーターと組み合わせれば完璧 KPL Swing Indicator
FREE

Get the full version with the latest updates and more optimized markets to trade and maximize your trading potential. Visit the link below, learn more and upgrade: https://www.mql5.com/en/market/product/120163 Trial version will expire on 20 August 2024.
Your feedback and reviews, whether positive or negative, are highly valued. Optimal Performance : GOLD | EURUSD Secondary Markets : GBPJPY | USDCHF | GBPUSD | XAGUSD | CRYPTO | AUDCAD | AUDUSD (We are currently optimizing our EA for seconda
FREE

This is one of the most popular and highly rated volatility index (VIX) indicators on the market. It provides the same readings as the VIX does for stock indexes. However, this indicator works across all asset classes. VIX Fix Finds Market Bottoms. This indicator is not for inexperienced traders. Use it for day and swing trading. MT4 Version - https://www.mql5.com/en/market/product/112238 Bernard Baruch summed it out best: "Markets fluctuate." The Chicago Board Options Exchange (CBOE) Vo
FREE

マトリックスアローインジケーターマルチタイムフレームパネルMT5 は無料のアドオンであり、マトリックスアローインジケーターMT5の優れた資産です。これは、5つのユーザーがカスタマイズした時間枠と合計16の変更可能なシンボル/機器の現在のマトリックスアローインジケーターMT5信号を示しています。ユーザーは、マトリックスアローインジケーターMT5で構成される10の標準インジケーターのいずれかを有効/無効にするオプションがあります。マトリックスアローインジケーターMT5のように、10の標準インジケーター属性もすべて調整可能です。マトリックスアローインジケーターマルチタイムフレームパネルMT5には、16個の変更可能なシンボルボタンのいずれかをクリックすることで、現在のチャートを変更するオプションもあります。これにより、異なるシンボル間ではるかに高速に作業でき、取引の機会を逃すことはありません。
この無料の マトリックスアローインジケーターマルチタイムフレームパネルMT5 アドオンを使用する場合は、ここでマトリックスアローインジケーターMT5を別途購入する必要があります: https://
FREE

Данный индикатор рисует торговые зоны по фракталам со старших периодов, что упрощает торговлю по уровням.
На одном графике данный индикатор рисует два типа торговых зон. Например если текущий период - H1, то торговые зоны будут искаться по фракталам с H4 и с D1. В стандартных настройках фрактальные зоны с H4 будут рисоваться желтым цветом, а с D1 - зеленым. При наложении зон, происходит смешивание цветов в месте пересечения зон. Как данную вещь поправить, я не знаю в данный момент.
Принцип п
FREE

Dark Inversion is an Indicator for intraday trading. This Indicator is based on Counter Trend strategy but use also Volatility. We can enter in good price with this Indicator, in order to follow the inversions on the current instrument. Hey, I made an Expert Advisor based on this indicator, if you are interested: Dark Titan MT5
Key benefits
Easily visible Inversion Lines Intuitive directional arrows Automated adjustment for each timeframe and instrument Easy to use even for beginners Never
FREE

Easily get all relevant economic events of the current day right into your chart, as markers. Filter what kind of markers do you want: by country (selected individually) and by Importance (High relevance, Medium, Low or any combination of these). Configure the visual cues to your liking. If there is more than one event set to the very same time, their Names will be stacked and you will see the messages merged with the plus (+) sign on the marker. Obviously that long or too much events on the sam
FREE

Unlock the Rhythm of the Markets: Automated Backtesting for Price Action Strategies Experience the power of our revolutionary price action concept backtesting product, capable of conducting years' worth of backtesting in a matter of seconds. Say goodbye to hundreds of hours of manual analysis and hello to instant insights. Our automated backtesting tool empowers traders to create and test strategies from scratch, optimize and refine their current strategies. No more manual constraints - propel
FREE

前日の終値とバーのシフト - MetaTrader用のツール! 前日の終値とバーのシフトインジケーターは、テクニカル分析とトレードの意思決定を向上させるために設計されたツールです。このインジケーターを使用すると、任意のバーのオープン、ハイ、ロー、クローズの詳細な情報にアクセスでき、市場の動きを正確かつ包括的に分析することができます。 自分のチャート上でタイムフレームを重ねることができると想像してみてください。これにより、現在のタイムフレーム内でさまざまな時間枠の各バーを詳細に分析することができます。前日の終値とバーのシフトインジケーターを使用すると、この素晴らしい機能が手の届くところにあります。 前日の終値がサポートとレジスタンスとしての重要性は、トレーダーのコミュニティで広く認識されています。このツールを使うことで、前回の終値で価格が停止したレベルを明確かつ正確に確認できるため、購入と売却の意思決定に貴重な洞察を提供します。 インジケーターをチャートに適用すると、前日のオープン、ハイ、ロー、クローズの重要な情報にすぐにアクセスできます。これらの情報は視覚的に魅力的に強調表示されます。
FREE

Overview:
Recommend Broker exness. TBH, As it is a free script, Please register using this url. So I can get some referral benefit, it motivates me and will keep continue supporting this and any future Expert Advisor.
https://one.exnesstrack.net/a/7lex5q7rkt Introducing the VWAMP Buster Expert Advisor, a sophisticated trading algorithm designed for MetaTrader 5. Harnessing the power of the Volume Weighted Average Price (VWAP), Bollinger Bands, and ATR (Average True Range), VWAMP Bus
FREE

his is a custom indicator based on double-average crossing and arrow marking.
Make multiple lists when blue arrows appear up.
Make a blank list when the red arrow appears down.
When the pink line crosses the green line upwards, the pink line is above, the green line is below, the golden fork appears, and the blue arrow appears.
When the pink line crosses down through the green line, the pink line is below, the green line is above, a dead fork appears, and a red arrow appears.
This is
FREE

The indicator plots a trend channel using the technique by Gilbert Raff. The channel axis is a first-order regression. The upper and lower lines show the maximum distance the Close line had moved away from the axis line. Therefore, the upper and lower lines can be considered as resistance and support lines, respectively. A similar version of the indicator for the MT4 terminal
As a rule, most movements of the price occur within a channel, going beyond the support or resistance line only for a s
FREE

Engulfing Candle Detector
Detectable pattern Double Candlestick Patterns Bullish Engulfing
The first candle is black candle. The second candle opens with a gap below the real body of the black candle but rallies upwards to close above the real body of the black candle. In other words, the second candle's real body completely engulfs the first candle's real body Bearish Engulfing
The first candle is white candle. The second candle opens with a gap above the real body of the white candle but
FREE

Moving Average Trend Alert is a triple MA indicator that helps traders to identify potential market trends based on 3 MAs alignment and crossover.
Moving Average Trend Alert features: Customizable short-term, medium-term, and long-term MAs. Option to filter signals based on a minimum distance between moving averages to avoid premature MAs alignment. Optional Filter of signals with RSI indicator overbought/oversold levels. Optional Filter of signals with ADX indicator. Popup, email, and phone n
FREE

Market Profile 3 MetaTrader 5 indicator version 4.70— is a classic Market Profile implementation that can show the price density over time, outlining the most important price levels, value area, and control value of a given trading session. This indicator can be attached to timeframes between M1 and D1 and will show the Market Profile for daily, weekly, monthly, or even intraday sessions. Lower timeframes offer higher precision. Higher timeframes are recommended for better visibility. It is als
FREE

GOLD ESCAVATOR TRADING BOT A trading bot for XAUUSD. Lot size is calculated by multiplying the lot factor by each 100 USD on account. NB: These are risky strategies which give good returns over time but also pose a risk of blowing up your account. Use on your own accord. LINKS Automatic Pattern and Trendline Analyst : https://www.mql5.com/en/market/product/88794 Automatic Price Action Level Plotter: https://www.mql5.com/en/market/product/94338 MQL5 SIMPLIFIED SUMMARY; learn how to code your
FREE

Peak Trough Analysis is the great tool to detect peaks and troughs in your chart. Peak Trough Analysis tool can use three different peaks and troughs detection algorithm. The three algorithm include the orignal Fractals Indicator by Bill Williams, the Modified Fractals indicator and ZigZag indicator. You can use this peak and trough analysis tool to detect the price pattern made up from Equilibrium Fractal-Wave process. For further usage, there are good guide line on how to use this peak trough
FREE

2016年(05月)のICTのプライベートメンターシップコース(YouTubeで共有)からインスピレーションを受け、当社の革新的なツールは、トレーダーが市場を精密に航行することを可能にします。 60、40、20日の期間をマークすることで、市場の重要な動きを特定し、ICTの教えから得られた知識を活用します。 このインジケーターの真の特徴は、将来の市場動向に関する貴重な洞察を提供する前方キャスティング機能であり、これは入念な歴史データの分析に基づいています。 この先行的なアプローチにより、トレーダーは情報を元にした決定を行うための洞察力を備え、今日のダイナミックなトレーディング環境で明確な優位性を提供します。 さらに、当社のインジケーターはカスタマイズオプションを提供し、トレーダーがそれを自分の好みや特定のトレーディング戦略に合わせて調整できるようにします。 このレベルの適応性により、トレーダーは自信を持って市場のトレンドを予測し、ICTの教えを活用して先を見据え、利益を生む機会を活かすことができます。 当社のインジケーターで予測とカスタマイズの力を体験し、トレーディングスキルを向上させ、
FREE

The Volume Weighted Average Price is similar to a moving average, except volume is included to weight the average price over a period. Volume-Weighted Average Price [VWAP] is a dynamic, weighted average designed to more accurately reflect a security’s true average price over a given period . Mathematically, VWAP is the summation of money (i.e., Volume x Price) transacted divided by the total volume over any time horizon, typically from market open to market close.
VWAP reflects the capital
FREE

VR ドンチャン インジケーターは、ドンチャン チャネルの改良版です。改善はチャネルのほぼすべての機能に影響を与えましたが、主要な動作アルゴリズムとチャネル構造は維持されました。現在のトレンドに応じてレベルの色の変化がボールインジケーターに追加されました。これは、トレーダーにトレンドまたはフラットの変化を明確に示します。スマートフォン、電子メール、または MetaTrader ターミナル自体で 2 つのチャネル レベルのうちの 1 つのブレイクアウトについてトレーダーに通知する機能が追加されました。値札が追加されており、これを利用してトレーダーはチャート上の価格レベルを確認できます。古典的なドンチャン指標の操作アルゴリズムは、トレーダーが指標が計算する期間を自分で設定できるという事実により、最適化され高速化されています。古典的な Donchian インジケーターは、MetaTrader ターミナルで利用可能な履歴全体を計算します。これにより、MetaTrader ターミナルに数学的計算の負荷が大きくかかります。 VR Donchian インジケーターは、トレーダーが設定で設定した金額の
FREE

This is Heiken Ashi smoothed version, where you can choose on what type smoothness you want to make your strategy base. You can choose between EMA or MA, on the period you want. And you can choose colors.
Definition:
The Heikin-Ashi technique averages price data to create a Japanese candlestick chart that filters out market noise. Heikin-Ashi charts, developed by Munehisa Homma in the 1700s, share some characteristics with standard candlestick charts but differ based on the values used to
FREE
MetaTraderマーケットはトレーダーのための自動売買ロボットやテクニカル指標を備えており、 ターミナルから直接利用することができます。
MQL5.community支払いシステムはMetaTraderサービス上のトランザクションのためにMQL5.comサイトに登録したすべてのユーザーに利用可能です。WebMoney、PayPal または銀行カードを使っての入金や出金が可能です。
取引の機会を逃しています。
- 無料取引アプリ
- 8千を超えるシグナルをコピー
- 金融ニュースで金融マーケットを探索
新規登録
ログイン