YouTubeにあるマーケットチュートリアルビデオをご覧ください
ロボットや指標を購入する
仮想ホスティングで
EAを実行
EAを実行
ロボットや指標を購入前にテストする
マーケットで収入を得る
販売のためにプロダクトをプレゼンテーションする方法
MetaTrader 5のための無料のエキスパートアドバイザーとインディケータ - 10

Expert Advisor designed for trading Engulfing Candle Patterns within a manually input price range the D point of harmonic patterns , gartley , bat cypher butterfly ect.
How Does It Work
Step 1 Identify a price range around the end point D of your harmonic pattern. Input two prices into the EA settings Inp9 Upper Level- type the highest price where an engulfing candle pattern can occur. Inp9 Lower Level - type the lowest price where an engulfing candle pattern can occur. Step 2 inp11_block
FREE

Easy ICT SP500 is an Expert Advisor meticulously crafted to execute trading strategies based on the simplified ICT Bullet Strategy, incorporating Fair Value Gap analysis for precise position entries. Tailored specifically for the SP500, this EA aims to provide traders with a reliable and optimized tool for navigating the dynamic landscape of the stock market. Distinguished Strategy: this EA distinguishes itself by employing a sophisticated yet simplified version of the ICT Bullet Strategy, stra
FREE

EA that operates the EURUSD through order blocks and liquidity gaps in a 3-minute time frame. Backtested between 01/01/2020 and today (10/26/2023) where it can generate a net profit of $39,303.75 (basic Pepperstone account commissions) starting from a base account of $10,000. The maximum balance reduction is 24.14% and the maximum equity reduction is 28.51%, using a constant risk of 2.1% of the initial account balance and a maximum lot size of 1.6. There are several variables that the user can
FREE

This indicator is the converted Metatrader 5 version of the TradingView indicator "ATR Based Trendlines - JD" by Duyck. This indicator works by automatically and continuously drawing trendlines not based exclusively on price, but also based on the volatility perceived by the ATR. So, the angle of the trendlines is determined by (a percentage of) the ATR. The angle of the trendlines follows the change in price, dictated by the ATR at the moment where the pivot point is detected. The ATR percentag
FREE

This indicator is a simple tool to spot a possible trend.
When the ribbon below the price bars, It will turn to Green color and the trend is seen to be bullish When the ribbon above the price bars, it will turn to Red color and the trend is seen to be bearish. It can be used a either Entry Signal Exit Signal or trailing stop, so it is very versatile. By default color : Green is UP trend and Red is Down trend and this work perfect with Bar4Colors.ex5
FREE

!! THE FIRST FREE NEURAL NETWORK EA WITH EXCELLENT AND REALISTIC RESULTS.!! Another beautiful work of art, guys you don't know the powerful creations that are created by my developer Nardus Van Staden. Check him out guys and gals, he is the real deal, an amazing person and a professional when it comes to coding and business, if you want work done!, hit him up! you can get in contact with him HERE .
THE FOLLOWING PRODUCT IS A FREE VERSION OF A PAID VERSION THAT IS TO COME, PROFITS ARE GOING TO
FREE
Notes: 1. Martingale is a betting system. You just download this for entertainment purposes. 2. For MT4 version please contact via private message.
Strategy description 1. This bot uses supertrend indicator to decide entry and exit. 2. Every supertrend signal causes entry but exit if already in profit. You do not need to download the indicator. It is embedded in EA source code. 3. The bot works in both direction simultaneously(Hedging). 4. Trading decisions are based on candle closure. So thi
FREE

The DR IDR Range Indicator plots ADR, ODR and RDR ranges for a given amount of days in the past. A key feature that appears is that it calculates the success rate of the ranges for the shown days. This indicator is perfect for backtest since it shows ranges for all of the calculated days, not just the most recent sessions. PRO VERSION
https://www.mql5.com/en/market/product/93360 Remember: this free version counts neutral days as true days , so stats might be slightly inflated. To get perfect
FREE

When prices breakout resistance levels are combined with momentum oscillator breaks out its historical resistance levels then probability emerges to record farther higher prices. It's strongly encouraged to confirm price breakout with oscillator breakout since they have comparable effects to price breaking support and resistance levels; certainly short trades will have the same perception. Concept is based on find swing levels which based on number of bars by each side to confirm peak or trough
FREE

The ATR Exit indicator uses the candle close + ATR value to draw trailing stop lines (orange under buys, magenta over sells) that advance with the trend until the trend changes direction. It uses a multiple of the Average True Range (ATR), subtracting it’s value from the close on buy, adding its value to the close on sell. Moreover, the trailing stop lines are generated to support the order’s trend direction (long or short): In an upward trend, the long trailing stop line (orange line under bu
FREE

Thermo MAP is a multicurrency and multitimeframe indicator that display a smart heat map based on proprietary calculations. Watch how Forex market moved and is currently moving with a single dashboard and have a consistent and good idea of what is happening!
It can be suitable for both scalping or medium/long term, just select options that better fit your trading style Symbols list are automatically sorted based on the preferred column. There is the possibility to click on: First row, timefram
FREE

MQL5ユーティリティボタンの紹介 - 楽な取引管理のための究極のソリューション!ワンクリックで、すべてのオープンポジションを即座に閉じることができ、取引体験をこれまで以上にスムーズかつ効率的にします。
この革新的なツールは、シンプルさを念頭に置いて設計されており、あらゆるレベルのトレーダーにとって使いやすいことを保証します。あなたがベテランの専門家であろうと初心者であろうと、MQL5ユーティリティボタンは比類のない容易さであなたの取引を管理するための手間のかからない方法を提供します。 このボタンは、すべてのオープンポジションを閉じるプロセスを簡素化するだけでなく、貴重な時間を節約します。各ポジションを1つずつ手動で閉じる必要はもうありません-MQL5ユーティリティボタンは、ほんの数秒ですべてを行います。 では、なぜ待つのですか?今すぐMQL5ユーティリティボタンをダウンロードして、取引を次のレベルに引き上げましょう。シンプルで効率的、そしてすぐに使用できる-貿易管理プロセスを合理化しようとしているトレーダーに最適なツールです。
FREE

RS Zone is an Indicator used to plot the support and resistance levels of each asset. and each time period as we determine The principle for calculating support and resistance levels is based on the price range (Range SR) to see if there are points where the price repeatedly reverses at that price level or not. The total pot will be equal to the Total SR that we set. Example If Range SR is equal to 120, the system will choose to look at data going back 120 candlesticks to find whether there is a
FREE

Grid Engulfing MT5 is designed with a engulfing candle for entry points.
Please give me 5 stars reviews, than I will be maintain & update this free EA for longtime or all of time. I am promise.
Recommendations: Currency pair: ALL PAIR CURRENCIES Timeframe: M5 Minimum deposit currencies : $250 ($500 recommended) Account type: Raw or zero spread accounts IMPORTANT: It is very important to use LOW SPREAD accounts for best results !
setfiles allcurrencies (best pair : EURUSD, EURGBP, EURCAD
FREE

TransitTrendlines this is a automatically trendline drawer, it draw both horizontal and diagonal trendlines. The horizontal trendlines are the pivot points of the day timeframe and the diagonal trendlines are based on the current time frames. You can adjust the diagonal trendlines by increasing the number of bars to draw the diagonal trendline and can also adjust the steepness. Note that the Horizontal trendlines are based on the day pivot points not currant time frame. Join mql5 transitbk98 cha
FREE
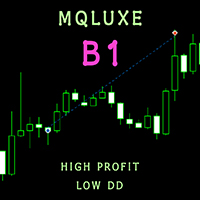
*** ATR --------------------------------- RSI ***
MQLuxe B1 is a special MT5 Robot that is a fully automated trading system that doesn't require any special skills from you. Just fire up this EA and rest. You don't need to set up anything, EA will do everything for you. EA is adapted to work on small deposits. Combining the Average True Range (ATR) indicator with the Relative Strength Index (RSI) can create a robust trading strategy in the Forex market. This combination can help you
FREE

The indicator IQuantum shows trading signals for 10 symbols in the daily chart: AUDUSD, EURUSD, GBPCHF, GBPUSD, NZDUSD, USDCAD, USDCHF, USDJPY, USDNOK, and USDSEK.
Signals of the indicator are produced by 2 neural models which were trained independently from one another. The inputs for the neural models are normalised prices of the symbols, as well as prices of Gold, Silver and markers of the current day.
Each neural model was trained in 2 ways. The Ultimate mode is an overfitted neural mo
FREE

This Mt5 Indicator Signals when there is two opposite direction bars engulfed by current bar. has a recent Exponential Moving Average Cross and past bar was oversold/bought Expert Advisor Available in Comments Free Version Here : https://www.mql5.com/en/market/product/110114?source=Site  ; Full Alerts for mt5 terminal , phone , email, print to file, print to journal Buy Signal ( blue line ) Past ema cross ( set at 30 bars back ) Past bar rsi is oversold ( level 40 ) Engulfing bar closes
FREE

The indicator analyzes the chart and identifies Doji candlesticks. Shows their appearance and signals the appearance of such a candle (if allowed in the parameters). Also, this indicator shows the strength of the reversal in the form of bars of different colors (the more green, the more likely the rise, the more red - the fall in price). The direction of the signal depends on the direction of the previous candles, as the Doji signals a reversal or correction. In the indicator settings, you can
FREE
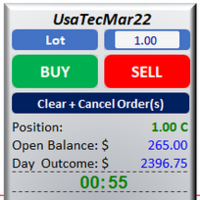
Boleta Trade Pad 0 This utility allows you to send orders quickly and easily using the shortcut keys SHIFT to buy and CTRL to sell. It is also possible to set Stop Loss and Take Profit, in price or points, directly on the TradeX. Use one of the four risk options (0,5%, 1,0%, 2,0% or 4,0%) to get the pending order volume according to the size of the last closed candlestick and the account balance. Once positioned, it offers Breakeven and Partial Exit options of 70%, 50% and 30% of the positioned
FREE

MT4 Version Fibonacci Bollinger Bands MT5 Fibonacci Bollinger Bands is a highly customizable indicator that shows areas of support and resistance. This indicator combines the logic for the Bollinger Bands with the Fibonacci level. Fibonacci Bollinger Bands is the first indicator in the market that allows the user to 100% customize up to 12 Fibonacci levels, the Moving Average type and the price data source to use for the calculations. This flexibility makes the Fibonacci Bollinger Bands easily
FREE
This is a strategy builder . One of a kind. Turn your trading strategies and ideas into Expert Advisors without writing single line of code. Generate mql source code files with a few clicks and get your fully functional Expert Advisors, which are ready for live execution, strategy tester and cloud optimization.
There are very few options for those who have no programming skills and can not create their trading solutions in the MQL language. Now, with Bots Builder, anyone can create Expert Advi
FREE

We often need to know the sudden change in trend that happens on the graph and this can be confirmed through indicators.
This indicator shows the moments of trend reversal and how in which trend the price is shifting.
Custom background, no need to configure the colors in the chart, just drag the indicator!
Indication with arrows.
- Blue arrow: Upward trend.
- Pink Arrow: Downward Trend.
NOTE: Free indicator, support may take a while to respond.
FREE

Key Price Levels Indicator Indicator that shows the highs and lows for the significant price levels for past periods that could be potentially considered as reaction levels. The indicator displays the following price levels: Yesterday high and low The day before yesterday high and low Two days back high and low Last week high and low Last month high and low Last three month high and low (Quarter) Last year high and low
FREE

Another request from my brotherhood was putting the name of the Symbol being seen - a little bigger - on the Chart, just to get sure that they are seeing the correct one... Mistakes pay a high price on the market... It is a very effective, and almost resource-null-consuming indicator that displays the current Symbol Name and Timeframe in almost any position of your Chart, with any color, and any Font Size... And also you can change the divisor character that is presented between the Symbol Name
FREE
The EA tries not to open more than two positions of each type (BUY and SELL). The following rule is used: if there is a position, then the next position of the same type can be opened no earlier than after Trade once in the "timeframe of checked elements" * number of seconds on the History: timeframe of checked elements timeframe.
Input Values Trade once in "timeframe of checked elements" - the minimum time interval, after which the second position can be opened (the parameter value
FREE

The DE_30_803015187_S_Ke_CF_SQX is an algorithmic trading strategy for MetaTrader, tested on DAX using the M30 timeframe from December 7, 2017, to June 2, 2023. There is no need to set up parameters, all settings are already optimized and fine-tuned.
Recommended broker RoboForex because of EET timezone.
You can find the strategy source code for StrategyQuant at the link: http://quantmonitor.net/listing/dax-keltner-channel-breaker/
Key details are:
MagicNumber: 803015187 Main Chart: Cur
FREE

Free version of the TickScalper indicator. The Tick Scalp indicator is a trading assistant for a scalping trader. Works in a separate window. Tracks the momentary activity of the market, shows the graph of the movement of ticks and the strength of bulls or bears. Sometimes it can anticipate the beginning of a strong movement before any other indicators. Helps the trader to make a decision to open the desired order. Designed to work on any instrument. Used timeframes from M1 to M15. Has simple a
FREE

少し速度のために変更されました。 テスターは、電子メールで私に書いて、興味を持っている新しい顧問のために必要とされます777basil@mail.ru
インジケータは履歴の価格変化に基づいて計算され、数学的に計算され、データが再び受信されるたびに再計算されます。 それは異なる時間枠で使用することができます。 70%のインジケータの境界から、価格の動きや統合の方向に変化があります。 このようにして、トレンドとチャネルの中央の両方を国境から取引することができます。 抵抗/サポートレベルを決定するためにトレンド取引でそれを使用する方が良いです。 ビデオでは、インジケータの動作を確認できます: https://youtu.be/UG2ZZEH9B_U 通信のための連絡先 777basil@mail.ru 私たちは、専門家、あなたのタスクのための指標を準備します。
インジケータは履歴の価格変化に基づいて計算され、数学的に計算され、データが再び受信されるたびに再計算されます。 それは異なる時間枠で使用することができます。 70%のインジケータの境界から、価格の動きや統合の方向に変化が
FREE

Descubre el poderoso aliado que te guiará en el laberinto de los mercados financieros. Este indicador revolucionario te llevará de la incertidumbre a la claridad, permitiéndote identificar con precisión los puntos de inflexión del mercado. Mejora tus decisiones de entrada y salida, optimiza tus operaciones y ¡multiplica tus ganancias con confianza.
¡Para más información, te invitamos a unirte a nuestro canal de Telegram en https://t.me/Profit_Evolution ¡Allí encontrarás contenido exclusivo, a
FREE
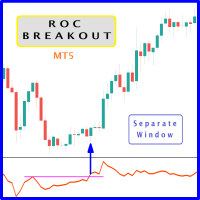
When prices breakout resistance levels are combined with Rate of Change oscillator "ROC" breaks out its historical resistance levels then higher chances emerges to record farther prices. It's strongly encouraged to confirm price breakout with oscillator breakout since they have comparable effects to price breaking support and resistance levels; certainly short trades will have the same perception. Concept is based on find swing levels which based on number of bars by each side to confirm peak or
FREE

A professional tool for trading - the divergence indicator between the MACD and the price, which allows you to receive a signal about a trend reversal in a timely manner or catch price pullback movements (depending on the settings). The indicator settings allow you to adjust the strength of the divergence due to the angle of the MACD peaks and the percentage change in price, which makes it possible to fine-tune the signal strength. The indicator code is optimized and is tested very quickly as
FREE

Combining the best of Price Action , Directional Movement , and Divergence/Convergence analysis, Candle Color Trend is a easy and reliable way to identify trend direction. The indicator automatically paints the candles according to the assumption that an uptrend is defined by prices that form a series of higher highs and higher lows. In contrast, a downtrend is defined by prices that form a series of lower highs and lower lows. Additionally, ADX Wilder indicator is used to measure trend weakness
FREE

これが究極のRVIインジケータです。 警告矢印を追加 潜在的な抵抗レベルを特定することができます 読み値を改善するための2つの追加フィルタ それはさらに良好な結果を示すために平滑化される m1からm30までの短い時間枠で構成されていました ひどく悪くはありません スクリーンショットmacdのように、このインジケータを追加のフィルタとともに使用することをお勧めします これが究極のRVIインジケータです。 警告矢印を追加 潜在的な抵抗レベルを特定することができます 読み値を改善するための2つの追加フィルタ それはさらに良好な結果を示すために平滑化される m1からm30までの短い時間枠で構成されていました ひどく悪くはありません スクリーンショットmacdのように、このインジケータを追加のフィルタとともに使用することをお勧めします
FREE
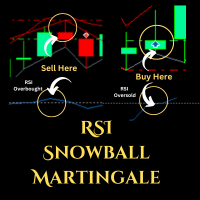
Expert Advisor (EA) that utilizes the basic Dow Theory strategy along with RSI for opening positions, and employs support and resistance levels from the Zigzag indicator as stop-loss and take-profit points, you can follow these guidelines: Dow Theory Strategy : This involves analyzing trends using the Dow Theory principles, mainly focusing on identifying primary trends (bullish or bearish) and secondary trends (corrections). You'll need to implement rules for identifying these trends based on pr
FREE

VWAP Fibo Bands RSJ is an indicator that traces the lines of the daily VWAP and from it creates bands using Fibonacci proportions. This spectacular indicator creates 10 band levels through the selected VWAP period using Fibonacci ratios.
It is fantastic how the prices respect each level of the bands, where it is possible to realize that almost every time the price closes above / below a level of the bands he will seek the next one. If close above will seek to reach the level above and if close
FREE

ある MT5 または MT4 アカウントから別の MT5 アカウントに取引量をコピーするためのシンプルなユーティリティ。 ネッティング口座とヘッジ口座の間で任意の組み合わせでポジションをコピーできます。デフォルトでは、同じボリュームを持つすべての一致するシンボルによって開かれたポジションがコピーされます。シンボル名が異なる場合、またはコピーされたポジションのボリュームが異なる場合、またはすべてのポジションをコピーする必要がない場合は、この 投稿 で説明されている設定で目的の動作を指定できます。この製品は、将来のリリースで機能を拡張します。 バージョン 2.0 までは、この製品は無料です。 インストール順序:
送信者アカウントの端末で、Expert Advisor を送信者モードで起動します。 受信者アカウントのターミナルで、Expert Advisor を受信者モードで起動し 、以前に起動した送信者の 1 つを選択して、そこからポジション ボリュームをコピーします。
FREE

VR Assistant Charts — これは、MetaTrader 取引ターミナル ウィンドウでグラフィカル オブジェクトを操作するトレーダーにとって便利なツールです。このプログラムを使用すると、マウスをワンクリックするだけで、MetaTrader ターミナル内のトレンド ライン、フィボナッチ レベル、ギャン ファン、その他のグラフィック要素の色、スタイル、太さ、その他の特性を変更できます。 設定、設定ファイル、デモ版、説明書、問題解決方法は、以下から入手できます。 [ブログ]
レビューを読んだり書いたりすることができます。 [リンク]
のバージョン [MetaTrader 4] このユーティリティは、グラフィカル オブジェクトを使用して金融商品を分析するトレーダーの単調な作業を大幅に容易にします。すべての操作は、コンピューターのマウスを使用してチャート上で直接実行されます。このプログラムは、MetaTrader 4 および MetaTrader 5 取引プラットフォーム用のテクニカル指標の形式で実装されており、他の指標、アドバイザー、スクリプトと同時に使用することが可能
FREE

Mouse You can draw fibonaccis moving the mouse over the zigzag indicator Pin them You can click on fibonacci with this option and it will no longer be deleted unless you click on it again :) Precision The tuned fibonacci gets the precise point in lower timeframes Enjoy it You can ask me for add more features, so please comment and leave your ranting for me to be happy, thank you :)
FREE

hello,
king binary sureshot mt5 binary indicator,
1 minute candle
1 minute expire
Join Our Telegram
https://t.me/KINGBINARYOFFICIAL
Alright. This indicator works on MT5 and is very easy to use. When you receive a signal from it, you wait for that candle with the signal to close and you enter your trade at the beginning of the next new candle. A red arrow means sell and a green arrow means buy. All arrows comes with a long dotted like for easy identification of trade signal. Are you oka
FREE

FRB Trader - Our mission is to provide the best support to customers through conted and tools so that they can achieve the expected results
FRB Support and Resistance
- Indicator places lines on the chart to show Support and Resistance regions. - You can choose the timeframe you want to calculate, as well as the colors of the lines. - Algorithm calculates the points where the strengths of the asset are considered and are extremely important for decision making.
FREE

This Supertrend strategy will allow you to enter a long or short from a supertrend trend change. Both ATR period and ATR multiplier are adjustable. If you check off "Change ATR Calculation Method" it will base the calculation off the S MA and give you slightly different results, which may work better depending on the asset. Be sure to enter slippage and commission into the properties to give you realistic results. If you want automatic trade with Supertrend indicator, please buy following pr
FREE

インディケータはチャート上にラウンドレベルを示します。 それらは、心理的、銀行的、または主要なプレーヤーレベルとも呼ばれます。 これらのレベルでは、強気と弱気の間に真の戦いがあり、多くの注文が蓄積され、ボラティリティの増加につながります。 インジケーターは、任意の楽器と時間枠に自動的に調整されます。 レベル80を突破してテストすると、購入します。レベル20を突破してテストすると、販売されます。ターゲットは00です。 注意。強力なサポートとレジスタンスレベルのため、価格は00レベルをわずかに下回る可能性があります。
入力パラメータ 。
Bars Count - 線の長さ 。 Show 00 Levels - 00レベルを表示するかしないか 。 Show 10, 90 Levels 。 Show 20, 80 Levels 。 Show 30, 70 Levels 。 Show 40, 60 Levels 。 Show 50 Levels 。 N Lines - チャートのレベル数を制限するパラメーター 。 Distance 00 Levels - レベル間の距離(自動または手動
FREE

This Advanced Pivots Point is a MT5 Indicator and the essence of this technical indicator is to transform the accumulated history data. Pivot Point Indicator provides for an opportunity to detect various peculiarities and patterns in price dynamics which are invisible to the naked eye. Pivot Points Fibonacci retracements Previous day’s open, high, low, and close.
FREE

Forex Scalper EA trades three currency pairs simultaneously! The strategy is very simple: limit orders are placed in both directions until one is triggered. Pyramid scheme (multiple limit orders) increase profits when price moves in one direction or another.
This EA provides functions: Start Trading, End Trading, Сlose Order(Time), Pending Order Placement (Time), Tralling stop (automatically according to strategy), trading can be switched off, daily range (strategy), stop loss per day (risk m
FREE

GREAR TRADING BOT – это инновационный торговый бот для MetaTrader 5, разработанный для автоматизации стратегий торговли с использованием моделей "Sweep + BOS" и "HTF Sweep + LTF QM". Этот экспертный советник интегрирует расширенные методы анализа рыночных данных, позволяя пользователям выбирать между двумя мощными стратегиями входа. Благодаря гибкости настроек, бот может адаптироваться к различным торговым условиям, проверяя наличие свипов и уровней BOS на различных таймфреймах.
Для стратегии
FREE

Harmonica Basic is a free expert advisor that opens a mesh of positions. It does not close any positions, and its up to you to manually close profitable positions at your desire. There are no options to configure. Distance between positions is automatically set based on market conditions. The higher the timeframe - the wider the distance between positions.
FREE

This application is now replaced by Ofir Notify Light Edition (Free) or Ofir Notify (paid).
Thank all for your positive feedbacks.
Telegram Alerts is a tool which send alerts on trades to Telegram Alert on any event concerning a position : Opening, Closing, modification (SL, TP) Alert on Equity change Display Risk, Reward and progress of profit/lost for each position Send signals from your indicators or experts Multi-lingual If you are facing any issue using this utility, please contact me t
FREE

Draw and Sync Objects Multiple Charts 1. Draw objects by key press. ( You must: 1. Press Function key => 2. Click where you want to draw => 3. Draw it => 4. Press ESC to complete). (If you don't want to draw after pressing function key, you must press ESC to cancel). 2. Developing : Sync selected objects to multiple charts by button. 3. Developing: Hide objects that do not belong to the current symbol (Objects drawn with this indicator will belong to the symbol they are plotted on. When your c
FREE

Session Killzone Indicator
Indicator that helps you to identify the killzone times of both London and NewYork sessions which usually is the most times for high volatility and taking liquidity from the market. Killzone times are configurable through indicator parameters. The indicator adjusts the range of the killzones based on the daily trading range.
FREE

Highly configurable Trader Dynamic Index (TDI) indicator.
Features: Highly customizable alert functions (at levels, crosses, direction changes via email, push, sound, popup) Multi timeframe ability (higher and lower timeframes also) Color customization (at levels, crosses, direction changes) Linear interpolation and histogram mode options Works on strategy tester in multi timeframe mode (at weekend without ticks also) Adjustable Levels Parameters:
TDI Timeframe: You can set the lower/higher
FREE

Cybertrade ATR Trend Zone - MT5 The indicator shows, by calculating the ATR (Average True Range), the zone of probable price resistance. Indicated to be used as a probable exit point of an operation.
It works on periods longer than the period visible on the chart. All values are available in the form of buffers to simplify possible automations. This indicator is the same one we use in our EA. Also check out our other products.
FREE

Andrew Pitch fork is one of the most interesting string trend & Channel & Fibo technical analysis , it's like ALL in ONE tool would be very enough for you.
FYI, This indicator will expire by end of July 2022.
Using 2 Andrew pitch Forks with 2 different time frames on same chart is really very hard working and might be impossible , but with this indicator is possible now , moreover , using this method as Candle Volume based analysis give strong trust for your trade.
I assume if you are hav
FREE

Defining Range ( DR ) and Implied Defining Range ( IDR ) indicator
New Pro version here :
https://www.mql5.com/en/market/product/91851?source=Site+Profile+Seller
Show DR and IDR ranges on the chart for Regular , Overnight and After Sessions
for more information how DR and IDR work and the high probability watch : https://www.youtube.com/@themas7er or https://twitter.com/IamMas7er
Remember to set set your chart TimeZone when you attach indicator to the chart under indicator set
FREE

It predicts the most likely short-term price movement based on advanced mathematical calculations.
Features Estimation of immediate price movement; Calculation of the real market trend; Calculation of the most important support and resistance levels; Algorithms optimized for making complex mathematical calculations with a minimal drain of system resources; Self-adjusting for better performance, so it’s able to work properly at any symbol (no matter how exotic it is) and any timeframe; Compatib
FREE
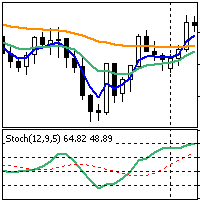
This is a simple trend strategy for Forex. Recommended timeframe is H1, the default settings are for the GBPUSD currency pairs (for other timeframes and currency pairs, it is necessary to select other indicator settings). The following indicators are used in the strategy: Exponential Moving Average: EMA (4) — blue Exponential Moving Average: EMA (13) — green Exponential Moving Average: EMA (50) — orange. Stochastic Oscillator (12,9,5), levels — 20, 40, 60, 80. A buy trade is opened at the openin
FREE

「取引通知」は、オープンまたはクローズされたすべての取引、および各取引の損益結果を モバイル通知または端末アラート で通知することを目的としたユーティリティ ツールです。 これは私自身が長い間使用してきたツールなので、無料で共有することにしました。
入力パラメータ: (すべての入力は true/false タイプであり、 値を変更するにはそれをダブルクリックします) Notify for Closed Positions PnL : true の場合、クローズされた取引の $ 結果を通知します。このようにして、取引がいつ終了するか、そしてその結果について通知されます。
これは、取引の損益の上下を監視しながらチャートに釘付けにならないようにするために便利な機能です。これにより、ストレスの少ない取引が可能になります。 新しく開かれた取引を通知する : true の場合、新しい取引が開かれたときに通知します。 未決注文を設定し、エントリーレベルがいつトリガーされるかを知りたい場合に非常に重要なパラメーターです。
あなたがアルゴ トレーダーで、市場に参入する EA を使
FREE

これは、異なるブローカーやアカウントの異なるタイプが異なるスプレッド値(ビッドとアスク価格の差)を持つことができることは秘密ではありません。 このような状況では、同じExpert Advisorが完全に異なる結果で取引されます。 シンボルの広がりが大きいほど、あなたが得る利益は少なく、ブローカーがあなたから得る利益は多くなります。 したがって、スプレッドを測定することは、特にスキャルピング、真夜中と日中の戦略のために、ブローカーと口座の種類を選択するために非常に重要
無限大からシンプルだが信頼性の高い指標は、あなたが任意のブローカーで任意のシンボルの広がりを追跡するのに役立ちます!
ちょうどあらゆる図表に散布図の表示器を取付けて下さい(M1-H1は推薦されます)。 スプレッドメーターは、最大の最小スプレッドと平均スプレッドの変更を追跡し、記憶します。
チャートの下部にある散布計インジケーターのヒストグラムは、リアルタイムで履歴を蓄積します。 したがって、インジケータを常に使用することが重要です。 VPSまたは永続的なインターネット接続を持つコンピュータをお勧めします。
FREE

The robot issues buy/sell signals based on the setting of the RELATIVE STRENGTH INDICATOR
Know our products
Review and get a month's rental on any of our paid robots.
This Expert Advisor (EA) works on HEDGE (Forex, etc.) and NETTING (Bovespa, etc.) accounts, but manages only one position at a time.
The filters are used to increase the accuracy and if activated and not met your criteria, the order is not sent. 5 FILTERS available: ADX indicator; ADX + (DM +) and - (DM-) direction
FREE

The 3 Candlestick Engulf indicator is a candlestick pattern indicator that considers the last 3 bearish candles for a Bullish Engulf candlestick pattern signal and last 3 bullish candlesticks followed by a Bearish Engulf candlestick pattern for a bearish signal. Engulfs are also presented in both trending and non-trending situations of the market though recommended to move with signals that are in line with the trend basing on the moving average. The indicator has multiple input features that yo
FREE

The MasterOBV indicator is a powerful technical analysis tool that utilizes volume, positive correlation, and a Moving Average (MA) to enhance trend identification in financial markets. By incorporating assets with positive correlation through the indicator menu, MasterOBV provides a refined approach to assessing the strength and direction of trends. The inclusion of the Moving Average adds additional smoothing to price movements, aiding in a more accurate tracking of the underlying trend over
FREE

Introduction to Fractal Moving Average Fractal Moving Average indicator was designed as part of Fractal Pattern Scanner. Inside Fractal Pattern Scanner, Fractal Moving Average Indicator was implemented as multiple of chart objects. With over thousands of chart object, we find that it was not the best and efficient ways to operate the indicator. It was computationally too heavy for the indicator. Hence, we decide to implement the indicator version of Fractal Moving Average indicator to benefit ou
FREE
PREDICTOR MASTER(プレディクターマスター):
商品紹介:Predictor Master エキスパートアドバイザー
Predictor Master エキスパートアドバイザーは、効率的かつ精度の高い金融市場での取引を目指した先進の自動取引システムです。この強力なEAは、カスタム指標とインテリジェントな戦略の組み合わせを活用して、収益性の高い取引機会を追求します。
カスタム指標「Predictor」: Predictor Masterの中心は、革新的なカスタム指標である「Predictor(プレディクター)」です。この指標は、過去の市場パターンから学習する最新のニューラルネットワークによって駆動されています。上昇トレンド(bull)と下降トレンド(bear)の情報を使用することで、Predictor Masterは将来の市場方向をより確率的に特定し、正確なエントリーや出口のシグナルを提供します。
サポート&レジスタンス戦略とオーダーグリッド: Predictor Masterは、サポートとレジスタンスに基づく戦略を採用し、取引のエントリーポイントと出口ポ
FREE

Pivot Point Supertrend (corresponds to Pivot Point Super Trend indicator from Trading View) Pivot Point Period: Pivot point defined as highest high and highest low... input 2 = defining highest high and highest low with 2 bars on each side which are lower (for highest high) and are higher (for lowest low calculation) ATR Length : the ATR calculation is based on 10 periods ATR Factor: ATR multiplied by 3
FREE

The OHLC indicator shows the current and historical values of High, Low, Open, Close and Mid for a specific time period. It can plot the current values or the values from the previous session. The indicator's range can be calculated from a daily, weekly, monthly, or user-specified session.
Levels High of the current or previous session. Low of the current or previous session. Open of current or previous session. Close of the current or previous session. Midpoint of the current or pre
FREE

The TTM Squeeze is a trading strategy developed by John Carter of Trade the Markets that uses the combination of Bollinger Bands and Keltner Channels to identify periods of low volatility, followed by periods of high volatility. The strategy is based on the principle that low volatility periods are typically followed by high volatility periods and is used to identify potential trading opportunities. When the Bollinger Bands move inside the Keltner Channels, it is referred to as a squeeze, and i
FREE

RENKO Reversal by StockGamblers Actually working RENKO in MT5. Uses "custom symbols" for drawing. You can apply any indicators with complete peace of mind. The movement of the last price is displayed in real during the formation of the "brick". Put the script in the MQL5/Experts folder. More precisely: C:\Users\user\AppData\Roaming\MetaQuotes\Terminal\terminal_number\MQL5\Experts Settings: ValuePerBar - height of the "brick" in points revCandle - multiplier for the height of the turning "brick".
FREE
This EA trades using the Average Directional Index (ADX) indicator. It offers many entry strategies and flexible position management settings, plus many useful features like customizable trading sessions and a martingale mode. [ Installation Guide | Update Guide | Troubleshooting | FAQ | All Products ] Easy to use and supervise It implements 4 different entry strategies Customizable break-even, SL, TP and trailing-stop Works for ECN/Non-ECN brokers Works for 2-3-4-5 digit symbols Trading can be
FREE

Candle countdown timer that can be moved anywhere on the chart. Enable or disable alerts directly on the chart by double-clicking the timer (no need to access input settings). Runs smoothly without the glitches and delays often encountered with other candle timers. To move the timer: Double-click to select it, then click and hold the upper-left anchor point and drag it to the desired location. Key Features: The timer uses system time, so it runs smoothly without delays. Easily turn alerts on or
FREE

EA Hiloseven é baseado em 2 médias móveis simples, máximas e mínimas dos últimos 7 períodos. MODO TENDÊNCIA: Compra no fechamento da vela acima da média das máximas. Fecha a negociação com stoploss ou fechamento da vela abaixo da máxima de 7 períodos. A venda ocorre de maneira inversa. MODO CONTRA TENDÊNCIA: Compra no fechamento da vela abaixo da média das mínimas. Fecha a negociação com stoploss ou fechamento da vela acima da mínima de 7 períodos. A venda ocorre de maneira inversa. -----------
FREE
MetaTraderマーケットが取引戦略とテクニカル指標を販売するための最適な場所である理由をご存じですか?宣伝もソフトウェア保護も必要なく、支払いのトラブルもないことです。これらはすべて、MetaTraderマーケットで提供されます。
取引の機会を逃しています。
- 無料取引アプリ
- 8千を超えるシグナルをコピー
- 金融ニュースで金融マーケットを探索
新規登録
ログイン