YouTubeにあるマーケットチュートリアルビデオをご覧ください
ロボットや指標を購入する
仮想ホスティングで
EAを実行
EAを実行
ロボットや指標を購入前にテストする
マーケットで収入を得る
販売のためにプロダクトをプレゼンテーションする方法
MetaTrader 5のための無料のエキスパートアドバイザーとインディケータ - 14

Always backtest before using.
MintyGrid is a simple EA that has an RSI indicator. On winning trades MintyGrid will take profit based on configuration. On losing trades MintyGrid uses a grid strategy to place resistance points using a martingale/reverse-martingale strategy to be prepared for when the market swings in the opposite direction. MintyGrid can be configured to run on many currency pairs simultaneously and will work as long as the pairs are similar in price. MintyGrid always trades w
FREE

The Market Momentum indicator is based on the Volume Zone Oscillator (VZO), presented by Waleed Aly Khalil in the 2009 edition of the International Federation of Technical Analysts journal, and presents a fresh view of this market valuable data that is oftenly misunderstood and neglected: VOLUME. With this new approach of "seeing" Volume data, traders can infer more properly market behavior and increase their odds in a winning trade.
"The VZO is a leading volume oscillator; its basic usefulnes
FREE
This EA trades daily breakouts placing bidirectional pending orders using the last day's trading range -or using market orders, as desired-, provided these price levels have not been yet tested. It offers many trading behaviors and flexible position management settings, plus a martingale and inverse martingale mode. [ Installation Guide | Update Guide | Troubleshooting | FAQ | All Products ] Easy to use and supervise Customizable break-even, SL, TP and trailing-stop Works for ECN/Non-ECN broker
FREE

Hi! This is a Bot I created for my own trading portfolio. But was thinking that to build the trust with any of you guys to use my other systems,I put this one up for free. The only thing I am asking for is a honest review. So if u like it and when u realise it it is actually a good working bot, u can look into the other bots that I have here on the market to add more strategies to your portfolio. I always make bots without Martingale or Grid systems because I mainly make these bots for my own po
FREE

Corazon is an EA that operates using the martingale method, with carefully selected entry points. When a trade goes in the wrong direction, the EA will open martingale orders with increasing lot sizes and distances, then average the price and reset the overall TP for all the orders. Corazon EA also has options for trailing functionality for individual orders, trailing all martingale orders together, or only trailing the initial order.
FREE

The NQ_H4_820422556_S_BB_CF_SQX is an algorithmic trading strategy for MetaTrader, tested on NQ using the H4 timeframe from December 7, 2017, to June 2, 2023. There is no need to set up parameters, all settings are already optimized and fine-tuned.
Recommended broker RoboForex because of EET timezone.
You can find the strategy source code for StrategyQuant at the link: http://quantmonitor.net/listing/nasdaq-trend-catcher/
Key details are:
MagicNumber: 820422556 Main Chart: Current
FREE

This indicator shows the breakeven line level for the total number of open positions of the current symbol with P/L value and total volume. This indicator is helpful to decide the exit level when using a trading grid strategy. The style of the breakeven line is customizable to choose the color, line shape and font size of the positions description. Send mobile notification when crossing a positive P/L target
FREE

Introduction
The RSI Plus is an innovative technical analysis tool designed to measure the strength and direction of the market trend. Unlike the traditional RSI indicator, the RSI Plus boasts a distinctive ability to adapt and respond to market volatility, while still minimizing the effects of minor, short-term market fluctuations.
Signal
Buy when the RSI plus has been in the oversold (red) zone some time and it crosses above the 20 level on previous candle close
Sell when the RSI
FREE

OHLC マグネットは、水平線、長方形、価格ラベルに欠落しているマグネットポイントを追加します。 あなたはこのユーティリティが好きなら、とコメントを評価してください。
指示:
前述のオブジェクトの1つを、ピクセルの近接範囲内の目的の始値、高値、安値、または終値にドラッグするだけで、選択した正確な価格ポイントにオブジェクトが自動的にアタッチされます。
パラメーター:
近接 (ピクセル): その特定の価格ポイントに接続するためのユーティリティの始値/高値/安値/終値をマウスカーソルがどの程度閉じるかをピクセル単位で指定します。デフォルトは10です。 価格ラベルを自動調整する: 価格ラベルを左側 (左の価格ラベルの場合) または右 (価格ラベルの場合) に自動的に調整します。既定値は有効です。
FREE

Genaral: Not martingale, not a grid; Use on EURUSD Use on M5
Signals: There is a good rational algorithm. Work of two indicators: Chaikin and DeMarker (from 2 timeframes) (you can set a separate Timeframe for each indicator)
Stop Loss/Take Profit: There is a good money management system (there are several type for trailing stop loss); There is virtual levels of Stop Loss / Take Profit; There is smart lot (percent by risk) or fix lot
Important: EA can work on closed candles, and on c
FREE

Investment Castle Support and Resistance Indicator has the following features: 1. Dictates the direction of Buy or Sell trades based on Support and Resistance Levels automatically . 2. Candles stick colors will change to Red for Sell and Blue for Buy (Default settings, user can change from the inputs). 3. This indicator is built-in the Support & Resistance based Investment Castle EA which works with Psychological Key Levels "Support & Resistance".
FREE

Get it FREE while you can! Will be increased to $200 very shortly after a few downloads!!
Join my Discord and Telegram Channel - Max's Strategy For any assistance and help please send me a message here. https://t.me/Maxs_Strategy https://discord.gg/yysxRUJT  ;
GBPUSD and EURUSD Set files can be found in the comments! (please message me if you need help with them) TimeFrames are harcoded, therefore any chart and time will work the same.
The Max Poseidon Strategy is a part of a cross
FREE

Break Even Line by MMD
The Break Even line is a useful indicator for people using strategies that allow simultaneous trades in both directions, such as the MMD methodology. This indicator is useful when playing statistical models and averaging positions in accumulation and distribution zones. The indicator draws levels by summing positions in three groups: positions included in BUY, positions included in SELL and all positions included.
Functionality description:
Show BUY BELine - shows
FREE

This is a smooth and responsive accelerometer which reveals the market trend and strength. [ Installation Guide | Update Guide | Troubleshooting | FAQ | All Products ]
Two moving averages indicate trend direction The histogram represents strength of the price movement It draws buy and sell zones as colored vertical lines Should be used as a confirmation indicator Customizable line widths and colors It implements alerts of all kinds This indicator is similar to MACD but aims to react faster t
FREE

This is a buyer and seller aggression indicator that analyzes the shape of each candle and project this data in a histogram form. There are 4 histograms in one. On the front we have two: Upper - Buyer force. Lower - Seller force. At the background we also have two histogram, both with same color. They measure the combined strenght of buyers and sellers. This histograms can be turned off in Input Parameters. It is also possible to have the real or tick volume to help on this force measurement. IN
FREE
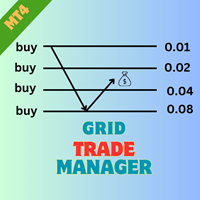
Product Name: Grid Trade Manager MT5 Description: The Grid Trade Manager EA for MetaTrader 5 is meticulously crafted to oversee trades employing a grid trading strategy. It strategically places a sequence of pending buy and sell orders at predefined intervals, forming a grid pattern. This EA vigilantly monitors market fluctuations, dynamically adjusting the grid to optimize potential profits. Additionally, it incorporates robust risk management features to control grid size and curtail potential
FREE

Volume Weighted Average Price (VWAP) is a trading benchmark commonly used by Big Players that gives the average price a Symbol has traded throughout the day. It is based on both Volume and price. Additionally we put in this indicator the MVWAP (Moving Volume Weighted Average Price). For those who do not know the usage and the importance od this indicator I recommend a great article about this subject at Investopedia ( https://www.investopedia.com/articles/trading/11/trading-with-vwap-mvwap.asp )
FREE
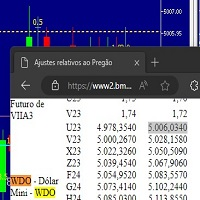
Este script marca no gráfico do ativo MINDOL da activ trades o ponto de ajuste do contrato futuro do Mini Dolar (WDO),
***ATENÇÃO*** para este script funcionar é necessário autorizar a URL da BMF Bovespa no Meta Trader. passo a passo: MetaTrader 5 -> Ferramentas -> Opções -> Expert Adivisors * Marque a opção "Relacione no quadro abaixo as URL que deseja permitir a função WebRequest" e no quadro abaixo adicione a URL: https://www2.bmf.com.br/ este indicador usa a seguinte página para buscar o
FREE

The selective pin bar is designed to identify reversals. To use the selective pin bar effectively, traders typically look for Strong Rejection: The tail of the pin bar should extend significantly beyond the surrounding price action. It indicates that there was a sharp rejection of higher or lower prices during the trading period. A strong rejection suggests that the market sentiment may be changing.
FREE

El indicador técnico Trend Magic es una herramienta de análisis de tendencias que combina el Índice de Canal de Mercancía (CCI) y el Rango Verdadero Medio (ATR) para identificar la dirección de la tendencia del mercado. Aquí tienes un resumen de sus pros y contras, así como las mejores condiciones del mercado para su uso:
Pros: - Identificación clara de la tendencia: Cambia de color para indicar tendencias alcistas (azul) y bajistas (rojo), lo que facilita la visualización de la dirección del
FREE

It makes it easier to see where there have been consolidation zones for previous prices and allows you to highlight the histogram where there is the biggest consolidation zone.
Input parameters Intervalo de preço Is the price between the histograms
Periodo Number of candle sticks to be analyzed
Porcentagem Highlights the histogram where there is minimal consolidation in relation to the analyzed period
FREE

Axilgo Pip Piper CoPilot Elevate your trading game with the Axilgo Pip Piper CoPilot, the first in our revolutionary Pip Piper Series. This all-inclusive toolset is meticulously crafted for serious traders, focusing on key areas such as Risk Management, Trade Management, Prop Firm Rule Compliance, and Advanced Account Management . With CoPilot, you’re not just investing in a tool—you’re gaining a strategic partner in the intricate world of trading. Important Notice: To ensure you receive the fu
FREE

The "Standardize" indicator is a technical analysis tool designed to standardize and smooth price or volume data to highlight significant patterns and reduce market noise, making it easier to interpret and analyze.
Description & Functionality: Standardization : The indicator standardizes price or volume values by subtracting the mean and dividing by the standard deviation. This converts the data into a distribution with zero mean and standard deviation of one, allowing different data sets
FREE

Very simple, yet powerful, indicator that helps you get notified every time a candle touches your trend line, horizontal line, and/or your rectangular. Powerful indicator yet very simple to use! All you need to do is draw your MT5 trend lines, horizontal lines, and/or rectangles and SmartLine takes care of notifying you the moment the current price touches one of your key levels! No brainer If you like the indicator, please leave a review and share the tool with your peers. WARNING: Please use t
FREE

This tool is useful for indicating resistance and support levels It bases on zone in setting to identify top/bottom of candles and and draw rectangle according to those resistance/support level Beside user can edit the zone via dialog on specific timeframe and that value will be saved and loaded automatically. User can determine what strong resistance and support and make the order reasonably.
FREE

Что показывает на графике индикатор TrendBreak? 1 — рисует линию тренда до максимальных максимумов в 100 баров. 2 — рисует линию тренда до максимальных максимумов в 30 баров. 3 — рисует линию тренда до максимальных минимумов в 100 баров. 4 — рисует линию тренда до максимальных минимумов в 30 баров. И эти линии указывают на сжатие тренда. Также индикатор выбирает 100-й бар и рисует ровную линию к максимуму и минимуму.
FREE
The RMI Scalper EA is a fully automated Expert Advisor that trades pullbacks from the major trend using RMI and limited averaging. The EA trades using market orders and uses averaging to safely turn otherwise negative trades positive. This EA works best on USDJPY, EURUSD, GBPUSD, USDCAD, USDCHF, AUDJPY, EURCAD, EURGBP and EURJPY using the M30 timeframe and has the option to trade multiple pairs but only one pair at any one time to increase trade frequency without increasing draw down.
Please no
FREE

Hi All ! I want to share with you my favorite indicator to identify strong trend bias. It helps me a lot with my entries and exits. You can use it on any market and any instrument. It works best on daily tiimeframe 1D but you can also use it on 1H and be carefull with lower timeframes This indicator uses MACD, RSI and Stoch. The idea is simple, when MACD crosses above a Signal line and RSI > 50 and Stoch > 50 we consider the trend is going UP on the opposite we consider its DOWN Feel free to us
FREE

This indicator is especially for the binary trading. Time frame is 1 minutes and exp time 5 or 3 minutes only. You must be use martingale 3 step. So you must put lots size is 10 % at most. You should use Mt2 trading platform to connect with my indicator to get more signal without human working. This indicator wining rate is over 80% but you may get 100% of profit by using martingale 3 step. You should use MT2 Trading Platform to connect meta trader platform and binary platform . You can get mt2
FREE

The Forex Breakout Scalping EA follows a scalping breakout strategy. It trades the breakouts from relative highs and lows. For the entry stop orders are used for the fastest possible execution. Profits can be secured by the adjustable trailing stop .This is also a high frequency breakout trading system. It produces high return if compounded properly with high speen internet and low commission. Since the strategy works with small average profits it is highly suggested to trade with a low spread a
FREE

A heatmap is a graphical representation of data in two dimensions, using colors to display different factors. Heatmaps are a helpful visual aid for viewers, enabling the quick dissemination of statistical or data-driven information. The MP Heatmap indicator provides a graphical representation of the relative strengths of major currencies compared to others, organizing data from pairs into color-coded results and producing a clear overview of the entire Forex market. The MP Heatmap indicator dis
FREE

The "SyntheticaFX Power Indicator" is an exceptional trading tool designed to offer valuable insights into market strength and potential changes, without revealing its proprietary methodology. This powerful indicator is ideally utilized in conjunction with our specialized tools, the " SyntheticaFX CrashSlayer and " BoomSlayer " Spike Indicators, to provide traders and investors with a comprehensive and dynamic trading experience. When employed alongside our SyntheticaFX CrashSlayer and BoomSlaye
FREE

This MT5 chart trend checker cuts through the noise of market volatility to provide a clearer picture of trends and price movements. It includes the following features that can provide more clarity during market assessments: 1 customizable multi-period moving average Optional Heikin-Ashi candles 3 switchable focus modes Distinct colors for easy analysis
Link to MT4 version: https://www.mql5.com/en/market/product/106708/
This indicator shows your preferred moving average from multiple time fr
FREE

Convenient drawing of parabolic channels by four points (two lower and two upper extremums). Additional control keys: N (New) - Start drawing a new channel. C (Clear) - Deletes the current channel. By default, the current channel is the last channel. But you can click on the line of any channel to make it current. Click on the gear in the upper right corner to set some parameters for all channels or the current channel. All work is visible from the animated Gif.
Do not forget to express your
FREE

XAUUSD H1 OR H4 low risk with high profit Backtest with 100% data 1000$ required If you have any question. After Purchase message me The "Highest-Lowest Trend" indicator helps traders identify trends based on the highest and lowest values within a specified period . It provides visual cues to understand potential trend changes, making it a valuable tool for technical analysis.
https://www.mql5.com/en/code/2030
FREE
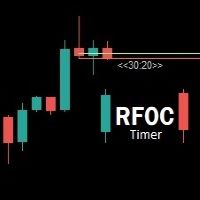
Uma informação de grande valor para o trader se localizar no tempo é a informação de quanto tempo temos para o encerramento do candle atual ou quanto falta para a formação de um novo candle. O RFOC Timer apresenta esta informação de forma clara e alocada à direita do candle atual. Adicionalmente o RFOC Timer acompanha a opção de inclusão das linhas de preços ASK e BID com e sem extensão a direita e/ou esquerda. Esta função auxilia, por exemplo, a não sobreposição das linhas de ASK e BID com as
FREE

This indicator accurately identifies and informs market reversals and continuation patterns by analyzing and signaling the Three White Soldiers / Three Black Crows pattern. User-friendly interface and multi-asset compatibility Fully customizable parameters and colors Does not repaint Can be easily convert its signals into an Expert Advisor. Full support granted.
FOR MT5 FULL VERSION: CLICK HERE
What is the Three White Soldiers / Three Black Crows price action pattern The Three White Soldi
FREE

O indicador Supertrendingsignal imprime um sinal na tela indicando início de uma forte tendência. O sinal não mostra o ponto de entrada com melhor risco retorno, apenas faz a indicação de uma forte tendência. Foi idealizado a partir de um conjunto de médias móveis e volume. Parametros: Periodmalongo: Períodos da média longa Periodmamedio: Períodos da segunda media Periodmamedio2: Perídos da terceira media Periodmacurto: Períodos da média curta. PeriodATR: Períodos do indicador ATR para adequar
FREE
SmartSetup Bot Is an advanced trading tool that combines the flexibility of manual configurations with the power of semi-automated features. It automatically generates graphical objects, displaying critical zones such as support and resistance levels, stop loss and take profit areas, and other essential indicators. SmartSetup Bot provides clear and precise visualization of your trading parameters, facilitating informed decision-making. This bot is designed for traders who value manual control bu
FREE

Santa Trend Indicator is an efficient way to forecast and detect the trend in any market. Advantages Generates instant buy and sell signals. Provides an alternate exit strategy to your existing trading system. Never repaints, never backpaints, never recalculates. Works in all symbols and all timeframes. Perfect trend filter for any strategy or expert advisor. Fully compatible with Expert Advisor (EA) development. Does not lag.
FREE

HighDaily
このエキスパートアドバイザーは、HighDaily、ATR、および保留注文に基づいて、EURUSD H1向けに開発されました。20年以上のティックデータを使用して99%のモデリング品質でバックテストされました。添付されたスクリーンショットは、モンテカルロ分析による1000回のシミュレーションでの堅牢性テストを示しています。より良いパフォーマンスのためにスプレッドとスリッページの少ないブローカーをお勧めします。パラメーターを設定する必要はありません、これらの設定は最適化されています。 大口口座を使用する必要はありません。私は200米ドルから0.01ロットで取引することをお勧めします。
モンテカルロテスト
1000回のシミュレーション ティックデータを30%の確率でランダム化し、最大価格変動ATRを10%上下にランダム化 スプレッドを0から3にランダム化 戦略パラメーターを20%の確率でランダム化し、最大変更10%
テストのワークフロー
IS/OOSテスト、テスト期間を10部分に分割します。 異なる時間枠(30M)でのテスト。 最近性のテスト。 モンテカ
FREE
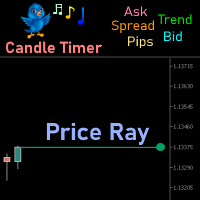
Price Ray indicator is a utility that will improve the way you trade. Primarily, it shows the Bid, Ask or Last price as a line ray which beams till the current candle, last visible chart candle or extended to all candle bars. The enhanced features in this indicator provide information in an area where you focus most, right next to the current candle. You can select text to be shown above or below the Price ray. The indicator is fully customizable, allowing it to fit any strategy requirements. Th
FREE

US 30 BOT This is a simple quantitative model that trades US30 Index from NASDAQ top 30 American stocks It uses volatility contraction and expansion as a basic theory. Place it on US30 chart ,any timeframe. Hedged accounts are advised. NB: Standard accounts are preferred and well regulated brokers eg ICMarkets are advised to avoid unnecessary losses eg slippage ones,commissions and large spreads. Minimum account balance ADVISED : USD 100 HOW TO USE: A VPS is highly recommended. AWS offers 1 y
FREE

XE Forex Strengh Indicator MT5 displays visual information about direction and strength of a signal for current pair and chosen timeframes (M5, M15, M30 and H1). Calculations are based on multiple factors and results are shown as a colored panel with scale bar, numerical values and arrows. There are also displayed values of current price and spread on the pair. There can be activated an alert (as a mail or pop-up window with sound) for each available timeframes which send a message when the dir
FREE

Pivot Points are used by Forex traders to find support and resistance levels based on the previous day's price action. There are various ways to calculate pivot points, including averaging the open, high, low, and close of the previous day's chart price.
Forex Traders use a combination of pivot points with moving averages to find trading opportunities in the currency markets.
Pivot points are very useful tools that use the previous bars' highs, lows and closings to project support and re
FREE

Reward Multiplier is a semi-automatic trade manager based on pyramid trading that opens additional orders with the running profit of your trades to maximize return exponentially without increasing the risk.Unlike other similar EAs, this tool shows potential profit/loss and reward to risk ratio before even entering the first trade! Download full version here ( In the mini version. Starting lot is fixed at 0.01 (or minimum allowed lot size ) Guide + tips here MT4 version here You only open the
FREE

Indicator that uses ATR and standard deviation to calculate the current trend. It has the top and bottom line. The top line is shown when it is high, and the bottom line when it is low. The indicator does not draw a trend line or show the trend for the day, or for a certain period. It has the function of indicating the current trend, and may indicate a reversal.
use it with caution and at your own risk.
FREE

The HammerStar indicator is designed to search for the Hammer and Shooting Star patterns on charts of any currency pairs.
Hammer Downward trend.
The lower shadow is not less than 2 and no more than 3 times larger than the body.
There is no upper shadow, or it is very short (no more than 10% of the candlestick range).
The color of the body in the long game is not important, with the short - white hammer is much stronger than the black one.
Confirmation is suggested.
Shooting Star Uptrend.
FREE
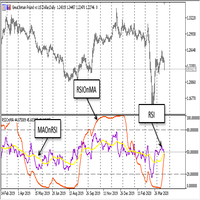
The EA trades on two indicators iMA (Moving Average, MA) and one iRSI (Relative Strength Index, RSI). Decision on trade signals is only made when a new bar appears, while positions are trailed and closed (in case of profit) at every tick. An unconventional solution was applied: The Slow indicator averaging period is calculated as the Fast averaging period multiplied by two, while the RSI averaging period is always equal to the Fast averaging period. This reduces the number of par
FREE

KMeans Price Zones Detector を使ったトレーディングの未来へようこそ。これは、機械学習の力を利用して主要な価格ゾーンを特定する革新的なMetaTrader指標です。このツールは、価格データ内の重心を動的に検出するためにKMeansクラスタリングアルゴリズムを利用し、価格がサポート、レジスタンス、または統合に遭遇しやすいエリアを強調します。 革新的なKMeansアルゴリズム KMeans Price Zones Detectorは、パターン認識においてその効率と精度で知られる機械学習の基本であるKMeansクラスタリングアルゴリズムを高度に活用することで際立っています。過去の価格データを分析することで、この指標は重要な価格レベルを表すクラスタまたは重心を識別します。これらの重心を使用してサポートとレジスタンスゾーンを計算し、トレーダーに価格の反転、ブレイクアウト、および統合の可能性に関する重要な情報を提供します。 主な特徴 動的ゾーン検出: 指標は最新の市場データに基づいて価格ゾーンを継続的に更新し、トレーダーが常に最も関連性の高い情報を持つことを保証します。
FREE

The utility draws pivot levels based on a selection from day week month The previous candlestick of the selected timeframe is taken and the values for the levels are calculated using the following formulas:
Pivot = (high + close + low) / 3 R1 = ( 2 * Pivot) - low S1 = ( 2 * Pivot) - high R2 = Pivot + (R1 -S1) R3 = high + ( 2 * (Pivot - low)) S2 = Pivot - (R1 - S1) S3 = low - ( 2 * (high - Pivot));
The style and thickness for all lines are adjusted.
The colors for the R, Pivot and S line
FREE

チャート上に超簡単に線を引いたり、移動したりできるツールです。
クリックしてから、ドラッグするとトレンドラインが引けます。 横に引くと価格線、縦に引くと日付線になります。 そこにある線やオブジェクトで、クリック&ドラッグすると移動できます。
クリックしたところから、ドラッグしたところに交差線が引かれ、間の時間と価格の差が表示されます。
クリック&ドラッグしたら、左右に振ると色が変わります。 クリック&ドラッグしたら、上下に振ると削除します。
クリック&ドラッグとは? 1.マウスの左ボタンを押す(カ) 2.マウスの左ボタンを放す(チ) 3.マウスの左ボタンを押す(カ) 4.左ボタンを押したまま、マウスを移動する(ツー)
この動きをすることでトレンドラインを引いたり、オブジェクトを移動したり、色を変えたり、消したりできます。
トレンドライン、価格ライン、日付ラインだけでなく、矢印や価格表示、フィボナッチ、ギャンライン、サイクルライン、図形なども移動させることができます。
他にも便利なところ
・うっかり線を引いてしまったら、チャート外でマウスボタンを離せ
FREE

The "Dagangduit Spread Indicator" is a versatile tool designed to provide traders with essential information about the current spread in the chart window. This indicator offers customizable features, including font parameters, display location on the chart, spread normalization, and alerts to enhance your trading experience. Key Features: Real-time Spread Display : The indicator displays the current spread in real-time on your trading chart, allowing you to stay informed about the cost of execut
FREE

VWAP RSJ is an indicator that plots the Hourly, Daily, Weekly and Monthly VWAP Lines.
Large institutional buyers and mutual funds use the VWAP ratio to help move into or out of stocks with as small of a market impact as possible. Therefore, when possible, institutions will try to buy below the VWAP, or sell above it. This way their actions push the price back toward the average, instead of away from it. Based on this information I developed this indicator that combines 4 types of VWAP T
FREE

XAUUSD USDJPY GPBUSD M1 HEDGE リアルアカウントのモニタリング **Analytico - MQL5での自動取引の新たな味方! ** 市場で最適な機会を特定するだけでなく、他のどのツールよりも適応し、資本を保護する取引アシスタントを想像したことがありますか?それがAnalyticoです。このEAは、取引体験を向上させます。
**成功の3つの柱:方向、取引量、速度** Analyticoは何も運任せにしません。市場の方向、取引量、価格の動きの速度を基に動作します。これらの柱により、エントリーが正確でタイムリーに行われ、成功の機会が最大限に高まります。
**マーチンゲールのないポジションリカバリーシステム** 市場は予測不可能であることを理解しています。ポジションが逆に動いた場合、Analyticoはマーチンゲールを使用せず、損失を減少させ、コントロールを回復するスマートなアプローチを採用してリカバリーシステムに介入します。
**ドローダウンのコントロールと資本の保護** 最優先事項は資本の保護です。A
FREE
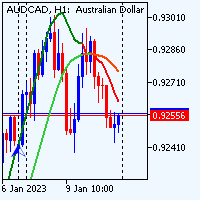
Test Before Use... In the forex market, a range refers to a period of time during which the price of a currency pair remains relatively stable, fluctuating within a narrow band. This can be contrasted with a trend, which refers to a sustained movement in the price of a currency pair in a particular direction. During a range, the price of the currency pair may move up and down within a defined range, but it is not trending strongly in any particular direction. This can be a good time for the rang
FREE
The Indicator tendency trader EA can trade with 12 top indicators. The following indicators are integrated: 1 Adaptive Moving Average 2 Average Directional Movement Index 3 Bollinger Bands 4 Double Exponential Moving Average 5 Envelopes 6 Fractal Adaptive Moving Average 7 Ichimoku Kinko Hyo 8 Moving Average 9 Parabolic SAR 10 Standard Deviation 11 Triple Exponential Moving Average 12 Variable Index Dynamic Average. All standard indicators trade with simple strategies that are understandable for
FREE

Candle High Low
Indicator showing High and Low of X candles across a line.
Settings Candle number for calculation (>= 1 ) - Define the number of candles for the indicator to find the maximum and minimum of that period of candles. Continuation of the line's display to the right - If you want the High and Low line to extend to the right edge of the graph Line High Color - Set line color Line High Style - Set line style Line Low Color - Set line color Line Low Style - Set line style
FREE

The indicator measures the frequency of incoming ticks to analyze the market activity. Bullish and bearish ticks are analyzed separately, informing about the currently predominant market sentiment. According to observations, an increase in the frequency of ticks (panic) indicates the beginning of strong price changes, and an increase in the frequency of ticks in a particular direction not only accompanies a price change in this direction, but also often anticipates it. The indicator is indispens
FREE

Description : Enhance Your Trading Strategy with the Advanced Vortex Indicator for MT5! Discover the power of the Vortex Indicator (VI), a robust technical analysis tool now available for MetaTrader 5. This custom-built indicator is designed to help traders identify trends and reversals, offering a critical edge in the dynamic Forex market. Key Features: Dynamic Trend Identification : With the VI's unique calculations of VI+ (positive) and VI- (negative) lines, you can easily spot trend strength
FREE

Introducing the Scalping Expert Advisor (EA) for Short Trades This Expert Advisor (EA) is meticulously designed for short trades scalping, offering a blend of precision and efficiency to maximize your trading performance. Below, we delve into the key functions and features that make this EA an essential tool for scalpers.
Key Features: Automatic Take Profit (TP) and Stop Loss (SL) Settings: Take Profit Input: Allows you to set a specific TP value, enabling precise control over your exit point
FREE

The indicator represents the session boxes for the Asian, European and American sessions. It is possible to change the time of each session, such as color. It is also possible to disable the display of each session. You will find in input parameters variables to modify in format hh:mm. In Colors tab you can change the color of boxes of each sessions. If you need some implementations please contact me.
FREE
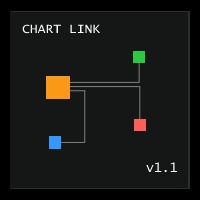
Chart Link allows you to control multiple charts from one chart or multiple charts from multiple charts. Features 1. Synchronised Scrolling : Scrolling the master chart also scrolls all linked sub charts to the same position. Sub charts inherit offset and auto-scroll settings from the master chart. 2. Synchronised Timeframe : Switching the master chart timeframe also switches all linked sub charts. 3. Synchronised Symbol : Switching the master chart symbol also switches all
FREE

モメンタムリバーサルは、価格の動きとバーの形成の強さの分析に基づいて、可能な逆転ポイントと修正の開始を検出するための強力なツールです。
_________________________________
インジケータ信号の使用方法:
この指標は、新しい価格バーが表示された後に信号を生成します。 価格が指定された方向の臨界点を突破した後、生成された信号を使用することをお勧めします。 インジケーターは信号を再描画しません。
_________________________________
インジケータパラメータは、信号の矢印の表示スタイルを変更することを示唆しています。 計算に使用されるパラメータを変更することは提供されていません-これは私の製品の哲学によるものです:安定性と客観性。
_________________________________
ご質問やご提案のいずれかが歓迎されており、プライベートメッセージで送信することができます
_________________________________
興味のあるすべての人に事前に感謝し、市場を征
FREE

Bollinger Bands % or Bollinger Bands Percentage is one of the indicators used in the Sapphire Strat Maker - EA Builder .
It is calculated using the following formula:
Perc = (CLOSE_PRICE - LOWER_BOLLINGER) / (UPPER_BOLLINGER - LOWER_BOLLINGER) * 100
Thus, by taking the difference between closing price to the lower band and dividing it by the difference of the upper and the lower price levels of a Bollinger Bands indicator, we can calculate this indicator.
It shows how far the price is f
FREE

IDixie is an indicator which shows open and close values of the American dollar index, DXY or "Dixie". The indicator is calculated from weighted values of 6 major symbols: EURUSD, USDJPY, GBPUSD, USDCAD, USDSEK, and USDCHF. In addition to "Dixie" values, the indicator also shows a moving average. You can set the period of the moving average. When bars of the indicator break through the moving average, this creates good opportunities to enter the market. As a rule, signals from this indicator are
FREE

This version is a basic iteration, click the link below to access the full version: https://www.mql5.com/en/market/product/110060 "ICT, short for Inner Cycle Trade, revolutionizes your Forex trading experience by focusing on the intricacies of inner market dynamics. Built upon the principle of understanding and capitalizing on short-term market fluctuations, ICT utilizes advanced AI algorithms to provide traders with real-time insights into emerging opportunities within the Forex market. By com
FREE

Description :
Combination MT5 is a professional indicator based on the Stochastic Oscillator and Average True Range (ATR) technical indicators, thus, you can use it with any currency pair and any timeframe.Trade signals from Combination MT5 are drawn on the main chart in the form of arrows. When a blue arrow appears, then this is a signal to buy, when the red one appears then this is a signal to sell. You can set the alerts on/off. The Stochastic Oscillator and Average True Range (ATR) technic
FREE

VolumeFlow is a Volume Accumulation / Distribution tracking indicator. It works in a similar way to OBV, but it is much more refined and includes the options to use: Classical Approach = OBV; Useful Volume Approach; Gail Mercer's approach; Input Parameters: Input Parameters: Approach Type: Explained above; Volume Type: Real or Ticks; Recommendations: Remember: The TOPs or BOTTONS left by the indicator are good Trade Location points. This is because the players who were "stuck" in these regions w
FREE

EA Pivot SR is a free version of a fully automatic Expert Advisor for MT5. There are no sewn-in deals, as is the case with most fraudulent advisors. Transactions in the tester and in real trading will correspond exactly to 99.99%.
The strategy of the Expert Advisor is based on trading from levels, which is the most acceptable solution than focusing on indicators that are usually late and give signals several bars late.
Support and resistance levels are calculated using the Pivot Point syste
FREE
MetaTraderマーケットはMetaTraderプラットフォームのためのアプリを購入するための便利で安全な場所を提供します。エキスパートアドバイザーとインディケータをストラテジーテスターの中でテストするためにターミナルから無料のデモバージョンをダウンロードしてください。
パフォーマンスをモニターするためにいろいろなモードでアプリをテストし、MQL5.community支払いシステムを使ってお望みのプロダクトの支払いをしてください。
取引の機会を逃しています。
- 無料取引アプリ
- 8千を超えるシグナルをコピー
- 金融ニュースで金融マーケットを探索
新規登録
ログイン