YouTubeにあるマーケットチュートリアルビデオをご覧ください
ロボットや指標を購入する
仮想ホスティングで
EAを実行
EAを実行
ロボットや指標を購入前にテストする
マーケットで収入を得る
販売のためにプロダクトをプレゼンテーションする方法
MetaTrader 5のための無料のエキスパートアドバイザーとインディケータ - 6
Overview:
Recommend Broker exness. TBH, As it is a free script, Please register using this url. So I can get some referral benefit, it motivates me and will keep continue supporting this and any future Expert Advisor.
https://one.exnesstrack.net/a/7lex5q7rkt Introducing the VWAMP Buster Expert Advisor, a sophisticated trading algorithm designed for MetaTrader 5. Harnessing the power of the Volume Weighted Average Price (VWAP), Bollinger Bands, and ATR (Average True Range), VWAMP Bus
FREE

The Hull Moving Average is not very well know in novice and maybe in intermediate trading circles, but it is a very nice solution created by the trader Alan Hull - please visit www.AlanHull.com for full details of his creation. The purpose of this moving average is to solve both problems that all famouse and common moving averages have: Lag and Choppiness . The implementation we did has, apart of the Period configuration and Price type to use in the calculations, a "velocity" factor, which could
FREE

The indicator displays volume profiles based on the nesting principle. Profiles periods are pre-set so that each subsequent profile has a length twice as long as the length of the previous profile. In addition to profiles, the indicator displays volume clusters sorted by color, depending on the volume they contain.
Indicator operation features The indicator works on typical timeframes from M5 to MN, but for calculations uses historical data from smaller timeframes: M1 - for timeframes from M5
FREE
Darvas Flow is a revolutionary trading indicator that combines the classic Darvas Box method with modern market flow analysis. Developed for serious traders, Darvas Flow offers a powerful and intuitive tool for identifying trading opportunities. This indicator has been through backtesting on the XAUUSD M30 pair for 6.5 years. If you are interested, please visit this EA product : https://www.mql5.com/en/market/product/121320
Key Features: Darvas Box Method Implementation : Darvas Flow au
FREE

Trading Keys is an advanced and easy to use risk calclator. Features: Drag and drop visual lines to take profit/stop loss/ entry levels. Risk calculation based on account balance / quity percentage per trade. Profit protection and trailing toggle button Auto break even toggle button Risk calculation for prop firms based on drawdown level How to setup your Trading Keys? Add trading keys to your chart Setup the parameters Save the chart as default template "Default.tpl" How to use Trading keys? Cl
FREE

MACDは類似性と差異の移動平均と呼ばれ、二重指数移動平均から作成されます。高速指数移動平均(EMA12)を低速指数移動平均(EMA26)から差し引いて、高速DIFを取得し、次に2× (Express DIF-DIFの9日間の加重移動平均DEA)MACDバーを取得します。 MACDの意味は、基本的に二重移動平均と同じです。つまり、高速移動平均と低速移動平均の分散と集約は、現在のロングショートステータスと株価の開発傾向の可能性を特徴づけますが、読む方が便利です。 MACDの変化は市場動向の変化を表し、さまざまなKラインレベルのMACDは、現在のレベルサイクルにおける売買傾向を表します。
1.このインジケーターは、MACDの2行表示を追加します。 2.そしてエネルギーカラムに4つの異なる勾配を適用します! トレンドインジケーター、 波動標準の自動計算 、 MT5バージョンの波動標準の自動計算を強くお勧めします
Necessary for traders: tools and indicators Waves automatically calculate indicators
FREE

CAP Ichimoku EA MT5 trades using the Ichimoku Kinko Hyo Indicator. It offers many customizable Ichimoku trading scenarios and flexible position management settings, plus many useful features like customizable trading sessions, a martingale and inverse martingale mode. [ Installation Guide | Update Guide | Submit Your Problem | All Products ]
Functions Easy to use and customizable Ichimoku setting. Customizable indicator settings Built-in money management Grid trading when trade in Los
FREE
This EA is a flexible and powerful metatrader expert advisor that trades using the MACD indicator and implements many useful features. It can trade using the MACD indicator alone, or donchian breakouts confirmed by the MACD indicator from any timeframe. Additionally, it offers a martingale feature and forex session filters. [ Installation Guide | Update Guide | Troubleshooting | FAQ | All Products ] Easy to use and supervise Fully configurable settings Customizable break-even, SL, TP and traili
FREE

The strategy is based on price crossover with Moving Average indicator, confirmed by ADX indicator. The trade signals: Buy: closing price of the last completed bar is higher than moving average, the moving average increases at the current and last completed bars. Sell: closing price of the last completed bar is lower than moving average, the moving average decreases at the current and last completed bars. To filter the false signal, it checks the trend power (ADX>ADXmin) and trend direction usin
FREE

MT5のチャートシンボルチェンジャーは、パネルのシンボルボタンをクリックするだけでアタッチされている現在のチャートシンボルを変更するオプションを提供するインジケーター/ユーティリティです。 MT5のチャートシンボルチェンジャーは、あなたが注目して最もトレードしたいペアを追加することにより、あなたの個人的な好みに合わせて32のシンボルボタンを設定するオプションを提供します。このようにすると、数回クリックするだけでチャート上で市場をより速く表示できるため、チャンスを逃すことはありません。
MT5インストール/ユーザーガイド用チャートシンボルチェンジャー | 購入した製品の更新
特徴 パネル上の32のカスタマイズ可能なシンボル。これにより、同じチャートでお気に入りの機器を監視できます。 あらゆるシンボル/金融商品、口座タイプ、ブローカーでスムーズに機能します
MT5のチャートシンボルチェンジャーは、トレードとリスク管理、および一般的な手動トレードを支援するために、トレードパネルの形式でも提供されます。 手動トレードパネルMT5: https
FREE

Introduction This indicator detects volume spread patterns for buy and sell opportunity. The patterns include demand and supply patterns. You might use each pattern for trading. However, these patterns are best used to detect the demand zone (=accumulation area) and supply zone (=distribution area). Demand pattern indicates generally potential buying opportunity. Supply pattern indicates generally potential selling opportunity. These are the underlying patterns rather than direct price action. T
FREE

強力なNRTR(Nick Rypock Trailing Reverse)インディケーターをご紹介します。トレンドの反転を特定し、効果的なトレーリングストップレベルを設定することを目指すトレーダーにとって必須のテクニカルツールです。ニック・ライポックによって開発されたこのインディケーターは、常に変化する市場条件に適応する独自のアルゴリズムを採用しており、どんなトレーダーのツールキットにも欠かせない存在となっています。
以下は、トレーダーがこのインディケーターを使用する人気のある方法です:
1. トレンドの反転:NRTRインディケーターは、トレンドが反転する予兆があるときに明確なシグナルを生成します。インディケーターラインが価格チャートを交差することに注意し、トレンドの方向が変わる可能性を示します。
2. トレーリングストップ:NRTRは、トレンド市場で利益を保護する頼りになるトレーリングストップツールとしても機能します。価格が望む方向に動くと、NRTRラインが価格の下または上に動的に追随し、適応可能なストップロスレベルを提供します。
カスタマイズ可能なパラメータ:NR
FREE

This indicator analyzes price action patterns and helps you to make positive equity decisions in the binary options market. [ Installation Guide | Update Guide | Troubleshooting | FAQ | All Products ] Easy to trade Trade both call and put options No crystal ball and no predictions The indicator is non-repainting The only strategy suitable for binary options is applying a mathematical approach, like professional gamblers do. It is based on the following principles: Every binary option represents
FREE

トレンドが勃発しているときにアラートを取得します。 この指標は、価格が支配的な傾向の方向に大きな動きをするときに信号を送ります。 これらの信号は、エントリポイント、またはトレンド内の既存の位置に追加するポイントとして機能することができます。
注:以下の傾向は、低い勝率(50パーセント未満)を持っていますが、平均勝利貿易のリターンは、通常、平均負け貿易よりも3-5倍大きいです。
簡単なセットアップ 任意の時間枠で、任意のグラフにドラッグアンドドロップします。 アラートを有効にする(オプション) そして、あなたは完了です! 視覚的および音声的な警告 お使いの携帯電話に直接送信されるアラート お使いの端末に送信されたアラートをポップアッ マルチユース 株,外国為替,オプション,先物 柔軟性 任意の時間枠で動作します
FREE

2016年(05月)のICTのプライベートメンターシップコース(YouTubeで共有)からインスピレーションを受け、当社の革新的なツールは、トレーダーが市場を精密に航行することを可能にします。 60、40、20日の期間をマークすることで、市場の重要な動きを特定し、ICTの教えから得られた知識を活用します。 このインジケーターの真の特徴は、将来の市場動向に関する貴重な洞察を提供する前方キャスティング機能であり、これは入念な歴史データの分析に基づいています。 この先行的なアプローチにより、トレーダーは情報を元にした決定を行うための洞察力を備え、今日のダイナミックなトレーディング環境で明確な優位性を提供します。 さらに、当社のインジケーターはカスタマイズオプションを提供し、トレーダーがそれを自分の好みや特定のトレーディング戦略に合わせて調整できるようにします。 このレベルの適応性により、トレーダーは自信を持って市場のトレンドを予測し、ICTの教えを活用して先を見据え、利益を生む機会を活かすことができます。 当社のインジケーターで予測とカスタマイズの力を体験し、トレーディングスキルを向上させ、
FREE

This indicator identifies and highlights market inefficiencies, known as Fair Value Gaps (FVG), on price charts. Using a custom algorithm, the indicator detects these areas of imbalance where the price moves sharply, creating potential trading opportunities. Indicator Parameters: Bullish FVG Color (clrBlue) : Color used to highlight bullish inefficiencies. The default value is blue. Bearish FVG Color (clrRed) : Color used to highlight bearish inefficiencies. The default value is red. Bullish FVG
FREE

Introduction The "Ultimate Retest" Indicator stands as the pinnacle of technical analysis made specially for support/resistance or supply/demand traders. By utilizing advanced mathematical computations, this indicator can swiftly and accurately identify the most powerful support and resistance levels where the big players are putting their huge orders and give traders a chance to enter the on the level retest with impeccable timing, thereby enhancing their decision-making and trading outcomes.
FREE

CAP Moving Average EA MT5 trades using the Moving Averages Indicator. It offers many customizable Moving Averages trading scenarios and flexible position management settings, plus many useful features like customizable trading sessions, a martingale and inverse martingale mode. [ Installation Guide | Update Guide | Submit Your Problem | FAQ | All Products ]
Functions Easy to use and customizable Moving Average setting. Customizable indicator settings Built-in money management Grid
FREE

The SnapBack Scalper is an advanced Expert Advisor that identifies zones where the asset is overbought or oversold based on the RSI technical indicator. It uses the ADX to filter signals generated through the crossing of the +DI and -DI lines, opening buy or sell positions only when the ADX Main Line is above 25, indicating a strong market trend. The SnapBack Scalper incorporates an intelligent Trailing Stop system, where the trailing stop value is determined by the Parabolic SAR, relieving the
FREE

This indicator detects inside bars of several ranges, making it very easy for price action traders to spot and act on inside bar breakouts. [ Installation Guide | Update Guide | Troubleshooting | FAQ | All Products ] Easy to use and understand Customizable color selections The indicator implements visual/mail/push/sound alerts The indicator does not repaint or backpaint An inside bar is a bar or series of bars which is/are completely contained within the range of the preceding bar. A blue box is
FREE

自分自身で戦略を構築する このツールを使用すると、MetaTraderでネイティブに利用可能なすべてのインジケータおよびインターネットからダウンロードしたインジケータを使用して、戦略を開発できます。これらのインジケータは、データを画面に表示するためのバッファを使用しています。 このツールは、取引戦略を自動化するためにMetaTraderを検討する理由の一つです。これを使用すると、MetaTraderの任意のインジケータを使用して、簡単で直感的な方法で独自の戦略シグナルを作成できます。 インターネットからダウンロードしたインジケータがバッファを使用しているかどうかを知る方法 簡単です。このツールを実行するだけで、インジケータが持つすべてのバッファを自動的に検出し、それらを使用して戦略を作成できるようにします。 このツールは、自分のインジケータがバッファを持っているかどうか、データバッファがいくつあるかを自動的に識別できます。行う必要があるのは、バッファを正しい値に関連付けることだけです。 Moving Average、RSI、Stochastic、MACDなどのネイティブのMetaTra
FREE

FVG Fair Value Gap is an indicator that plot rectangle for last found fair value gap. There will be a total of eight fair value gaps. Four is bullish fair value gaps and another four is bearish fair value gaps. Bullish Fair Value Gaps Top Bullish/Bearish Fair Value Gap is the gap that will obey the "Recent candles" and "Nearby Size In Pips" parameters. This fair value gap will be above current price. Bottom Bullish/Bearish Fair Value Gap is the gap that will obey the "Recent candles" and "Nearb
FREE

AlgoRex EAは、独自開発された先進的な市場分析システムを搭載しており、FXトレーディングの精度と効率を飛躍的に向上させます。 AlgoRex専用ボラティリティアダプター AlgoRexの独自開発されたボラティリティアダプターは、ATR(平均真の範囲)とRSI(相対力指数)を駆使して、市場の揺れをリアルタイムで精密に分析します。この革新的な機能により、微細な市場の変動にも迅速に対応し、トレンドの変化を即座に捉えることが可能です。トレーダーは、この高度な技術を活用して、市場の動きに合わせた最適なトレーディングチャンスを見極めることができます。トレードのタイミングを科学的に判断し、より確実な取引結果を目指しましょう。 動的取引調整機能 現在の市場環境に基づいて、トレーディング戦略を自動的に調整するAlgoRexの動的取引調整機能は、あらゆる市場状況に最適なトレードを実現します。この機能は、リアルタイムの市場分析を基にして、エントリーとエグジットのポイントを継続的に最適化し、トレーダーにとって最良の取引条件を提供します。市場の予測不可能な変動にも強く、常に一歩先を行く取引をサポートしま
FREE

The Clean Trading Sessions indicator shows the most significant trading sessions for the Forex market, such as London, New York, Tokyo. The Clean Trading Sessions indicator is a simple and, at the same time, quite functional Forex sessions indicator, developed for the MT5 terminal. It is available to download for free.
How is this Forex market session indicator used? Traders normally use trading sessions to determine the volatile hours throughout the day, since the trading activities vary
FREE

Moving Average Trend Alert is a triple MA indicator that helps traders to identify potential market trends based on 3 MAs alignment and crossover.
Moving Average Trend Alert features: Customizable short-term, medium-term, and long-term MAs. Option to filter signals based on a minimum distance between moving averages to avoid premature MAs alignment. Optional Filter of signals with RSI indicator overbought/oversold levels. Optional Filter of signals with ADX indicator. Popup, email, and phone n
FREE

SUPERTREND; It is a trend following indicator based on the SuperTrend ATR created by Olivier Seban. It can be used to detect changes in trend direction and locate stops. When the price falls below the indicator curve, it turns red and indicates a downtrend. Conversely, when the price moves above the curve, the indicator turns green, indicating an uptrend. Like other indicators, it works well on SuperTrend when used in conjunction with other indicators such as MACD, parabolik SAR, Bollinger Band
FREE

This indicator draw a line on high and low levels of X number of days. It is possible to have an alert (in the software and mobile app) for when the price breaks the high or low of the current day. Configurações: Days - past days to calculate (1 = actual day only).
Alert when reach levels - activate the alert for specific levels or both.
Push notification - enable the alert to the mobile MT5 app.
Appearance
High - high level color.
Low - low level color.
Size actual day - thi
FREE

This is RSI with alarm and push notification -is a indicator based on the popular Relative Strength Index (RSI) indicator with Moving Average and you can use it in Forex, Crypto, Traditional, Indices, Commodities. You can change colors to see how it fits you. Back test it, and find what works best for you. This product is an oscillator with dynamic overbought and oversold levels, while in the standard RSI, these levels are static and do not change.
This allows RSI with alarm and push notific
FREE
OUR TELEGRAM FOR MORE INFORMATION
This Trading indicator automatically plots contract blocks characterized by support and resistance zones. This powerful tool enables traders to easily visualize key market levels where prices tend to bounce or reverse. The contract blocks are represented by colored rectangles indicating support (bottom) and resistance (top) zones, thereby aiding decision-making and optimizing trading strategies.
FREE

The Investment Castle Chances indicator will show signals on the chart for entering a buy or sell trade. There are 2 types of signals for each direction as follows: Buy / Sell (Orange colored candlesticks) Strong Buy (Green colored candlesticks) / Strong Sell (Red colored candlesticks) You may place a buy trade once you see the Buy arrow or vise versa, or you might prefer to wait for a further confirmation “Strong Buy” / “Strong Sell”. This indicator works best with the high time frames H1,
FREE

A combined indicator of two famous indicators: RSI , Bollinger Bands Can be used in all currency pairs Can be used in all time frames with many signals Very simple and fast to use
Description:
This indicator is made from the combination of RSI and Bollinger Bands indicators
As you can see, it shows good signals and is worth using and testing
We hope you are satisfied with this indicator
Settings: show past show candle: Displays the number of candles that the indicator calculates.
For
FREE

The indicator displays the orders book, as well as increases its depth, remembering the location of orders that have gone beyond the current "window" view.
Indicator capability Display the levels of open positions. Simulation of placing/cancelling/editing pending orders directly in the displayed orders book.
Indicator features The orders book display works only on those trading symbols for which it is broadcast by the broker. To reset the information about the rows that were recorded in the
FREE

速度の抵抗ラインは傾向および抵抗ラインを定めるための強力な用具である。 この指標は、チャートの極値と特別な数式を使用して線を構築します。 指標は、トレンドの方向とピボットポイントを決定するために使用することができます。
<---------------------------->
指標パラメータ:
"Depth of search" -チャートの極端な検索の深さ(バー単位) "Back step of search" -極端な間の最小距離(バー単位) "Deviation of price" -同じタイプの両極端間の許容価格差 "Line color" -対応するインデックスを持つ線の色 "Line style"-対応するインデックスを持つラインスタイル "Line width"-対応するインデックスを持つ線幅 <---------------------------->
あなたは本の中でより多くの情報を見つけることができます"エドソン*グールドによる希少な著作のコレクション"またはプライベートメッセージで私
<--------------------------
FREE

A very simple indicator, but one that cannot be missed when carrying out your operations.
Fast and accurate Spreed information before entering a trade as well as the time to start another candlestick.
Spread refers to the difference between the buy (purchase) and sell (offer) price of a stock, bond or currency transaction.
Come and see our mql5 signals too. https://www.mql5.com/pt/signals/899841?source=Site +Signals+From+Author
FREE

Fair Value Gap Sweep is a unique and powerful indicator that draws fair value gaps on your chart and alerts you when a gap has been swept by the price. A fair value gap is a price gap that occurs when the market opens at a different level than the previous close, creating an imbalance between buyers and sellers. A gap sweep is when the price moves back to fill the gap, indicating a change in market sentiment and a potential trading opportunity.
Fair Value Gap Sweep indicator has the following
FREE
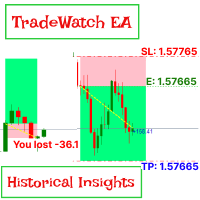
TradeWatch EAで取引戦略を強化しましょう TradeWatch EAは、リアルタイムの情報と取引コントロールを提供する強力なツールで、取引プロセスを簡素化し、リスク管理を改善します。 主な特徴: 取引の視覚化: グラフ上にストップロスとテイクプロフィットのレベルを直接表示します。 視覚的な表示により、迅速な意思決定とより良いリスク管理が可能です。 ポジションインデックス: ポジションインデックス番号を設定することで特定のポジションを監視できます(インデックスは0から始まります)。 複数の取引を同時に扱う際に非常に便利な機能です。 包括的な取引概要: すべての取引および履歴データを単一のグラフで表示します。 詳細な取引情報への簡単なアクセスにより、過去のパフォーマンスの分析と将来の戦略計画が容易になります。 リアルタイムの利益と損失の追跡: 取引の利益や損失に関する即時のフィードバックを提供します。 利益を最大化し、損失を最小化するためのタイムリーな意思決定をサポートします。 ユーザーフレンドリーなインターフェース: シンプルで直感的なデザインにより、すべての経験レベルのトレ
FREE

Idea extracted from the books by Anna Coulling and Gavin Holmes using Volume and Spread Analysis (VSA) techniques coupled with Al Brooks' expertise with Price Action these candles are magical, identify the exact moment
of the performance of the big players are acting in the market represented by the colors:
1) Red Candles we have an Ultra High activity,
2) Candles Orange we have a Very High Activity
3) Candles Yellow we have one High Activity
4) White Candles represent normal activ
FREE

The Pivot Point indicator automatically calculates and displays the pivot point line and support and resistance levels. Pivot can be calculated according to the Classic, Floor, Fibonacci, Woodie, Camarilla or DeMark formula. It is also possible to select the period for calculating the indicator. A trader can choose from daily, weekly, monthly, or user-defined periods.
Types of pivots Classic Floor Fibonacci Woodie Camarilla DeMark
Main features The indicator shows the current and histor
FREE

HiLo Activator is a technical analysis indicator developed by Robert Krausz, a renowned hungarian trader with a career in the USA.
It is a trend indicator that helps you to predict the cange of the current trend. In an uptrend it is displayed at the bottom of the candles; in a downtrend it is displayed at the top.
Its only setting is the calculation period.
It is possible to have alerts when a new trend begin. Enjoy! This is a free indicator, but it took hours to develop. If you want to pay m
FREE

PULLBACK ALGO is a cutting-edge trading algorithm designed to revolutionize your trading experience. Leveraging the power of the MACD indicator to pinpoint trend direction and pullback opportunities, along with the Stochastic indicator to identify overbought and oversold price levels, Pullback Algo is your key to staying ahead in the market.
With custom money management features, tailored trading schedules and hours, and complete control over indicator settings, Pullback Algo empowers you to
FREE

When working with several assets and having several open positions in different assets, it is a little complicated to visualize how much profit or loss is in each asset, so with this problem in mind I developed this indicator where it facilitates the visualization of open operations in each asset , where you will be able to open several different assets and you will be able to visualize the individual result of each asset and speed up your decision making in your trades.
FREE

Unlike many other programs in the mql5 market this is a REAL day trading strategy. It does not use any martingale or grid functionalities and follows a logical concept. The Range Breakout Expert Advisor can be used to trade time ranges. The market often finds its direction in the London Session and then follows this trend for the day. This expert advisor is designed to trade these trends after the London Session breakout. Still, you can trade all sorts of time breakouts with this program. I use
FREE

Unlock the Rhythm of the Markets: Automated Backtesting for Price Action Strategies Experience the power of our revolutionary price action concept backtesting product, capable of conducting years' worth of backtesting in a matter of seconds. Say goodbye to hundreds of hours of manual analysis and hello to instant insights. Our automated backtesting tool empowers traders to create and test strategies from scratch, optimize and refine their current strategies. No more manual constraints - propel
FREE

Elliot Waves Analyzer calculates Elliot Waves to Help Identify Trend direction and Entry Levels. Mainly for Swing Trading Strategies. Usually one would open a Position in trend direction for Wave 3 or a Correction for Wave C . This Indicator draws Target Levels for the current and next wave. Most important Rules for Elliot Wave Analysis are verified by the Indicator. This free version is limited for Analyzing one Timperiod Waves. Waves are Shown only in PERIOD_H4 and above. Not Useful for Intr
FREE

This indicator forms a channel based on the readings of the ADX (Average Directional Movement Index) indicator, displays and informs the trader of a price reversal at the boundaries of this channel, and can also report when the price touches the channel boundaries. It also draws additional dotted lines, which depend on the readings of the + DI and -DI of the ADX indicator. It also has an option for filtering signals depending on the readings of the stochastic. The channel drawn by this indicato
FREE

ICT Manual Analyzer Tool Makes life easy helping on drawing typical ICT Orders Blocks, FVG, BOS, EQ, SSL, BSL by using Key Shortcuts! Saves time on your Smart Money Analysis! Alerts you w hen prices reaches a Block or Level! by PopUp, Sounds, Email, Notifications. All Configurable! (That only works when using ICTScreener EA in other Chart) Includes a graphical Risk & Reward Ratio Tool!! to place Limits Orders, which automatically calculates lots based on your desired risk just by dragging w
FREE

蓮子はタイムレスなチャートです。つまり、期間は考慮されませんが、価格の変化が考慮されるため、チャート上の価格の変化がより明確になります。
ハイパー蓮子はこれを提供する指標です。
設定するには、使用するティックのろうそくのサイズ*のパラメーターを1つだけ使用します。
* tick:アセットの可能な限り小さなバリエーションです。
Hyper Traderインジケーターをお選びいただきありがとうございます。
ウィキペディア: レンコグラフは、変数の値(金融資産の価格など)の経時的な変化が最小限であることを示しています。グラフは、検討中の値(価格など)が特定の最小数量によって変化する場合にのみ時間とともに進みます。たとえば、資産価格のR $ 1の変動を考慮したレンコチャートでは、変動が発生するのにかかった時間と変動に関係なく、その変動が発生した場合にのみ、新しい「レンガ」が描画されます取引されたボリューム。したがって、横軸に時間、縦軸に価格変動をプロットすると、すべての「レンガ」は同じ高さ(同じ価格変動)を持ち、それらの間の間隔は視覚的に同じであるにもかかわらず、時間の変
FREE

Graph configuration and buy and sell signals based on Stormer's (Alexandre Wolwacz, Brazilian trader) swing, position and day trade strategy, described on his youtube channel (https://www.youtube.com/watch?v= 0QZ_NjWkwl0)
The buy and sell indications are based on 2 candle patterns ( Inside Bar [Yellow] and Reversal Closing Price [Blue and Red] ), 3 Moving Averages and 1 Stochastic .
Indicators: Inside Bar - Candle pattern indicating trend continuity, or reversal Reversal Closing Price - Ca
FREE

RSI Colored Candlesへようこそ。この革新的なインジケーターは、相対力指数(RSI)を直接価格チャートに統合し、従来のRSIインジケーターとは異なり、四色のカラースキームを使用してRSIレベルを直接ローソク足に表示します。一目で価値ある洞察を提供します。 特徴と利点: スペース節約デザイン: 混雑したインジケーターウィンドウにさようなら! RSI Colored Candlesは、別個のRSIウィンドウの必要性を排除し、より清潔で簡素な取引体験を提供することで、貴重なチャートスペースを節約します。 オーバーボートおよびオーバーソールドゾーンの視覚的表示: ローソク足で直接オーバーボート(赤いキャンドルで表される)およびオーバーソールド(青いキャンドルで表される)の状態を簡単に識別します。この視覚的表示により、より良い取引の決定を下し、逆転の可能性を最大限に活用できます。 改善されたエントリーシグナル: 色分けされたキャンドルをトレーディングシグナルとして使用し、青いキャンドルが買いの機会を示し、赤いキャンドルが売りの機会を示すようにします。この直感的なアプローチは、RS
FREE

Buy Sell Signal Low TF gives buy/sell signals and alerts with up and down arrow at potential reversal of a pullback or a trend continuation pattern in low timeframe. This is an indicator which gives signals based on trend => It works best in trend market with the principle is to ride on the trend not trade against the trend.
The components of Buy Sell Signal Low TF: - The trend is determined by SMMA 13 , SMMA 21 and SMMA 35 ( can be changed manually to suit your preference). - The signal is
FREE

Hi-Lo is an indicator whose purpose is to more precisely assist the trends of a given asset - thus indicating the possible best time to buy or sell.
What is Hi-lo?
Hi-Lo is a term derived from English, where Hi is linked to the word High and Lo to the word Low. It is a trend indicator used to assess asset trading in the financial market.
Therefore, its use is given to identify whether a particular asset is showing an upward or downward trend in value. In this way, Hi-Lo Activator can be t
FREE

Exp5-COPYLOT MASTERは、МetaТrader5とMetaTrader4のトレードコピー機です。任意のアカウントから外国為替取引をコピーします。 インストール このエキスパートアドバイザーはマスターコピー機です。トレードをコピーしたいターミナルにエキスパートアドバイザーをインストールします。 「COPY」のように、任意のテキストラベル名をpathWriteとして指定します。 トレードをコピーしたい端末にMT5用のCOPYLOTMASTERをインストールします。 次に、コピー先の MT4 端末にCOPYLOTクライアントMT4をインストールします。 または MetaTrader5用の CopylotクライアントMT5
MT4用のCOPYLOTMASTERを ダウンロードすることもできます COPYLOT-完全な説明とマニュアル PDFガイド 注:設定のリストは[コメント]タブにあります。 EAは1チャートに設定する必要があります!デフォルトでは、アドバイザーがアカウントからすべてのポジションと注文をコピーします。 注文はアクティベーション時にコピーされ(ポジション)
FREE
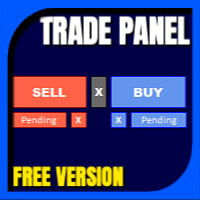
Have you missed any tools or shortcuts in Meta Trader? Simple things that would make your daily trading much easier ?
We have the solution for you: our Trade Panel!
This is an EA tool (Expert Advisor) that, if configured to controll all symbols, needs to be loaded only once.
This is the Lite version (free) of our tool. Professional version: https://www.mql5.com/en/market/product/42658 If you have some problemas with the shortcut buttons on chart on unpinned mode try change the tickets d
FREE

The Expert Advisor for this Indicator can be found here: https://www.mql5.com/en/market/product/115567 The Contraction/Expansion Breakout Lines with Fair Value Gaps (FVGs) Indicator for MetaTrader 5 (MT5) is a powerful technical analysis tool designed to help traders identify and visualize breakouts at critical levels of contraction and expansion in financial markets. By incorporating Fair Value Gaps (FVGs), this indicator enhances traders' ability to gauge market sentiment and anticipate poten
FREE

The Trend Line Reverse Expert Advisor is a highly innovative and powerful tool that enables traders to effortlessly identify and trade trends in the financial markets. With this advanced tool, you can easily draw trend lines on your MT5 chart, and the EA will automatically buy or sell when the price reaches the trend line. This EA is user-friendly and requires minimal setup. You can simply attach it to your chart and start drawing up to three trend lines where you anticipate the price to reverse
FREE
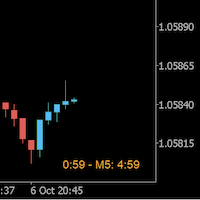
Always wanted to know when the M5 candle closes when you are in M1 ? This indicator allow to display a candle timer (countdown) on the current time frame as well as any higher time frame you have configured for this time frame. So this is easy now to see when the H4 candle closes when you are in H1.
Congifuration Label position, size, color HFT time frame per time frame Any questions or comments, send me a direct message here https://www.mql5.com/en/users/mvonline
FREE

Do you love VWAP? So you will love the VWAP Cloud . What is it? Is your very well known VWAP indicator plus 3-levels of Standard Deviation plotted on your chart and totally configurable by you. This way you can have real Price Support and Resistance levels. To read more about this just search the web for "VWAP Bands" "VWAP and Standard Deviation".
SETTINGS VWAP Timeframe: Hourly, Daily, Weekly or Monthly. VWAP calculation Type. The classical calculation is Typical: (H+L+C)/3 Averaging Period
FREE

knight Rider EA 100% Profitable Expert Advisor 5 minutes Chart ||USDJPY||1H Chart EURUSD||500$ account||Try to use low spread Account According to MQL5 rules EA is in low Risk setting you can change according to your wish
FREE

CPR Pivot Lines It Will Draw Pivot Point R1,R2,R3 S1,S2,S3 Tc Bc Best Part Is That You Can Even Add Values Of High,Low,Close Manually Also To Get Your All Levels On Chart.So If Your Broker Data Of High ,Low ,Close Is Incorrect Then You Don’t Have To Depend On Them Anymore. You Can Even Modify All Lines Style. It Will Show Line In Floting Style And Not Continues Mess.
FREE

Developed by Chuck LeBeau, the Chandelier Exit indicator uses the highest high / lowest low -/+ a multiple of the ATR value to draw trailing stop lines (orange under buys, magenta over sells) that advance with the trend until the trend changes direction.The value of this trailing stop is that it rapidly moves upward in response to the market action. LeBeau chose the chandelier name because "just as a chandelier hangs down from the ceiling of a room, the chandelier exit hangs down from the high
FREE

Fully automatic trading system that trades Renko bars and trend indicators. Renko bars are drawn in the indicator window below the chart. The signal to sell or buy is the intersection of renko and indicator signal. The default settings for the euro / dollar pair, t he EA has shown the best results for the pair GBPJPY and GOLD . The timeframe for trading is m1. There is a time filter. The EA has an autolot system. Our telegram channel After installing the EA, download the installation set
FREE
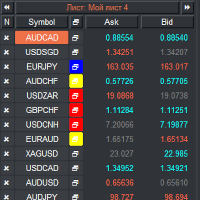
VRウォッチリストとリンカー - 端末用スクリーナーアプリケーション メタトレーダー 。最も興味深くテクニカルな金融商品を見つけやすくなります。このスクリーナーは、bybit、モスクワ取引所、アメリカン取引所、外国為替および暗号通貨市場、金属市場などの取引所での取引にトレーダーによって使用され、またプロップ会社の取引にも使用されます。金融商品の選択は手動で行われます。スクリーナーは、MetaTrader ターミナルで開いているチャートを接続し、金融商品を変更するときに各チャートのデータを個別に表示します。 設定、設定ファイル、デモ版、説明書、問題解決方法は、以下から入手できます。 [ブログ]
レビューを読んだり書いたりできるのは、 [リンク]
のバージョン 【メタトレーダー4】 スクリーナーを使用すると、トレーダーは最もテクニカルな金融商品を見つけ、流動性が低くリスクの高い商品の取引を除外することができます。スクリーナーを使用すると、ティッカー付きのシートを簡単かつ迅速に作成および変更したり、シートにティッカーをすばやく追加および削除したりできます。すべてのチャート上のトレーダ
FREE
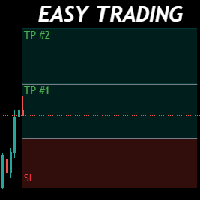
Money Management will help you to Easy Trade with One Click , instance and pending, set SL, and manage the number of your TP . You can use this expert for different currency pairs, CFDs, cryptocurrency, and stocks .
The basic formula for calculating pip value and position size , which has been used in this expert, are:
Pipette Value = Position Size * (Exchange Rate (Base Currency) / Entry Price) * Contract Size * Digits Exp. Account Currency: USD Currency Pair: GBPJPY Position
FREE

Prosperous BOOM MT5 EA is coded based on an advanced strategy primarily for scalping the Boom and Crash in the prices. Complex algorithms were implanted to trade high probability trades in Booms and crash in the prices .
Key Features
Shows trades taken with sl and tp Pop up and sound alerts on computer or laptop For boom only check my page for crash Working with all pairs.
Recommendation
Timeframe : M1 and M4 Recommend pairs :BOOM1000, BOOM500,BOOM300.
FREE

The utility draws pivot levels for the selected timefram in classic method. Pivot = (high + close + low) / 3 R1 = ( 2 * Pivot) - low S1 = ( 2 * Pivot) - high R2 = Pivot + ( high - low ) R3 = high + ( 2 * (Pivot - low)) S2 = Pivot - (high - low) S3 = low - ( 2 * (high - Pivot)) you can change the timeframe, colors and fontsize. also you can change the text for the levels.
Have fun and give feedback...
FREE

Jackson trendline scanner it a powerful price action tool which draw accurate trendlines and alert a breakout signals . As we all know that trendlines it a most powerful tool in price action by providing us with different chart patterns. e.g. Bullish flag, Pennant, Wedges and more...It not easy to draw trend lines, Most successful traders use trendlines to predict the next move based on chart pattern and breakout. Drawing a wrong trendline it a common problem to everyone, wrong
FREE
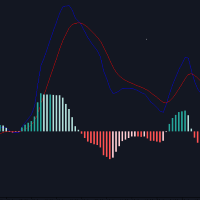
Overview : Introducing the Custom MACD Indicator for MetaTrader 5, inspired by the popular TradingView MACD but enhanced with additional features. This indicator provides traders with more flexibility and better visual cues for decision-making. Key Features : Custom Histogram Colors : Set your preferred color scheme for the MACD histogram to improve visibility and match your trading chart style. Recalculated Histogram Values : Get more accurate signals with our recalculated histogram values, des
FREE

Hello, Every one
A script to close all market positions and/or pending orders.
-----------------------------------------------------------------------------------
This is Close All market positions and/or pending orders button
You can close all orders in 1 second by one click
For advanced version: Advanced: https://www.mql5.com/en/market/product/77763
https://www.mql5.com/en/market/product/89311 Key:
1 Close all button: The script will close All orders market +
FREE

Using the Stochastic Oscillator with a Moving Average is a simple but very efficient strategy to predict a trend reversal or continuation.
The indicator automatically merges both indicators into one. It also gives you visual and sound alerts.
It is ready to be used with our programmable EA, Sandbox, which you can find below: Our programmable EA: https://www.mql5.com/en/market/product/76714 Enjoy the indicator!
This is a free indicator, but it took hours to develop. If you want to pay me a c
FREE

This indicators automatically draws the support and resistances levels (key levels) for you once you've dropped it on a chart. It reduces the hustle of drawing and redrawing these levels every time you analyse prices on a chart. With it, all you have to do is drop it on a chart, adjust the settings to your liking and let the indicator do the rest.
But wait, it gets better; the indicator is absolutely free! For more information: https://youtu.be/rTxbPOBu3nY For more free stuff visit: https
FREE
MetaTraderマーケットは、開発者がトレーディングアプリを販売するシンプルで便利なサイトです。
プロダクトを投稿するのをお手伝いし、マーケットのためにプロダクト記載を準備する方法を説明します。マーケットのすべてのアプリは暗号化によって守られ、購入者のコンピュータでしか動作しません。違法なコピーは不可能です。
取引の機会を逃しています。
- 無料取引アプリ
- 8千を超えるシグナルをコピー
- 金融ニュースで金融マーケットを探索
新規登録
ログイン