适用于MetaTrader 4的EA交易和指标 - 38

Price Action OB Trader EA - 是基于价格行为研究的完美自动交易系统!
这是“一劳永逸”的智能交易系统,它正在为您完成所有交易工作! 7 设置文件可用!
交易理念基于著名的强大价格行为模式 - OutsideBar!
价格行为 OB Trader EA 是非常好的投资 - 它将为您工作多年,所有 Set_files 都具有正的数学预期!
使用“注释”部分中的设置文件来使用/测试 EA
EA 特点: -EA 可以同时运行 7 对 - 相应的 Set_files 在“评论”部分等待您 - 系统不会像许多黄牛那样浪费钱来获取高额佣金 - 没有严格的点差要求 - EA 可以在任何账户上使用 -系统未使用任何危险的网格方法。 -EA默认内置复利资金管理。 - 每笔交易都有经纪商看不到的止损和止盈。 -止损和止盈是动态的——它们默认可以适应市场波动。 -补偿模式可在 EA 设置中使用 - 内置趋势和振荡器过滤器 - 还内置动态追踪止损 -交易对:AUDUSD、EURUSD、USDCHF、NZDCAD、USDJPY、AUDCHF、NZDUSD。 -时间范

EA PROMO EXPIRED 2022.12.12 (12 December 2022)......!!!!
.... NEW VERSION WITH 6 INDICATORS SETTING ON OR OFF (MA,RSI,CCI,MACD,STOCHASTIC,PARABOLIC SAR).... Automatic EA (With 6 indicator setting TRUE or FALSE) Manual trade (Buy,Sell,Trailing stop,Close buy,Close sell,Close profit,Close all) Local copy trading Full Panel indicators (SnR,Fibonacci,Currency strength,trade panel) Push notification,email,STP ALLINONE EA (All strategy in one EA) Hedging (on/off),martingale (on/off),anti martingal
FREE

Price Action Trader EA - 是基于价格行为研究的完美自动交易系统!
这是“一劳永逸”的 EA 顾问,它正在为您完成所有交易工作! 7 设置文件可用!
交易理念基于著名的强大价格行为模式 - PinBar !
价格行为交易 EA 是一项非常好的投资 - 它将为您工作多年,所有 Set_files 都具有正的数学预期!
使用“注释”部分中的设置文件来使用/测试 EA
价格行为交易者 EA 功能: - EA 可以同时运行 7 对 - 相应的 Set_files 在“评论”部分等待您 - 系统不会像许多黄牛那样浪费钱来获取高额佣金 - 没有严格的点差要求 - EA 可以在任何账户上使用 - 系统未使用任何危险的网格方法。 - EA默认内置复利资金管理。 - 每笔交易都有经纪商看不到的止损和止盈。 - 止损和止盈是动态的 - 它们默认可以适应市场波动。 - 补偿模式可在 EA 设置中使用 - 内置趋势、震荡指标和日过滤器 -交易对:AUDUSD、AUDNZD、NZDJPY、GBPJPY、CADJPY、GBPAUD、EURCAD -时间范围:D1 -
"GA Moving Average"("GA 移动平均线")是一个移动平均线交叉策略的专家顾问(EA),它具有可调整的设置,可根据您的想法打造完美的交易策略。
"GA Moving Average"的核心概念是利用移动平均线指标来识别潜在的交易机会。通过分析不同移动平均线之间的相互作用,该EA旨在生成市场上的买入和卖出信号。
主要特点和自定义选项: 1. 移动平均线参数:交易者可以定义特定的移动平均线期数(短期和长期),以适应其交易风格和偏好。这提供了灵活性,以适应不同的市场条件和时间框架。
2. 交叉信号生成:该EA监控短期移动平均线与长期移动平均线的交叉。当短期移动平均线向上穿过长期移动平均线时,生成一个看涨信号,表示可能的买入机会。相反,当短期移动平均线向下穿过长期移动平均线时,生成一个看跌信号,表示可能的卖出机会。
3. 风险管理:该EA包含风险管理功能,允许交易者控制市场风险敞口。用户可以指定交易手数、止损和止盈水平等参数,以管理风险并保护交易资本。
4. 可自定义参数:"GA Moving Average"提供一系列可调整的参数,用于优化策略。交易者
FREE

Triple Brain EA is Your Smart, Safe, Profitable, Martingale, Hedging MT4 Auto Trading Forex Expert Advisor The Triple Brains Expert Advisor (EA), brought to you by GoStart.Biz, is an avant-garde trading tool meticulously crafted to augment your trading arsenal. Featuring a potent mix of sophisticated strategies including martingale recovery, hedging, and multi-dimensional trade management, this EA is tailored to empower the MetaTrader 4 platform users. System Compatibility and Requirements: Des
FREE

RangeMasterFX 结合基于多个时间框架的趋势分析和技术指标,生成可靠的交易信号并自动化有效交易。
主要特点:
多时间框架分析:
分析三个时间范围内的趋势:每日 (D1)、4 小时 (H4) 和 1 小时 (H1),以找到准确的入场点。 RSI 过滤器:
使用 RSI(相对强度指数)来识别超买和超卖的市场状况并过滤条目。 追踪止损:
为了最大化利润,如果仓位变动对您有利,则应用追踪止损。 动态止损和止盈:
基于ATR(平均真实波动范围)指标,根据市场波动动态设置止损和止盈。 自动获利了结:
设置目标利润率并在达到目标后自动平仓所有头寸。 过滤功能:
查看多个时间范围内的趋势方向,并使用基于趋势方向的过滤器来提高条目的质量。 这是通过在上升趋势的情况下仅下达买单、在下降趋势的情况下仅下达卖单来实现的。 ATR功能:
使用ATR(平均真实波动范围)根据市场波动情况设置动态止损和止盈,以更好地管理风险。 参数灵活性:
魔法:
描述:神奇数字 默认值:3937 开始交易:
说明:交易开始时间(小时) 默认值:0 结束交易:
描述:交
FREE

Nermal Round Levels is an indicator of round numbers in the form of a grid drawing horizontal lines. You can use it in many ways ... as it could be activating for an expert advisor to enter the market, confirmation of entry for your strategy, entrance area, mark areas of important levels, possible rebounds and others. Place it in your chart and verify as the price respects those round levels.
Inputs GridSpace linecolor lineStyle
FREE

ADX Channel is an indicator that plots the channel depending on the values of the ADX (Average Directional Movement Index) indicator. The resulting channel is a little similar to the Envelopes, but its lines depend on the market volatility. The sell trade is usually executed fast when the price touches and bounces from the upper line of the channel, buy - from the lower. It is recommended to trade when there is no significant news. The recommended timeframes: M5 - H1. The indicator is not design
FREE

A fractal divergence is a hidden divergence , based on Bill Williams' fractals. A bullish fractal divergence is a combination of two lower fractals, the last of which is located below the previous one, and, at the same time, two candles to the right of the Low of the last fractal have Lows higher than the previous fractal level (see screenshot 1). A bearish fractal divergence is a combination of two adjacent upper fractals, the last of which is located above the previous one, but, at the same ti
FREE

该专家顾问实施了最初的丹尼斯和埃克哈特交易系统,通常被称为“乌龟交易者”。它的交易方式与原始海龟完全一样,并且可以由经验丰富的交易者使用以捕获向上或向下市场中的趋势。 [ 安装指南 | 更新指南 | 故障排除 | 常见问题 | 所有产品 ] 易于使用和监督 完全可配置的策略设置 完全可配置的交易设置 适用于ECN /非ECN经纪人和2-3-4-5数字符号 适用于差价合约和外汇工具 该策略交易两个互补系统,一个主系统和一个故障安全系统: 系统一交易20天突破,并在10天突破完成交易 系统2交易55天突破,并在20天突破完成交易 该策略的基本原则如下: 根据最后一个信号的结果过滤交易 交易以ATR(30)/ 2的时间间隔最多可进行4笔交易 跟踪止损适用于所有使用卖/买+/- ATR(30)* 2的交易 每减少20%,每笔交易的风险就会降低10% 该EA实现了原始乌龟交易者的默认设置,但此后在金融市场发生了很大变化。为了获得利润,交易者将必须对交易内容做出最佳判断,并优化策略测试器中的设置。
设置
将EA交易程序加载到任何图表时,将为您提供一组选项作为输入参数。如果您认为它们太多,

BeST_Gann Swing Oscillator is an MT4 indicator that is based on the corresponding work of Robert Krausz who introduced it in the book “ A.W.D Gann Treasure Discovered ” .
The Gann Swing Oscillator is a range-bounding technical indicator that oscillates between +1 and -1 and thus it describes the market swings.
Generally when the market is in an upswing, the Gann Swing Oscillator describes it as 2 higher highs with the value of +1 while after an upswing, the downswing is expected.
Also the do

Based on famous and useful indicator - Super Trend, we add some features to make this Indicator much easier to use and powerful. Ease to identify the trend of any chart. Suitable for both Scalping & Swing Better to use in the trending market be careful in sideway market, it might provide some fake signals Setting: ATR Multiplier ATR Period ATR Max Bars (Max 10.000) Show UP/DOWN node Nodes size Show Pull-back signals Pull-back filter ratio Period of MA1 Mode of MA1 Period of MA2 Mode of MA2 A
FREE

This outside bar indicator is the opposite of the inside bar. So what this MT4 outside bar indicator does is identifies outside bars for you as they form on your charts. Outside bar is a famous trading pattern in which the bar carry higher high and lower low compared with the previous bar, also known as mother bar. To trade based on Outside Bars, simply place buy stop order above the high price level of a bullish Outside Bar, and sell stop order should be placed below the low price level of a be
FREE
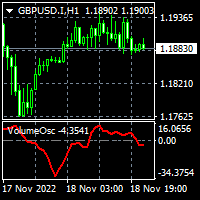
To download MT5 version please click here . The Volume Oscillator measures volume by analyzing the relationship between two Moving Averages. The Volume Oscillator indicator subtracts a fast MA from slow MA. The fast and slow MA periods are configurable via input tab. Volume indicators are an ingredient of trading systems to avoid entry in thin liquidity markets. Having set a threshold on Volume Oscillator you can avoid entering chop. Buffers are available to access via EA.
FREE

本指标 基于 Zigzag 基础上... 增加了: 1.增加了箭头指示,使图表更鲜明 2.增加了价格显示,使大家更清楚的看清价格. 3.增加了报警等设置,可以支持邮件发送 原指标特性: 1.基本的波段指标构型. 2.最近的2个ZIGZAG点不具有稳定性,随着行情而改变,(就是网友所说的未来函数) 3.原指标适合分析历史拐点,波段特性,对于价格波动有一定的指导性.
Zigzag的使用方法一 丈量一段行情的起点和终点 (1)用ZigZag标注的折点作为起点和终点之后,行情的走势方向就被确立了(空头趋势); (2)根据道氏理论的逻辑,行情会按照波峰浪谷的锯齿形运行,行情确立之后会走回撤行情,回撤的过程中ZigZag会再次形成折点,就是回撤点; (3)在回撤点选择机会进场,等待行情再次启动,止损可以放到回撤的高点。 一套交易系统基本的框架就建立起来了。 Zigzag的使用方法二 作为画趋势线的连接点 趋势线是很常见的技术指标,在技术分析中被广泛地使用。 但一直以来趋势线在实战中都存在一个BUG,那就是难以保证划线的一致性。 在图表上有很多的高低点,到底该连接哪一个呢?不同的书上画趋势线的方
FREE

Ilanis is and Expert Advisor for stock trading, it can be used for trading on Forex and other markets, including commodities, metals and index markets. To determine the market entry, the EA uses the modern and ultra-light adaptive indicator FourAverage. Principle of position maintaining is similar to that of the popular Forex robot Ilan, using averaging. But unlike Ilan, Ilanis uses an accurate entry into the market. The robot pays a lot of attention to position control, if the price goes in the

The indicator is completely based on the classic MFI indicator. I recommend watching my advisor - Night Zen EA
It contains two basic trading strategies: The output of the MFI line from overbought/oversold zones. The entry of the MFI line into the overbought/oversold zones. Arrows are drawn after confirming the signal by strategies and are not redrawn.
Alerts are also registered: Alerts Push notifications to the mobile terminal email Settings: MFI period - the period of the MFI indicator L
FREE

The Trade Grid bot simplifies trading by executing multiple orders with a single click, as specified by the user. These orders are initiated instantly using the EA buttons on the chart and can be closed simultaneously using the close button also located on the chart. Additionally, Trade Grid efficiently manages trades by automatically closing them once they reach a predefined profit or loss threshold.
FREE
The intelligent algorithm of the Reversibles indicator determines the direction and strength of a trend, and also signals a trend change. Reversibles is a technical analysis indicator. Uses just one parameter for settings.
The indicator is built for simple and effective visual trend detection with an additional smoothing filter. The indicator does not redraw and does not lag. Shows potential market reversal points. The indicator can work on any timeframe.
You can set up message alerts as so

This indicator shows the latest untouched support and resistance as horizontal lines. The indicator can show support/resistance from higher timeframes. With this indicator you can e.g. easily see the support/resistance of the timeframes H4, D1 and W1 on a H1 chart, which can be a big advantage while time your entry on H1. This is the FULL version of the indicator: Support Resistance Multi Time Frame FREE
Parameters referenceTF: the timeframe from which the support/resistance is calculated cand

Big summer sale. Save up to 40% on my products. Supply & Demand dashboard - save 10$! The Netsrac Supply&Demand Dashboard shows you at a glance where relevant zones are located on your favorite assets. Open your chart directly from the dashboard and trade zones that really matter. Features
Finds the next relevant supply and demand zone and displays the distance to this zone (in pips) Finds and displays the zones in three different timeframes Calculates a trend indicator for the current and past

Scalper Zoom is a new trading system designed to facilitate the process of Forex trading both for beginners and professionals. The Scalper Zoom indicator uses an adaptive method of operation and analyzes the market using multiple trading algorithms, while selecting the most efficient one for the given currency pair and timeframe. Working with this indicator is very simple. When a red vertical line appears, open a sell order. Close it when a blue vertical line appears. Follow the opposite steps f

Friends, we present to your attention our new Forex Gump Laser indicator. Since there are no designers in our team, but mainly mathematicians, financiers, programmers and traders, we did not make any special changes in the indicator design. In appearance, it resembles the usual Forex Gump. On the other hand, Forex Gump has become not just the name of an indicator, it is a brand. And we try to preserve the corporate identity in all its varieties. The whole essence of the indicator in its operatio

Piramid Machine is a tool supporting manual trading, allowing for a radical increase in profits. Principle of operation: The trader must open the first position himself. In the "Auto_size_position" mode, the robot will determine the size of the item based on the assumed risk risk "Risk_perc" and the automatically set SL level. The SL level is defined as: If you do not use the red "colored pencil" (shown in the movie), then SL is set at the Kijun or Tenkan level - depending on the choice. The siz
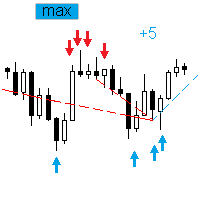
The Expert Advisor trades the signals from an artificial neural network with one hidden layer. Presence of a signal is checked at the closing of the specified period. MAIN PARAMETERS Net option - setting the order grid. When placing a market (not pending, Pending order offset=0 ) order according to a signal, the grid order is set. The following direction are available: follow the trend , against the treand and both directions . The number of placed orders is taken from the ...maximum deals with

The Investment Castle Chances indicator will show signals on the chart for entering a buy or sell trade. There are 2 types of signals for each direction as follows: Buy / Sell (Orange colored candlesticks) Strong Buy (Green colored candlesticks) / Strong Sell (Red colored candlesticks) You may place a buy trade once you see the Buy arrow or vise versa, or you might prefer to wait for a further confirmation “Strong Buy” / “Strong Sell”. This indicator works best with the high time frames H1, H
FREE

BaxterStars is a fully automated trading system for the Metatrader4 platform. The robot trades on the scalping system. It opens trades for short positions. Depending on the market situation, it can open a different number of transactions, from 1-2 per week to 5 transactions per day. It all depends on how the market behaves. The robot works on a breakthrough strategy. It automatically determines the accumulation lines of the price range by setting virtual entry points at the level of these lines

This indicator will show yesterday and today high low, very useful to understand the market sentiment. To trade within the range/ break out. Previous day low- can act as support- can used for pull back or break out Previous day high- can act as resistance- can used for pull back or break out The previous day high low breakout strategy refers to the day trading technique that provides traders with multiple opportunities to go either long or short . The main idea is to identify the trend in its m
FREE

Forex Gump EA is a unique trading system that uses algorithms for trading with several indicators of the Forex Gump series. Thanks to the improved financial control system, this robot adjusts the aggressiveness of trading depending on the dynamics of the deposit growth. The more actively the deposit grows, the larger the lot size of new opened deals. That is, the trading volume of transactions increases with the growth of the deposit on the trading account. The robot in a fully automatic mode a
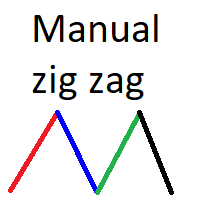
Manual Zig-zag allows you to build a zig-zag with the mouse, to build it is necessary to turn on the zig-zag and left-click. The file must be placed in the \ MQL4 \ Indicators folder then in the terminal from the list of indicators put it on the chart.
A zigzag can be built so that this zigzag can only be seen on the current time frame or in all halves at once.
You can change the color and thickness of the line while on the chart without getting into the settings.
You can quickly remove e
FREE
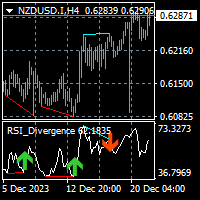
The indicator shows/alerts divergences of RSI indicator. note: You can check the free EA here that utilizes this indicator. repaint and lag issue Divergence indicators are usually repaint and lagging in their nature. You may have experienced in trading when you see a divergence on chart but the divergence continues further or just disappear. pivots_period input The smaller this value is the more and faster signals are generated. The greater this value you will have less and late signals. displa
FREE

The Point61 indicator is the result of many years of monitoring of price behavior of currency pairs and metals.
It is not a secret, that in times of uncertainty, traders are looking for possible levels of support and resistance - the point, where price should stop its movement.
There are 2 possible scenarios at these points:
1. Reverse (correction) to the opposite direction;
2. Breakthrough to continue movement. Very often these points are used to set stop orders - TakeProfit or
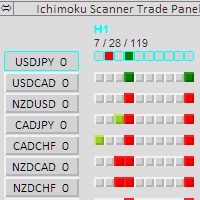
This scanner is a tool used to support trading with the Ichimoku method. Its basic features are: 10 trading setups implemented in accordance with the Ichimoku technique, the possibility of simultaneous scanning, all financial instruments available on the platform, the possibility of simultaneous scanning, in all timeframes available on the platform, available Manual and Auto trade , the ability to open in Manual mode from the level of the chart, the ability to determine the size of the position

Overview
The Volume SuperTrend AI is an advanced technical indicator used to predict trends in price movements by utilizing a combination of traditional SuperTrend calculation and AI techniques, particularly the k-nearest neighbors (KNN) algorithm.
The Volume SuperTrend AI is designed to provide traders with insights into potential market trends, using both volume-weighted moving averages (VWMA) and the k-nearest neighbors (KNN) algorithm. By combining these approaches, the indicat

Ska ZigZag Line indicator determines the overbought and oversold regions within a trend. The indicator determines the overbought region by the candlestick high and the oversold region by the candlestick low in a form of a line. To utilize the full strategy i recommend using "Ska ZigZag Line" together with "Ska ZigZag BuySell". NOTE: This indicator is a line based indicator. HOW TO USE: Sell Signal; Place a sell trade when the Ska ZigZag BuySell indicator arrow appear on top of the Ska ZigZag Lin
FREE

ATR Accelerator Indicator informs you about strong price movements based on the ATR Indicator. This Indicator works for all Timeframes and Symbols, the strength of movements can be configured.
Important: Get informed about new Products, join our MQL Channel: https://www.mql5.com/en/channels/etradro
Useage This Indicator works for all Timeframes and Symbols, the strength of movements can be configured. Features works on all timeframes and forex pairs or indices. Alert and Notify function
FREE

14 Indicators and auxiliary tools for convenient trading This utility contains 14 additional tools that can be useful for certain actions of the trader, thereby simplifying and speeding up the trading process. My #1 Utility : includes 65+ functions | Contact me if you have any questions Due to the different monitor resolutions, some users may encounter the fact that the labels will be displayed with an overlay or be too small. If you encounter such a problem, you can adjust the font size
阳线开多,阴线开空! 阳线开多,阴线开空! 阳线开多,阴线开空!
阳线开多,阴线开空! 阳线开多,阴线开空!
阳线开多,阴线开空! 阳线开多,阴线开空! 阳线开多,阴线开空! 阳线开多,阴线开空!
阳线开多,阴线开空! 阳线开多,阴线开空!
阳线开多,阴线开空! 阳线开多,阴线开空! 阳线开多,阴线开空! 阳线开多,阴线开空!
阳线开多,阴线开空! 阳线开多,阴线开空!
阳线开多,阴线开空! 阳线开多,阴线开空! 阳线开多,阴线开空! 阳线开多,阴线开空!
阳线开多,阴线开空! 阳线开多,阴线开空!
阳线开多,阴线开空! 阳线开多,阴线开空! 阳线开多,阴线开空! 阳线开多,阴线开空!
阳线开多,阴线开空! 阳线开多,阴线开空!
阳线开多,阴线开空!
FREE
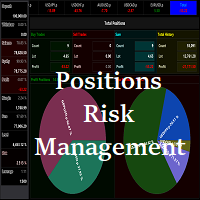
Waddah Attar Easy Positions Risk Management
This EA gives you a full ability to close one position or close all positions . Close buy or sell trades in any position . Close profit or loss position . by clicking on a command button on the chart with confirmation message . Show you a full information about your positions like : count - lots - average price - points - profit - profit % - used margin for this position and the risk percent . and also the scrolled table of trades that position ha
FREE

It is the same of Advanced Arrow indicator but shows the signal of 8 currencies pairs at the same time on 5 Timeframes without any TPs line or SL.
Features You will know when exactly you should enter the market. This indicator does not repaint it's signals.
Signal Types and Timeframes Used You can use this indicator on any timeframes but i recommend you to use it on H1, H4 frames. The indicator gives you four signals (Ready to Buy "RBuy", Ready to Sell "RSell", Buy, Sell). When RBuy appear y

A simple expert Advisor based on the signals of the Stochastic indicator in the overbought zone - sell, in the oversold zone - buy. Add friends, send your interesting strategies. Perhaps after discussing all the nuances, I will write an adviser for free .
Parameters:
"_Slippage" - Slippage;
"_Magic " - Order ID;
"_ Lot " - Volume;
"_ StopLoss" - Stop;
"_CloseBalanse" - Closing by balance;
"_CloseBalanseLose " - Loss in the account currency;
"_ClosePercentBalanse" -
FREE
Download the USDJPY free version here.
Scalping Strategy
BUY SELL
Having a strategy in the market is one of the main conditions for trading. The presence of various and complicated indicators and tools sometimes makes trading difficult, and the user gets confused after trying various methods and gets stuck in a loss cycle, the result of which is usually clear. This indicator is a simple strategy based on the detection of pivots and short-term trends, which helps you to easily trade i
FREE
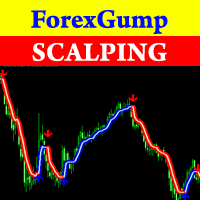
Attention! Friends, since there have been many scammers on the Internet recently selling indicators called ForexGump, we decided to warn you that only on our page is the LICENSE AUTHOR'S VERSION of the INDICATOR sold! We do not sell this indicator on other sites at a price lower than this! All indicators are sold cheaper - fakes! And even more often sold demo versions that stop working in a week! Therefore, in order not to risk your money, buy this indicator only on this site! Forex Gump Scalpin
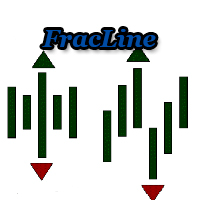
The "FracLine" Expert Advisor uses trend lines based on fractals to open a position.
It works at closing prices, so optimization and testing can be performed at open prices. The time frame and tool can be anything. Definition of a fractal for this EA:
a fractal is a 9-candlestick pattern, where the central one is the maximum (in an upward movement) or minimum (in a downward movement) in this pattern.
A prerequisite is that to the left and right of the high (fractal candle) there must be a
FREE

The Candle Scalper EA is a fully automated Expert Advisor that trades based on price action. The EA trades using market orders and uses averaging to safely turn otherwise negative trades positive. This EA works best on EURUSD using the M5 timeframe. A VPS is advisable when trading this system. Check the comments for back test results and optimized settings. Please note: I have made the decision to give this EA away and many more for free with limited support so that I can concentrate on Custom E
FREE

这是免费产品,欢迎您根据您的需要使用!
我也非常感谢您的积极反馈! 多谢!
// 这里提供更多优秀的 EA 交易和指标: https://www.mql5.com/en/users/def1380/seller // 也欢迎您加入盈利、稳定、可靠的信号 https://www.mql5.com/en/signals/1887493 ............................................................................................................. MT4 的外汇指标点差显示,交易支持。
点差显示指标显示其所附着的外汇对的当前点差。 可以将点差显示值定位在图表的任何角落: 0 - 左上角、1 - 右上角、2 - 左下角、3 - 右下角 还可以设置颜色和字体大小。 它是仅在该 MQL5 网站上提供的原创产品。
FREE

EA可以通过搜索并平掉盈利仓位来平掉无利可图的仓位 。
该助手 在所有位置中 寻找 终端中 最 无利可图的位置 。 进一步地,通过搜索剩余的盈利头寸,他计算出当一个或多个头寸的 利润 大于另一个头寸的损失时可以弥补损失的一系列头寸。 如果找到一组此类头寸,顾问就会将其平仓。 一系列位置可以由任何位置组成。 它们的最大数量可以在顾问设置中调整。 您还可以指定搜索的最小损失和平仓的额外利润。 MT5版本
详细描述 如何购买
如何安装
如何获取日志文件 如何测试和优化 Expforex 的所有产品 您可以在策略测试器中测试 Expert Advisor,并在可视化模式下使用我们的 EAPADPRO 工具栏进行交易! 近减加加在图表上的工作原理 认为 您以 1.600 的价格开设买入 #1 仓位; 价格跌至 1.550 ,目前亏损 -50点; 盈亏平衡点(平均价格)= 1.600 ; 如果我们打开 SELL #2、Sell #3 和 Sell #4; EA 交易开始执行主算法。 那么总利润将为+5$; 智能交易系统 (EA) 激活算法,并且
FREE

[Deviation of each indicator MT4]集合了18种指标,可以任意选择其中的一种指标来参与计算。能计算出各个指标的背离形态,并且可以提示警报。 参数设置说明: 【indicators】是选择18种指标里的一种参与计算 (这个参数非常重要) 。 【period】是每种指标公共的周期。 【Method】是某些指标的MA模式。 【Apply_to】是某些指标的应用价格。 【Fast_EMA】【Slow_EMA】【MACD_SMA】【K_period】【D_period】【Slowing】这些是部分指标需要的参数,需要这些参数的指标很少。 【Forward_disparity】是K线距离当前低或高的最小距离。 【Forward_count】是向前搜索的最大数。 【***Display form***】向下的是设置箭头和线的大小和颜色。 【alert_NO_OFF】:这是警报开关,设置成true,如果出现箭头就会自动警报提示;设置成false,则不会警报提示。 【sendmail_NO_OFF】:这是发送邮件的开关,设置成true,如果出现箭头就会发送邮件到你在MT4设
FREE

Indicador de Bandas de Fibonacci para Metatrader 4 . Este indicador funciona de forma similar a las conocidas Bandas de Bollinger clásicas, pero en lugar de usar la desviación estándar para trazar las bandas usa números de Fibonacci y el ATR (Average True Range). Puede usarse para trazar niveles de soporte y resistencia que pueden emplearse en sistemas de scalping de corto plazo y swing trading. Las bandas del indicador son calculadas de la siguiente forma: Línea central : Media móvil de n peri
FREE
This is a general purpose indicator that displays colored lines at fixed and customizable price intervals, entered as parameters. It offers universal, constant, and familiar price ranges that allow quick and precise price analysis of a currency pair. With default parameters, this indicator implements The Quarters Theory , as described originally by Ilian Yotov . [ Installation Guide | Update Guide | Troubleshooting | FAQ | All Products ] Easy to use No optimization needed Customizable price inte
FREE
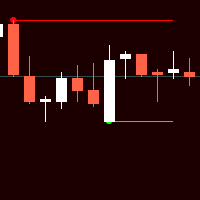
Индикатор Форекс и бинарных опционов основан на простых паттернах из двух свечей. Стрелки вообще не рисуют. Даже при смене таймфреймов.
В настройках можно включить или отключить линию уровня.
Также в настройках можно менять коды стрел, их цвета (также цвета линии уровней), Размер и расстояние от свечи (баров).
Индикатор прост в применении. А настройки тоже не сложные. Единственно не рекомендуется увеличивать период (step). По умолчанию прописано 500. Больше этого уже загружает терминал.
FREE

TD Combo is better when you have sharp directional moves, because it requires only thirteen price bars from start to finish compared to TD Sequential which needs at least 22 bars. The criteria for a Setup within TD Combo are the same with those required for a Setup within TD Sequential. The difference is that the count starts at bar 1 of the setup and not from bar 9 and TD Combo requires four conditions to be satisfied simultaneously.
Requirements for a TD Combo Buy Countdown
- Close lower
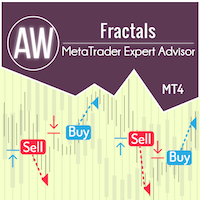
AW Fractals EA 根据 AW Flexible Fractals 指标发出的信号运行。分形指标被用作支撑位和阻力位,交易顾问根据这些支撑位和阻力位的分解情况工作。入市时,顾问自动打开市价订单和挂单,出市时,使用智能追踪系统和挂单平均。Advisor 具有自动计算风险管理的内置功能、灵活的设置和多种工作方案。 解决问题 -> 这里 / Version МТ5 -> HERE 优点: 灵活的自动化交易系统, 内置可调节尾随系统 顾问内的可定制指标, 输入变量的直观简单设置, 用于平均挂单的内置系统, 用于自动计算风险管理的可连接系统。 笔记!指示标记不会显示在顾问程序中。 策略描述: 分形是由蜡烛组成的几何图形组合,其形状为楔形,中心为峰值。也就是说,当平均价格是一个峰值,而峰值之前的后续和前一个蜡烛图都低于或高于峰值蜡烛图时。这些标志被用作支撑位和阻力位。如果价格突破支撑位,顾问就会建立空头头寸(卖出)。如果价格突破阻力位,顾问将建立多头头寸(买入)。 支撑位是指分形处于下方,即中央烛台低于相邻烛台,阻力位是指中央烛台高于相邻烛台。该顾问根据 AW Flexi
Get all the moving averages in one indicator. Simple moving average, Exponential moving average, Smoothed moving average, Linear weighted moving average, Double Exponential Moving Average, Triple Exponential Moving Average, T3 Moving Average and MORE. Find in the comments a Free Expert Advisor that uses the XPMA . It will show you how easy to make an EA based on the XPMA (XP MOVING AVERAGE). Settings: Moving Average Type: The Moving Average Type. It can be one of these types: SMA (Simple Moving

Slope Trend Robot is the Expert Advisors trading with a combination of multiple strategy trading algorithms (Trend, Level Trading, and Money Management with Martingale recovery loss to profitable).
The Trading algorithms. 1. Follow trends with Indicators is Moving average and Envelopes. 2. Open order two ways that trading both BUY and SELL. 3. Open orders with distance. 4. Close order follow indicator's signal with a profit.
How to work? Open BUY When Moving Average Cross Above Envelopes
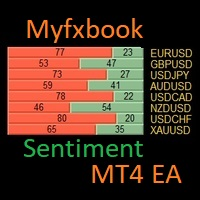
I have created this Free MT4 Tool EA to test if it is more profitable to trade in favor of the mass sentiment of traders or it is better to go against it.
The EA is Multy-currency and can trade on Demo or Real if you want (but be carefully, this tool is made to understand if it is better to trade for or against market sentiment... Use at your own risk)
Remember to authorize Myfxbook url in WebRequest options in MT4. - Check the Video to know how to do it
You cannot baktest this tool sinc
FREE
EA245 Draw Supply Demand v1 This EA only good for draw Supply and Demand, you can use draw with two Time Frame input (True/False). Manual Traders can use as tool for support and monitor the price near Supply and Demand before excute to open Buy or Sell orders Note: The result of Auto Trading normaly not good, so please consider select True or False open Order (item [11]). This EA for free so you can use and share for your friends. If you have any question, please contact our gruop via informatio
FREE
AW RVI 基于经典相对活力指数 (RVI) 振荡器信号的交易。为了平仓,它使用智能跟踪系统并使用挂单进行平均。 Expert Advisor内置风险管理自动计算功能,设置灵活,工作场景多。 解决问题 -> 这里 优点: 灵活的自动交易系统, 内置可调节拖尾系统, EA 内部可定制的振荡器信号, 输入变量的直观简单设置, 适用于任何类型的工具和任何时间范围, 用于风险管理自动计算的可插拔系统。 笔记! EA 不显示振荡线。 战略: RVI 是一个震荡指标,显示当前价格变动的能量,并反映开盘价和收盘价在高低范围内的价格变动的有效性。这有助于确定进一步的运动是否会继续以及有多大概率。 与经典震荡指标不同,RVI 没有超买和超卖区域,而是通过穿越 RVI 线和信号线给出交易信号。 RVI 线低于零 - 下降趋势;零线以上 - 上升趋势。 市场准入: 进入交易的信号由慢速 RVI(红色)信号平滑线的交点给出: 从上到下交叉时 - 卖出信号; 当自下而上穿越时 - 买入信号。 水平线越过零线也是一个信号。从上到下交叉是卖出信号,从上到下交叉是买入信号。 信号策略由“RVI_Signa
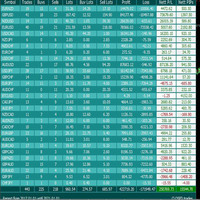
Very good tool for statistics, shows the moment and history, you can observe instant profit, profit - loss in pips, money, etc. I still have a lot of useful indicators for free, if anyone wishes you can write to me. You can keep your records by magic number, also only for a specific hour or year or day. For more information, welcome to our Telegram Group. https://t.me/InfinXx
FREE

I like a simple Robot and I will share with you. I can provide some information about using Simple Moving Average (SMA) as a trading strategy in Forex. SMA is a commonly used technical analysis tool in Forex trading. It calculates the average price of a currency pair over a specified period of time, and the resulting line can be used to identify trends in the market. Traders often use the crossover of different time period SMAs (e.g. 50-day and 200-day) to identify potential buy or sell signals.
FREE
This indicator copies graphical objects (vertical lines, horizontal lines, text labels, fibo and etc.) from master chart to other charts.
For example, you can copy lines from the chart GBPUSD with period H1 to chart GBPUSD with period M15. It's makes technical analyses more simple. Show label - show label on the Master chart, where you draw graphical objects to copy; Font size - font size of label; Type of synchronisation - type of synchronisation Copy text - on/off copy of text objects
Copy
FREE

This indicator is suitable for trading Forex and Binary Options, depending on its settings. The indicator is designed for trend trading. A buy signal: An up arrow appears on the chart. A sell signal: A down arrow appears on the chart.
Input parameters === Setup CCI === Period CCI 1 - Period of the CCI Period CCI 2 - Period of the CCI Level BUY - Level of the CCI for buying Level SELL - Level of the CCI for selling === Setup RSI === Level SELL - Level of the RSI for selling Period SELL - Period
FREE

The EA created to trading of True Point PRO indicator signals automatically: True Points EA has an active trading panel and shows the main parameters of the indicator and the Expert Advisor. True Points PRO EA has two types of orders. Both orders are opened on the signals of the True Points PRO indicator. The difference is that the first order can be closed at the specified Take Profit level or at the indicator signal. The second order is closed only on the signal of the indicator. You can

An indicator from the zigzag family with levels. First of all, I will point out arguments in favor of the advisability of using a level indicator. They give the trader the following benefits:
Alternative points of view - the level indicator helps to look at the levels from the side, compare them with several automatic systems, identify errors;
Saving time - reducing the cost of effort for self-building lines;
Exact mathematical calculation - quick calculation of levels, ratios of indicato

The utility places a grid of pending orders. You can select the number of orders in the grid, the step between orders, multiplier for the order size, SL and TP levels and the magic number. MT5 version of the utility is avaliable by the link - https://www.mql5.com/en/market/product/73489 If you like this utility, take a look at my other products - https://www.mql5.com/en/users/nina_yermolenko/seller
FREE

Search for an entry with low risk for trading by Lisek Waves Indicator. Using Lisek Waves Indicator can improve your trading performance. In it’s simplest form, this trading tool make it easy to s earch for an entry with low risk and to manage your trade and risk. Lisek Wave analysis is based on the notion that markets follow specific patterns called waves which are the result of a natural rhythm of crowd psychology that exists in all markets. You can avoid the loss from taking trades that are
FREE
The Scalping Project EA follows a scalping breakout strategy. It trades the breakouts from relative highs and lows. For the entry stop orders are used for the fastest possible execution. Profits can be secured by the adjustable trailing stop. Since the strategy works with small average profits it is highly suggested to trade with a low spread and commission broker. Trading costs are crucial here! The backtests shown in the screenshots were done with the default settings. There might be better or

Function Indicate Buy Sell Signals Indicate Strength of Buy Sell Signals This system is for both type of traders (Short & Long Term) Instead of Other Calculations, Parabolic Sar & Awesome are also used In Any time frame this can be use. What is in for Trader? Trading Switch: Short Term & Long Term Finally, we all knows that Forex Trading needs completely concentrate & proper cash management, So I never promising that my program will never give you loss but I tried well to provide good and respo
FREE

Draw and Sync Objects Multiple Charts 1. Draw objects by key press. ( You must: 1. Press Function key => 2. Click where you want to draw => 3. Draw it => 4. Press ESC to complete). (If you don't want to draw after pressing function key, you must press ESC to cancel). 2. Developing : Sync selected objects to multiple charts by button. 3. Developing: Hide objects that do not belong to the current symbol (Objects drawn with this indicator will belong to the symbol they are plotted
FREE

Indicator for the 4th strategy of the Pipsurfer EA. This indicator will allow the user to visually see the points of entry for strategy 4 of Pipsurfer. In the settings you will be able to adjust the parameters to mix and match to your trading style and find the settings that you want to either trade manually or tune the EA to do. Strategy 4 uses a market structure trend continuation approach to trading and looks for confirmed highs in downtrends and confirmed lows in uptrends to find great trend
FREE
学习如何在MetaTrader AppStore上购买EA交易,MetaTrader平台的应用程序商店。
MQL5.community支付系统支持通过PayPay、银行卡和热门付款系统进行交易。为更好的客户体验我们强烈建议您在购买前测试EA交易。
您错过了交易机会:
- 免费交易应用程序
- 8,000+信号可供复制
- 探索金融市场的经济新闻
注册
登录