YouTubeにあるマーケットチュートリアルビデオをご覧ください
ロボットや指標を購入する
仮想ホスティングで
EAを実行
EAを実行
ロボットや指標を購入前にテストする
マーケットで収入を得る
販売のためにプロダクトをプレゼンテーションする方法
MetaTrader 4のためのエキスパートアドバイザーとインディケータ - 36

Introducing the Super Pivot and Fibo Indicator: Your Ultimate Trading Companion Are you ready to take your trading to the next level? The Super Pivot and Fibo Indicator is here to revolutionize your trading strategy. This powerful tool combines key elements such as pivot points, Fibonacci retracement and extension levels, high-low values, and Camarilla points to provide you with a comprehensive and accurate analysis of the market. Key Features: Pivot Points: Our indicator calculates daily, weekl
FREE

Resistance and Support is an easy to use indicator to apply horizontal lines of resistance and support. There are two windows for adding levels. When you press the button, a line appears on the price chart. It is possible to double-click this line with the mouse to activate and move it, thereby changing the indicator readings. In the indicator menu there is a choice of possible alerts - no alert, alert on touching the level an alert for closing the candle after the level.
FREE

This is a modified Fractals indicator. It works similar the original Bill Williams' indicator, and is additionally enhanced with the possibility to change the top radius, in contrast to the standard radius of 2 bar. Simply put, the indicator checks the top and if it is the minimum/maximum in this radius, such a top is marked by an arrow. Advantages Adjustable radius. Use for drawing support and resistance levels. Use for drawing trend channels. Use within the classical Bill Williams' strategy or
FREE


Super MACD es un asesor experto avanzado diseñado para operar en el mercado financiero, centrándose en la estrategia del Moving Average Convergence Divergence (MACD). Este asesor ofrece la posibilidad de personalizar los niveles de Take Profit y Stop Loss en todas las operaciones, brindando así un control preciso sobre la gestión de riesgos y ganancias.
Parámetros recomendados Eur Usd M5 Características destacadas de Super MACD: Indicador MACD Optimizado: Super MACD utiliza una versión altamen
FREE

To get access to MT5 version please click here . - This is a conversion from TradingView: "Hull Suite" By "Insilico". - This is a light-load processing and non-repaint indicator. - You can message in private chat for further changes you need. note: Color filled areas and colored candles are not supported in MT4 version. Here is the source code of a simple Expert Advisor operating based on signals from Hull Suite . #property strict input string EA_Setting= "" ; input int magic_number= 1234 ; inp
To download MT5 version please click here . - This is the exact conversion from TradingView: "Linear Regression Candles" By "ugurvu". - This is a non-repaint and light processing load indicator - You can message in private chat for further changes you need. This is a sample EA code that operates based on bullish and bearish linear regression candles . #property strict input string EA_Setting= "" ; input int magic_number= 1234 ; input string Risk_Management= "" ; input double fixed_lot_size=

An “inside bar” pattern is a two-bar price action trading strategy in which the inside bar is smaller and within the high to low range of the prior bar, i.e. the high is lower than the previous bar’s high, and the low is higher than the previous bar’s low. Its relative position can be at the top, the middle or the bottom of the prior bar.
The prior bar, the bar before the inside bar, is often referred to as the “mother bar”. You will sometimes see an inside bar referred to as an “ib” and its
FREE

B acktest with set files from comments section (L a st comment) with method open price only.
Watch video and Turn ON Subtitles when watching! This EA contains Few stop out levels built in what makes it much safer than any other method! Never pay attention to the Stereotips. Any method can be risky if you use them without a Sense. Steady Ranger EA is an advanced automated channel trading system with potential to find out hundreds of profitable set files according to the back tests. This EA is n
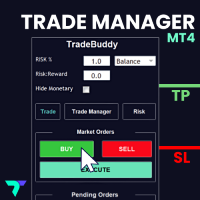
This adds an easy to use trading panel to your MetaTrader4 chart, enabling you to enter the market at lightning speed with your risk automatically calculated. Plus, it will help you automate your trade management with automatic & one click partial profits, stop loss to breakeven and more. Click here for the full Trade Buddy user guide If you want to test Trade Buddy before you purchase, please message us by visiting our profile and we will provide you with a 7 day free trial. Best of all, it’s c

The UNIVERSAL DASHBOARD indicator will eliminate the need of using dozens of indicators on dozens of charts. From one place you can monitor all the pairs and all the timeframes for each of the following indicators: MACD STOCHASTIC WPR RSI CCI You can also use any Custom indicator in the dashboard as long as it has a readable buffer. With a single click you can quickly navigate between charts, pairs and timeframes. Alerts will provide clear indication about what happens for your favorite pairs on
FREE

Multipair Analyzer - An expert advisor which analyze market structure across multiple currency pairs.
Its a tool which uses purely price action structure based trading strategy. Based on the market structure, the EA finds the optimal place to enter and can either take trade or can alert the user to take a better look. Just by placing the EA one one chart, all the other currency pairs are automatically analyzed. Based on its analysis it provide multiple messages . These messages can be easi

1分足から使える高精度のスキャルピング用逆張りサインツールです。
・すべての通貨ペア、時間足で利用でき、絶好のタイミングでのエントリー・チャンスをお知らせします ・ ボリンジャーバンドにタッチしてからの反転を 基本戦略とし、 独自のアルゴリズムを加えることで、精度の高い反転ポイントでサインを発信します ・勝敗判定機能により 直近の相場環境に対するこのインディケータの有用性を確認することができます ・ 初心者から上級者まで設定不要ですぐにお使いいただけます ・本サインツールの性能を確認いただくための専用EAを提供いたします。コメント欄をご覧ください
1分足での使用にも耐えるので、トレード頻度を高めることができます。またより高い時間足での使用では精度の向上が期待できます。トレンド・フィルターの機能を利用することで、トレンド方向での押し目買い、戻り売りに際し最適なタイミングでトレードすることができます。
設定項目は以下の通りです。 Bollinger Bands Period
Bollinger Bands Deviation
Bollinger Bands Shift
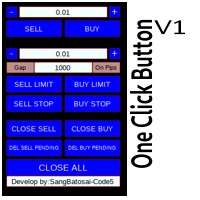
Simple button panel of trade on your chart with OneClick V1 Trial version. This trade panel will make it easier for you.
Equipped with several functions that make it very easy for you. More tools on OneClick VZ version, see here.
This version includes: Open Order Buy Open Order Sell Open Pending Order [Buy Limit - Buy Stop - Sell Limit-Sell Stop] Close ALL orders
Close Order Buy Close Order Sell Delete Pending Order [Buy Limit - Buy Stop - Sell Limit-Sell Stop] ENJOY IT!!! ONE CLICK V1 [TRI
FREE

Fractal is one of the main indicators in a number of strategies. Volume Fractals has expanded the functionality of the standard indicator version. The product features fractals sorting and displaying fractals representing both price and volume extreme points.
Application Stop losses Reversal signals Placing pending orders for a fractal breakout
Options Bars of history - number of chart bars the indicator is displayed for Left side minimum bars - minimum number of bars to the left of the frac
FREE

RSI indicator with signal lines, at the intersection of which a corresponding notification will be issued, which can be in the form of a normal alert, or in the form of a user sound file.
The indicator also has the function of sending push-notifications and email notifications at the intersection of these levels.
The values of the levels can be set independently in the indicator settings, and, if desired, they can be changed and configured directly in the indicator window. To check the op

Mean Reversion Supply Demand Indicator Mean Reversion Supply Demand is the indicator to detect the important supply demand zone in your chart. The concept of supply demand trading relies on the quantity mismatching between buying and selling volumes in the financial market. Typically, supply demand zone serves to predict the turning point. The wave pattern, for any supply demand zone to work as an successful trade, looks like the price must touch the base zone, move away and then return to zone

Introduction This indicator detects volume spread patterns for buy and sell opportunity. The patterns include demand and supply patterns. You might use each pattern for trading. However, these patterns are best used to detect the demand zone (=accumulation area) and supply zone (=distribution area). Demand pattern indicates generally potential buying opportunity. Supply pattern indicates generally potential selling opportunity. These are the underlying patterns rather than direct price action. T
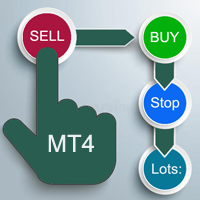
A "simple design" trading panel, which is characterized by small byte size, low CPU usage, simple steps, and quick operation, 1 to 2 clicks to complete a functional operation,
saving time and increasing efficiency . The panel is easy to use, and it is not complicated to set parameters, which is in line with traders' habits. At the same time, its compact-
design, clear at a glance, and comprehensive functions are a powerful tool for manual trading! Key features of the panel: Click "Bid Pri

This indicator is a simple tool to spot a possible trend.
When the ribbon below the price bars, It will turn to Green color and the trend is seen to be bullish When the ribbon above the price bars, it will turn to Red color and the trend is seen to be bearish. It can be used a either Entry Signal Exit Signal or trailing stop, so it is very versatile. By default color : Green is UP trend and Red is Down trend and this work perfect with Bar4Colors.ex4
FREE

This EA implements the EMA 8/18 strategy, which is used by many traders. Brief description of the strategy: The Buy is determined when the EMA 8 indicator crosses the EMA 18 from below, with the price moving more than 50 points from the crossing. The buy position is opened when the price touches the EMA for the first time, after that, as the price rises, the trade is maintained by a trailing stop with a step of 30-35 points. The opposite is for opening a sell position. The parameters of the fast

This indicator is the basis for an Expert Advisor that can be categorized as "almost Grail". See details below. This indicator displays the projection of the Renko chart on the price chart. This projection is displayed as a stepped line, not as "bricks" (rectangles). See slides 1 and 2. Abbreviated name of the indicator: LRC – L ine of R enko on the price C hart. The principle of its construction is very simple. First, a grid of horizontal lines (levels) is bu
FREE

zGold is an Expert Advisor built, designed and configured to be used with Gold/XAUUSD . The system uses custom Trend algorithms to find key entry points into the market and executes them once the right criteria is met and it uses a mixture of Indicators and Price Action. The Expert Advisor also has a custom filtering algorithm to disregard false signals and work around possible market reversals. To combat spread related issues the closing strategy is based around account profits, totals and cur
FREE
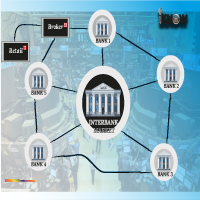
IPDA AND PD RANGES. Interbank Price Delivery Algorithm (IPDA) Range Liquidity and trades in the FX market take place in a decentralized manner as banks, brokers and electronic communication networks (ECNs) interact with one another to set prices. In FX, and ECN is a trading platform or electronic broker that hosts bids and offers and transmit them to users worldwide. ECN broadcasts a price around the world as various participants leave orders to buy and sell. Banks provide streaming prices base

This indicator identifies No Demand –No Supply candles to your chart and plots volume bars colored according to the signal. It can be applied to all timeframes or to a specific one only. It can also be used as regular volume indicator but with exceptional future of WEIGHTED VOLUME. Furthermore is has an alert notification, sound and email when a signals occurs. The indicator does not repaint but the alert will come on two candles back due to the definition of No Demand No Supply. The VSA (Volum

Get the MT5 version here ! Automate your MACD strategy!
This EA alerts and/or places orders according to MACD strategies with additional filters. It means that you can use it by 2 different ways: Receive alerts based on your MACD strategy with filters on multiple symbols simultaneously in a single chart window; Choose the fully automated mode and let EA place orders based on your MACD strategy, filter choice and money management. This EA works with all broker symbols and contains multi-symbol
This is a classic Expert Advisor with the most popular trading functions. But the main feature is that the Expert Advisor is completely generated with the help of a script according to the signals of an arrow indicator. You can get the same EA, but which will enter on your indicator . And with full source code and the possibility of unlimited use, including sale on Market. This version with a full set of functions, but in the process of creating an EA, you can form your own set of settings.
FREE

A trend indicator is a hybrid of several well-known indicators that process data sequentially with signaling a trend change. Final processing of the AMka indicator data. The indicator is conventionally not drawing - upon restarting, it can change some of the chart data, but if you do not touch it, it will not redraw. It is possible to issue an alert, sound, send an e-mail or a message to another terminal when the trend changes.
FREE

RaysFX StepMA+Stoch Caratteristiche Principali Adattabilità: Il nostro indicatore RaysFX StepMA+Stoch è progettato per adattarsi alle mutevoli condizioni di mercato. Utilizza l’Average True Range (ATR) per misurare la volatilità del mercato e regolare di conseguenza le sue strategie di trading. Precisione: L’indicatore genera segnali di trading quando la linea minima incrocia la linea media. Questi segnali sono rappresentati come frecce sul grafico, fornendo punti di ingresso e di uscita chiar
FREE

The Official "GRID EA" Using PipFinite Trend PRO A Smart Trend Following EA Using Trend PRO Indicator Signals In a Unique Grid Strategy. Trend Grid EA takes the signal of Trend PRO Indicator on the first trade then builds succeeding trades if the move goes against it. The innovative grid algorithm manages each position to ensure every basket is closed in a net positive profit.
Settings Used & Input Descriptions
Information Here https://www.mql5.com/en/blogs/post/743648
Features Built

Heikin-Ashi-Sniper is a perfect addition to your portfolio. It is meant to be traded on EURUSD on H1 Timeframe.
It uses Heikin-Ashi High and Low/High of Monthly timeframe to determine optimal entry signals while having a reasonably low drawdown More EA´s will be published shortly to complete the Portfolio. The EA Trades not very frequently it waits for the right chance and places the order. The rest of the time, your capital is free to be traded on
other strategies Please see backtest results
FREE
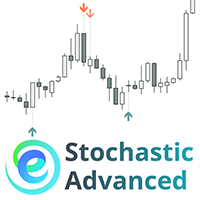
The " Stochastic Advanced " indicator displays the signals of the 'Stochastic" indicator directly on the chart without the presence of the indicator itself at the bottom of the screen. The indicator signals can be displayed not only on the current timeframe, but also on a timeframe one level higher. In addition, we have implemented a filter system based on the Moving Average indicator.
Manual (Be sure to read before purchasing) | Version for MT5 Advantages
1. Displaying the signals of the "Sto

Best Night Scalper EA Supported currency pairs: GBP/CHF, EUR/CHF, GBP/USD, USD/CHF, EUR/CAD
Recommended timeframe: M15 The EA does not use martingale or grid. It only enters a trade with market orders and uses a stop loss for each trade! Features: Magic: If set to a number = 0 it will calculate MagicNumber automatically GMT_Open_Hour = 22; GMT_Close_Hour = 02; LotSize = 0.0 if lotsize=0, use risk setting. Risk = 10; 1000$ lot 0.1 UseFreeMargin

Displays multiple indicators, across multiple timeframes and symbols to give a comprehensive overview of the market. Uniquely, the indicators are configurable and can include custom indicators, even those where you just have the ex4 file or those purchased from Market. Standard indicators can also be selected, the default being ADX, CCI, market price above/below Moving Average (MA), Moving Average Cross (MAX), MACD, Momentum (MOM), OsMA, RSI, Parabolic SAR, William's Percentage Range (WPR). Use

The purpose of this new version of the MT4 standard indicator provided in your platform is to display in a sub-window multiple timeframes of the same indicator. See the example shown in the picture below. But the display isn’t like a simple MTF indicator. This is the real display of the indicator on its timeframe. Here's the options available in the FFx indicator: Select the timeframes to be displayed (M1 to Monthly) Define the width (number of bars) for each timeframe box Alert pop up/sound/ema
FREE
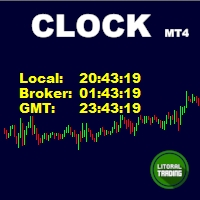
Simple indicator that draws the market hours on chart (broker, local and GMT). Functions: Horizontal distance - from border. Vertical distance - from border. Color - text color. Font - text font. Size - text size. Corner - which chart corner will be drawn. Show seconds - show or hide seconds. Draw as background - candles front or back. Label local - text before local time. Label broker - text before broker time. Label GMT - text before GMT time. Object ID - identification from object
FREE

Rsi indicator and Stochastic Combined into one indicator , the Supreme StochRsi doesnt repaint / Back-paint / delay. can be used as overbought oversold strategy , or trend following on 50 level cross. if you like this indicator please check my Supreme Trendhisto: here , and my Supreme Diamond indicator : here ========================================================================= Parameters : Stochastic K and D value , Stochastic period Rsi Period Rsi price ====================================
FREE

This is an unconventional version of the Heiken Ashi Smoothed indicator implemented as lines rather than a histogram. Unlike a usual histogram, the indicator draws the readings of the two moving averages in the form of colored lines.
Example If the candle crosses two indicator lines upwards, a trend is assumed to be changing from bearish to bullish. If the candle crosses two indicator lines downwards, a trend is assumed to be changing from bullish to bearish. The indicator is good at displayin
FREE
HMA Grid EA is a grid system which analyzes trend based on the Hull Moving Average (HMA) indicator. Unlike the Simple Moving Average (SMA) the curve of HMA attempts to give an accurate signal by minimizing lags and improving the smoothness. This EA proposes two trading strategies which combine a slow period HMA to identify the main trend and a short period HMA to identify short trend reversal movement. This combination make usually sell and buy signals accurate and in case if the trend reverse w
FREE

Ultimatum Breakout - this trading system uses the strategy of valid breakouts, using multiple custom indicators for eliminating bad signals. The EA uses a very small SL so the account is always protected from equity drawdown with a very low risk-per-trade. The EA is fully adapted: calculates the spread — for pending orders, stop loss, trailing stop, breakeven. It was backtested and optimized using real ticks with 99,9% quality. It has successfully completed stress testing. No Martingale. No arbi
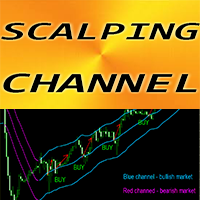
MT4用FXインジケーター「スキャルピングチャンネル」
スキャルピング チャネルには ATR ベースのボラティリティ ボーダーがあります スキャルピング取引に最適です: ミドルラインで保留中の指値注文を介して取引に参加します 緑色の安定した上昇チャネルが発生し、少なくとも1つのローソク足が上端より上で閉じられた場合、強気のエントリーを検討してください(写真を参照) 赤色の安定した下降チャネルが発生し、少なくとも1つのローソク足が下限よりも下で閉じられた場合、弱気のエントリーを検討してください(写真を参照)
// さらに優れたエキスパートアドバイザーとインジケーターはここから入手できます: https://www.mql5.com/en/users/def1380/seller // また、収益性が高く、安定していて信頼性の高いシグナル https://www.mql5.com/en/signals/1887493 も大歓迎です。 当MQL5サイトのみでご提供しているオリジナル商品です。
Oscillators and Volatility: Oscillators like RSI and Stochastic are particularly useful in assessing the market sentiment and potential turning points in volatility. However, it's essential to use them in conjunction with other indicators and analyses for a comprehensive view. Divergences between price movements and oscillator readings can be powerful signals. For example, if a volatility index is making new highs, but the oscillator fails to confirm these highs, it may indicate weakening momen
FREE

Consolidation is when price is moving inside a clear trading range. When prices are consolidated it shows the market maker placing orders on both sides of the market. This is mainly due to manipulate the un informed money. This indicator automatically identifies consolidation zones and plots them on the chart. The method of determining consolidation zones is based on pivot points and ATR, ensuring precise identification. The indicator also sends alert notifications to users when a new consolida
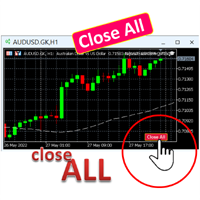
A simple button to completely close all existing open trades (both Buy and Sell) on the current chart .
Warning : Once the button is pressed, all open trades on the current chart will be deleted immediately without any more questions or dialogue.
Use this utility very carefully. We recommend that you do a trial of removing open trades on a demo account first, before trying to use this utility on a real account.
FREE

This multicurrency strategy simultaneously determines the strength of the trends, entry points and the take profit levels for each trade. The indicator can determine entry points on any trading period from M1 to D1. For the convenience of users, the indicator renders the entry point (in the form of an arrow), recommended take profit levels (TP1, TP2, TP3) and the recommended stop loss level (SL1, SL2). The options for using the strategy are described below. Full description of the indicator Cosm

This tools is design to easily forecast the projection of the current trend through the inputs of Zigzag and get out of the market when the trend do not the ability to maintain it's volatility to go further... the indicator gets the initial and final price from the value of zigzag automatically by adjusting the intdepth of zigzag. You can also switch from Projection to Extension from the inputs tab of indicator.
FREE

これはThe News Filterを使用するために必要なスクリプトです。このスクリプトはフィルタリングしたいチャートを選択し、ニュース・フィルタ・プログラムに入力を送信します。すべての入力はそのチャートに固有なので、チャートごとに異なる入力を柔軟に設定できます。ニュース・フィルター(無料デモ)へのリンクは以下にあります: ニュースフィルターガイド+ダウンロードリンク
ニュース選択
ニュースソースは、Forex Factoryの経済カレンダーから取得されます。 USD、EUR、GBP、JPY、AUD、CAD、CHF、NZD、CNYなど、任意の通貨数に基づいて選択できます。 Non-Farm(NFP)、FOMC、CPIなどのキーワード識別に基づいて選択することもできます。 影響レベルによってフィルタリングするニュースを選択することができ、低、中、高の影響範囲から選択できます。 自動モードでは、チャートに関連するニュースのみが選択されます。 ニュースソースは、最新のニュースデータを確実にするために、自動的に1時間ごとに更新されます。 各ニュースの影響レベルごとに別々の入力があり、ニュ
FREE
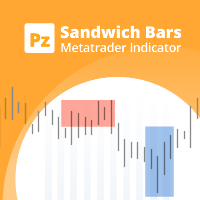
This indicator detects Sandwich Bars of several ranges, an extremely reliable breakout pattern. A sandwich setup consists on a single bar that engulfs several past bars, breaking and rejecting the complete price range. [ Installation Guide | Update Guide | Troubleshooting | FAQ | All Products ] Easy and effective usage Customizable bar ranges Customizable color selections The indicator implements visual/mail/push/sound alerts The indicator does not repaint or backpaint The indicator could not b
FREE

Contact me after payment to send you the User-Manual PDF File. Divergence detection indicator with a special algorithm. Using divergences is very common in trading strategies. But finding opportunities for trading with the eyes is very difficult and sometimes we lose those opportunities. The indicator finds all the regular and hidden divergences. (RD & HD) It uses an advanced method to specify divergence. This indicator is very functional and can greatly improve the outcome of your trading. Thi
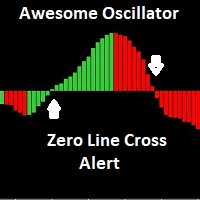
The Awesome Oscillator (AO) is an indicator used to measure market momentum. AO calculates the difference between a 34 Period and 5 Period Simple Moving Average. The Simple Moving Averages that are used are not calculated using closing price but rather each bar's midpoints. This indicator has email and pushup "mobile" features Alert, for any suggestions, please don't hesitate, thanks
FREE

HFT EA -DE40, US30, US500, USTEC
-IC Market Recomment Broker -EA can Trade with every Broker
only DE40 with this Standart Settings (Change the Compare Count to 3 or higher 10 for better Results) for other Indizes or Pairs Set the Stop Loss x10 to actuall Spread or higher, and Set Take Profit x40 from Spread, PriceOffset x4 from Spread or higher Recomment M5, M15, M30, H1, D1 minimum 1000$/€ ...Lot 1 in first 3 Weeks Expert have auto Lot Settings, to delete auto Lot...Set VolumePercent to Ze
FREE

The Multi-Timeframe High Low Points (MTF High Low Points) indicator is a powerful tool for traders using MetaTrader 4 (MT4) to analyze price movements across different timeframes. This versatile indicator helps traders identify significant support and resistance levels by displaying the highest and lowest price points within a specified number of bars on multiple timeframes simultaneously. Key Features: Multi-Timeframe Analysis: MTF High Low Points allows traders to monitor high and low price le
FREE

A supply and demand indicator designed with a minimalist trading strategy based on the nature of the market. The Bull zone is a strong support area, and the Bear zone is a strong resistance area. When a Bull zone was breakout, it becomes the "base" of the Bears and vice versa. When the price meets these areas, there is a high probability that the price will turn around, so we call them Obstacles. It is a suitable indicator for traders interested in manual price action and algorithmic trading up

Synchronize objects from one chart to multiple charts. Synchronize objects from one chart to multiple charts. 1. Allows automatic synchronization of new and edited objects to other charts. 2. Allows synchronization of all objects on the chart to other charts at the current time. 3. Allows setting the charts to synchronize based on the position of the chart in the MT4 window. Version 1.2: Allow set list of object names that you don't want to sync (Separated by commas ",")
Allow set 5 types of
FREE

TILLSON MOVING AVERAGE Also known as TMA or T3 indicator. It is a moving average that uses EMA and DEMA in its formula and is calculated with the 3rd degree Binomial expansion. Pros; 1- erroneous signals encountered in other moving averages ( continuous zig zag ) has been reduced as much as possible. 2- prevented the delays seen in classical moving averages . 3- Very successful in trends Cons 1- It is not effective in horizontal markets. Setting parameters; period ; Altho
FREE
The Visual Order Tracking (VOT) EA makes trade history and performance metrics visible on the chart in four ways: 1) Draw History of closed and open trades with arrows, lines and trade result numbers (pips, $ profit, % profit, % change); 2) Trade Manager to show Open, SL and TP levels as vivid horizontal lines with dynamic specs and partial closing options; 3) Summary Trade Panel to show sortable table of open and closed trade summaries by symbol, lots, pips, profit and advanced stats; and 4)

High End algorithm, Super Intelligent Strategy for you. WinWiFi Fund Ai Robot is a safe system for Forex and Crypto currencies trading. Developed exclusively for the XAUUSD pair(GOLD), any currency pairs and any broker. Try now!
The Ai Robot is designed to operate in the XAUUSD (GOLD) and any currencies market, entering only when there are high probabilities of success and certain unique conditions. The Ai Robot is based on a robust, profitable strategy and NO MARTINGALE. No more indicator.

The Candle High Low Exit indicator uses the highest high and the lowest low of a range to draw trailing stop lines (orange under buys, magenta over sells) that advance with the trend until the trend changes direction. Moreover, the trailing stop lines are generated to support the order’s trend direction (long or short): In an upward trend, the long trailing stop line (orange line under buy) appears and advances upward until the close crosses under the line.
In a downward trend, the short tra
FREE
ETM Testing Easy Trade Manager is an advanced trading utility built based on 3 simple & most wanted basic trading functions – Risk Reward Calculation, Smart Partial Closing & Unique Magic Trail Algorithm . Automatic Lot Calculation Trade with % of Balance,Fixed Amount or Fixed lots .
Lot size will be automatically calculated if you use % of Balance or Fixed Amount to trade. 4 Breakeven Options Select from FOUR SMART AUTOMATED BREAKEVEN options suited for novice traders or professionals availab
FREE

Blahtech Moving Average indicator is a multitimeframe version of the standard Moving Average indicator. It is also enhanced with customisable alerts, period breaks and other configuration options. The 50 day and 200 day moving averages are widely followed by investors and traders, with breaks above and below the MA lines considered to be signals of interest. Links [ Install | Update | Training | All Products ]
Feature Highlights Up to three timeframes Configurable calculation variab
FREE
KT Murrey Math robot incorporates a trading strategy that explicitly trades the price bars that crossed above or below a Murrey Math level. Entries: A buy order is placed when a bar closes above a Murrey Math level. A sell order is placed when a bar closes below a Murrey math level. Exits: EA places the stop-loss and take-profit always at the subsequent Murrey Math levels.
MT5 Version is available here https://www.mql5.com/en/market/product/45406
Features
This EA combines a simple Murrey

Based on famous and useful indicator - Super Trend, we add some features to make this Indicator much easier to use and powerful. Ease to identify the trend of any chart. Suitable for both Scalping & Swing Better to use in the trending market be careful in sideway market, it might provide some fake signals Setting: ATR Multiplier ATR Period ATR Max Bars (Max 10.000) Show UP/DOWN node Nodes size Show Pull-back signals Pull-back filter ratio Period of MA1 Mode of MA1 Period of MA2 Mode of MA2 A
FREE

Modified oscillator MACD. A classic indicator that combines a trend indicator with an oscillator to detect entry points. Has a multi-timeframe panel and 3 types of notifications
Benefits:
Works on all instruments and timeseries Trend indicator with oscillator for inputs Multi-period panel on all timeframes Pluggable arrows when signals appear Three types of notifications: push, email, alert
MT5 version -> HERE / Our news -> HERE
How the indicator works:
AW Classic MACD - Indicato
FREE

Peak Trend Day Limits
Order type Stop
Entry Level High/Low previous day
Entry signal MACD-based
Stop Loss Indicator based. Min 30 pip, max 200 pip
Take profit none
Trailing stop ATR-based
Exit after X bars
Exit F riday 10 pm broker time
Trading rules are checked only on bar open
Backtest performed with StrategyQuant X
GBPJPY - EURJPY
Data Source Dukascopy from 2010 to 2024 February 02
Timezone UTC+02 (European DST)
Precision 1 minute tick simulated
Timeframe H1
Sprea
FREE

Looking for entry points along the local trend without repaint! Arrows indicate entry points. Based on classic indicators. The indicator is easy to use. Settings Наименование Описание Frequency factor Signal frequency. The less, the more often.
This affects the quality.
Recommendations Recommended for use on major currency pairs. Timeframe from m5, m15, m30 Subscribe to my telegram channel, where we discuss intraday trading, ideas, indicators, etc., a link in my profile contacts.
FREE

High End algorithm, Super Intelligent Strategy for you. Ava Ai Robot is a safe system for Gold, Forex, Crypto currencies, CFD trading. Developed exclusively for the XAUUSD pair(Gold), any CFD pairs and any broker using same time zone. Try now!
The Ai Robot is designed to operate in the XAUUSD (Gold) and any CFD market, entering only when there are high probabilities of success and certain unique conditions. The Ai Robot is based on a robust, profitable strategy and NO MARTINGALE. No more in

A simple and effective trend indicator. It will be a good assistant when trading. A minimum of understandable settings. Put it on a chart and set it up Good to combine with other indicators. I will post another trend indicator soon. The combination of these two indicators gives good results. Works on all timeframes. Suitable for any couple. Experiment, adjust, observe. Filter by higher timeframes.
FREE

After 7 years I decided to release some of my own indicators and EAs for free.
If you find them useful please Show support with a 5-star rating! Your feedback keeps the free tools coming! See other my free tools as well here
_________________________________ Bollinger %B Indicator for Enhanced Forex Trading Analysis The Bollinger %B Indicator, expertly crafted in MQL4, is a dynamic tool designed to revolutionize forex trading analysis. Leveraging the power of Bollinger Bands
FREE

AutoSTPending - Expert Advisor for Automatic Stop Loss and Take Profit
The AutoSTPending expert advisor automatically creates or modifies the Stop Loss and Take Profit levels configured in the properties. It is a user-friendly and easy-to-understand tool. With AutoSTPending, you can simplify and streamline your trading operations by allowing the expert advisor to automatically set and adjust your Stop Loss and Take Profit levels. This allows you to focus on other activities while maintaining e
FREE
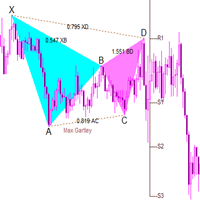
The full purchase discount is currently in progress! The best partner for any trader! This indicator is a classic butterfly indicator (harmonic trading). By default, it can identify 20 patterns and give prompts. You can also add custom shape parameters for custom prompts , prompting appropriate stop loss and profit levels. The built-in algorithm of this indicator is unique and is a unique band algorithm. Index characteristics Gartley pattern, also known as Gartley "222", was
MetaTraderマーケットが取引戦略とテクニカル指標を販売するための最適な場所である理由をご存じですか?宣伝もソフトウェア保護も必要なく、支払いのトラブルもないことです。これらはすべて、MetaTraderマーケットで提供されます。
取引の機会を逃しています。
- 無料取引アプリ
- 8千を超えるシグナルをコピー
- 金融ニュースで金融マーケットを探索
新規登録
ログイン