Смотри обучающее видео по маркету на YouTube
Как купить торгового робота или индикатор
Запусти робота на
виртуальном хостинге
виртуальном хостинге
Протестируй индикатор/робота перед покупкой
Хочешь зарабатывать в Маркете?
Как подать продукт, чтобы его покупали
Торговые роботы и индикаторы для MetaTrader 4 - 38

This EA uses 3 custom indicators consisting of Gann HiLo, ADX, Heiken Ashi Indicator. Gann used angles and various geometric constructions to divide time and price into proportionate parts. Gann indicators are often used to predict areas of support and resistance, key tops and bottoms, and future price moves. Gann studies have been used by active traders for decades, and even though the futures and stock markets have changed considerably, they remain a popular method of analyzing an asset's dire
FREE

EA Gideon - это советник торгующий НА НОВОСТЯХ и НА СОБЫТИЯХ, которые сильно влияют на рынок, но происходят не по расписанию! То есть советник открывает отложенные ордера Sell Stop и Buy Stop при резком изменении цены в какую-либо сторону и закрывает их автоматически с желаемой вами прибылью. А мы с вами знаем, как частенько изменяется цена при какой-либо "удачной" новости, насколько она может подняться либо опуститься. Также данный робот страхует ваш депозит, выставляя SL, параметры которого вы

Уникальность данного индикатора заключается в алгоритме учёта объёмов: накопление происходит непосредственно за выбранный период без привязки к началу дня. Последние бары можно исключить из расчёта, тогда текущие данные будут меньше влиять на значимые уровни (объёмы), образованные ранее. Для более точного расчёта по умолчанию используются данные с графика М1. Шаг распределения ценовых объёмов регулируется. По умолчанию правая граница отображения установлена на бар, соответствующий началу испол
Обновлять! На уровни 100 и 200 добавлены стрелки.
Этот индикатор точен для доступа к экстремумам и поддержкам для позиций на покупку, в первую очередь, для 1-минутных таймфреймов. Можно использовать и другие таймфреймы, но уровни другие. Это лучший осциллятор, и вы можете сравнить его с другими, чтобы увидеть разницу.
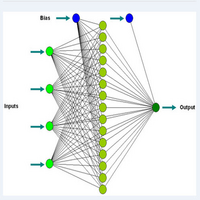
Внутридневная торговля с использованием нейросетевых концепций. Этот индикатор использует элементарные формы нейросетей для генерации сигналов на покупку и продажу. Используйте и
Индикатор находит пробои, используя стратегию обнаружения баров. Параметр WaitForBarClosed подтверждает сигналы (true), но иногда включается чуть позже. чем при false. Подходит для всех таймфреймов. Синей линией показан тренд. Установите индикатор на любой график. Установите желаемый параметры индикатора в окне его свойств. Нажмите OK для подтверждения и продолжения работы.
Параметры Line_Break - период, рекомендуемые значения то 3 до 21. Чем больше период, тем более сглаженной будет линия инди
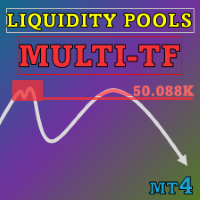
Special offer : ALL TOOLS , just $35 each! New tools will be $30 for the first week or the first 3 purchases ! Trading Tools Channel on MQL5 : Join my MQL5 channel to update the latest news from me Индикатор Liquidity Pools – это продвинутый инструмент, который определяет и отмечает потенциальные зоны ликвидности на графике, анализируя области с частыми касаниями и объемом торговли в каждой зоне. Этот инструмент дает трейдерам полное представление о рыночной динамике, помогая им пр

Профессиональный форекс робот скальпер. Робот открывает в течении одного дня от 1 до 5 торговых ордеров. Каждый ордер страхуется СтопЛоссом и ТейкПрофитом. После открытия ордера, робот сопровождает его с помощью ТрейлингСтопа (СтопЛосс постоянно подтягивается вслед за ценой, чтобы уменьшить риск потери и вывести сделку в прибыль). Каждый открытый ордер постоянно анализируется с помощью специального виртуального модуля управления ордерами. Этот модуль с приходом каждого нового тика, постоянно ана
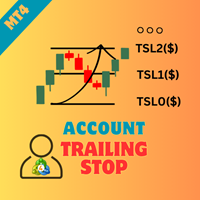
Account Trailing Stop Manager MT4 Description:
The "Account Trailing Stop Manager MT4" EA is designed to automatically calculate and remember the profit of the entire account or specific magic number, and trail it like a trailing stop loss. When the current profit becomes lower than the last saved profit, it will close all trades. This EA provides a convenient way to manage trailing stops for your account. For detailed documentation Overall Settings/Input Guide High Level Overview of Feature
FREE

Представленный продукт является трендовым индикатором технического анализа который позволяет открыть позицию в самом начале значительного движения цены. Важнейшими качествами представленного индикатора является: Способность максимально долго следовать тренду для получения всей потенциальной прибыли; Минимизация потенциальных убытков при развороте тренда или значительной коррекции. Индикатор имеет широкий спектр настраиваемых параметров позволяющих эффективно использовать его на любом рынке. Инд
FREE
Echo One:
The provided robot is a result of several Test of trading many many strategies,various indicators of forecasting,
To make the best decision for making profits in markets. By combining several strategies and algorithms in this robot, at changing each tick price, with the utmost precision and speed Real account has been opened where it will be possible to analyze the entire history, as well as constantly, in real time, monitor all current results:
https://www.mql5.com/en/signals/71523
FREE
Discover our sophisticated Expert Advisor (EA) designed for the MetaTrader 4 (MT4) market: IT Bollinger Bands. This free EA exploits a trading strategy based on Bollinger Bands, offering a powerful approach to optimizing your operations in the financial market. Key Features : Bollinger Bands Strategy: Our EA uses Bollinger Bands, a popular approach in technical analysis. Based on the period (20), the standard deviation (2), and the shift of the bands, our EA identifies trading opport
FREE
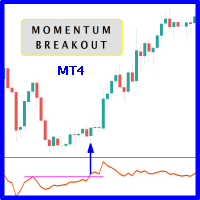
When prices breakout resistance levels are combined with momentum oscillator breaks out its historical resistance levels then probability emerges to record farther prices. It's strongly encouraged to confirm price breakout with oscillator breakout since they have comparable effects to price breaking support and resistance levels; surely, short trades will have the same perception. Concept is based on find swing levels which based on number of bars by each side to confirm peak or trough and in tu
FREE

Робот скальпер. Настройки по умолчанию для GBPUSD, период М5. Робот открывает каждый день от 10 до 50 торговых сделок. ТейкПрофит устанавливается физический, а СтопЛосс указывается как % от депозита. Так же робот сопровождает сделки с помощью ТрейлингСтопа. Соотношение сделок закрытых по ТейкПрофиту и СтопЛоссу примерно 90/10. Так же робот хорошо отрабатывает разные новостные события и при выходе важных новостей, если цена идет не в сторону технического прогноза, робот хорошо страхуется и старае
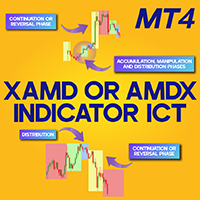
XAMD/AMDX Indicator ICT MT4
The XAMD/AMDX ICT indicator is a specialized tool for MetaTrader 4, designed to highlight possible market trend shifts. It segments price movement into three distinct phases—Accumulation (red), Distribution (blue), and Manipulation (green)—using a color-coded box system. Unlike the traditional AMD ICT indicator, this version introduces an additional "X" phase, which serves as a marker for either trend continuation or reversal.
XAMD/AMDX Indicator Specifications
Bel
FREE

Индикатор рисует уровни Фибоначчи согласно ЗигЗагам, Торговым Сессиям, Фракталам или Свечам (включая нестандартные периоды: Год, Полугодие, 4 Месяца, Квартал, 2 Месяца). Уровни перерисовываются заново, каждый раз, после закрытия текущего бара. Есть возможность включить предупреждения при пересечении заданных уровней. Также вы можете анализировать уровни на истории. Для этого нужно задать количество Фибо-уровней в опции "Number of Fibo in the past".
Параметры Calculate Fibo according to — режимы

It uses three moving averages to analyze the market and generate buy and sell signals. The first and second moving averages are of the simple type with respective periods of 20 and 50. They are used to determine entry and exit points.
The third moving average is of the simple type with a period of 200. It is used to indicate the trend direction based on its position relative to the price. The robot only takes signals that are consistent with the trend, allowing it to reduce the number of false
FREE

BeST_ Classic Pivot Points is an MT4 Indicator that is based on the widely known and definitely classic Pivot Point of a market prices activity. A pivot point is calculated as an average of significant prices (high,low,close) from the performance of a market in the prior trading period. If the market in the following period trades above the pivot point it is usually evaluated as a bullish sentiment, whereas trading below the pivot point is seen as bearish. A pivot point and the associated suppo
FREE

T-Explorer – оптимизируемый в реальном времени инструмент для MetaTrader 4, предоставляющий данные для торговли на десяти наиболее популярных и надежных технических индикаторах на нескольких таймфреймах. Наши модели машинного обучения рассчитывают оптимальные переводы и настройки каждого индикатора для генерации надежных сигналов. Пользователи могут выбрать нужные таймфреймы и режим ( FAST, MEDIUM, SLOW ) для используемых индикаторов. T-Explorer объединяет и оптимально сочетает результаты всех и
FREE

Bollinger Bands Tunnel EA is a free expert advisor developed with the idea to be useful for traders who love to trade using the popular indicator Bollinger Bands. Bollinger Bands Tunnel EA has very simple trading logic. It trades inside of the Bollinger Bands indicator. When the price crosses the Bollinger Bands upper line and reverses, the EA opens a SELL position. When the price crosses the Bollinger Bands lower line and reverses then the EA opens a BUY position. The algorithm of closing the
FREE
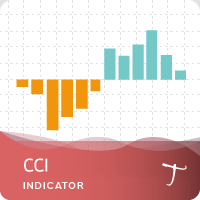
28-символьная, мультитаймфреймовая мощная панель для полного обзора рынка Настраиваемые оповещение о сигналах на покупку/продажу, push-уведомления, оповещения по email и всплывающее сообщение на экране. Обозначение сигналов на покупку и продажу Двухцветная трендовая гистограмма. Commodity channel index (CCI) - это осциллятор, изначально введенный Дональдом Ламбертом в 1980 году. CCI измеряет текущий уровень цены по отношению к среднему уровню цены в течение заданного периода времени. CCI находи
FREE

The Multi Trendlines indicator automatically draws the dominant trendlines on the current chart. The indicator looks for the 5 best Up trends and the 5 best Down trends as at the current price, drawing each trendline if filter conditions are met. The trendlines are named "Trendline"+[Direction]+Symbol()+TrendlineSequenceNumber For example: The second Up trendline on a EURUSD chart would be named "TrendlineUpEURUSD2". To get its current value would be: ObjectGet("TrendlineUpEURUSD2",OBJPROP_PRI
FREE
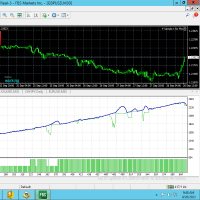
It's only good works on EURUSD M30 Timeframe. This robot is profitable. This robot requires minimum deposit of $1000 for small DD . You can get good results with it. You can test it first. You can increase the equity percentage. It will increase the volume in a certain ratio as the equity increases. You don't need to increase the volume by yourself. For the first few days, use the equity volume setup in this robot and then test and increase the equity setting. Another Same MT5 Product link: htt
FREE

Целью этой новой версии стандартного MT4 индикатора, входящего в поставку платформы, является отображение в подокне нескольких таймфреймах одного и того же индикатора. См. пример, приведенный на рисунке ниже. Однако индикатор отражается не как простой индикатор MTF. Это реальное отображение индикатора на его таймфрейме. Доступные настройки в индикаторе FFx: Выбор таймфрейма для отображения (от M1 до MN) Установка ширины (количество баров) для каждого окна таймфрейма Всплывающее оповещение/звуков
FREE

Семафорный индикатор основан на стандартном индикаторе RSI, на который наложен индикатор Envelopes, который показывает конверт или границы колебания индикатора. Это версия индикатора RSI vs Envelopes который рисуется только в окне символа . Сигнал на продажу возникает, когда верхний конверт/граница пробивается индикатором RSI сверху вниз. Сигнал на покупку возникает, когда нижний конверт/граница пробивается индикатором RSI снизу вверх. Индикатор имеет возможность рисовать стрелки на индикаторе,
FREE

Торговый робот VR Black Box основан на популярной и проверенной временем стратегии следования за трендом. В течение нескольких лет он совершенствовался на реальных торговых счетах через регулярные обновления и внедрение новых идей. Благодаря этому, VR Black Box стал мощным и уникальным торговым роботом, который способен впечатлить как новичков, так и опытных трейдеров. Для того чтобы ознакомиться с роботом и оценить его эффективность, достаточно установить его на демо-счет и наблюдать за результ

The "MACD Trend Follower" is an indicator based on the MACD oscillator. It serves to spot the trend direction by giving it a fixed color until the trend changes (the trend direction colors are customizable). The default MACD settings for the indicator has been changed to adapt to the fast moving Forex market, but they can be changed to suit the trader.
Recommended settings for the indicator : - MACD Fast EMA : 8 Periods. - MACD Slow EMA : 13 Periods. - MACD SMA : 5 Periods.
Indicator inputs :
FREE
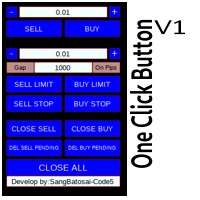
Simple button panel of trade on your chart with OneClick V1 Trial version. This trade panel will make it easier for you.
Equipped with several functions that make it very easy for you. More tools on OneClick VZ version, see here.
This version includes: Open Order Buy Open Order Sell Open Pending Order [Buy Limit - Buy Stop - Sell Limit-Sell Stop] Close ALL orders
Close Order Buy Close Order Sell Delete Pending Order [Buy Limit - Buy Stop - Sell Limit-Sell Stop] ENJOY IT!!! ONE CLICK V1 [TRIAL
FREE

このEAは、NinjaPlatformの無料のサンプル版です。
まず、 NinjaPlatformの説明をします。 NinjaPlatformは、お客様が自由にソースコードをいじって勝てる売買ロジックを構築できるEAのプラットフームです。 次のように思っておられる客様は、是非 NinjaPlatform をご検討下さい。
投資はギャンブルであるので、やるなら大きく勝ちたい。 勝つ自動売買プログラムを自分で創ってみたい。 勝つための理論や手法を学びたい。 お客様が勝てる売買ロジックを構築するために、 NinjaPlatformがサポート出来る事は、以下です。 1.豊富な売買ロジックやひな型が準備してある。お客様は、それらを簡単に微調整・変更・新規作成できる。 具体的には、 オープンロジックとして、一目均衡表/HULL移動平均/MACD/ AlligatorTrend/RCI/RCI_3line/STO/RSI/DMI/ Accelerator/ ボリジャーバンド/PIVOT/ ParabolicSAR/疑似グランビルの法則/疑似SinglePenetrationなどを用いた、1
FREE
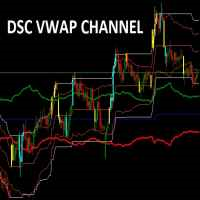
Corretora recomendada para usar esse indicador: https://tinyurl.com/5ftaha7c
Indicador usado para sabermos os pontos de suporte de resistência no gráfico. Funciona em todos ativos e timeframes.
Acerte exatamente os pontos de entradas e saídas das suas operações. SEE OUR RESULTS ON INSTAGRAM: https://www.instagram.com/diogo.cansi/ TELEGRAM GROUP = https://t.me/robosdsc More information by email dscinvestimentos@gmail.com or by Whatsapp 55-991372299
FREE

Индикатор, отображающий паттерн Поглощение. В настройках вы можете указать тип поглощения (тело, тень и комбинация). Возможна фильтрация по тренду (2 скользящие средние) и на разворот (RSI и полосы Боллинджера). Это очень популярный паттерн прайс экшн. Доступен мультивалютный дэшборд. С его помощью вы можете легко переключаться между графиками.
Торговые паттерны: Ретест по тренду. Ложный пробой. Ордер блок. Другое.
EURUSD, GBPUSD, XAUUSD, ... M15, M30, H1.
Входные параметры.
Главные. Bars C
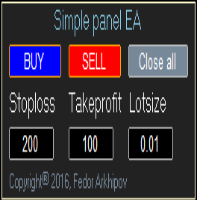
Простая панель для торговли в один клик (это советник). От стандартной панели отличается наличием кнопки Close all, что означает закрыть все ордера по текущему символу, наличием возможности вводить значение стоп-лосса и тейк-профита перед открытием ордера. Советник отличает "свои" ордеры от чужих, поэтому вы должны указать магическое число в настройках панели. Панель умеет делать скриншоты во время открытия и закрытия сделок, для последующего анализа сигналов на открытие/закрытие ордеров. Кнопка
FREE
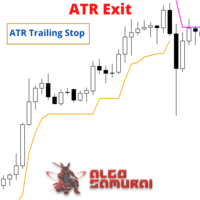
The ATR Exit indicator uses the candle close + ATR value to draw trailing stop lines (orange under buys, magenta over sells) that advance with the trend until the trend changes direction. It uses a multiple of the Average True Range (ATR), subtracting it’s value from the close on buy, adding its value to the close on sell. Moreover, the trailing stop lines are generated to support the order’s trend direction (long or short): In an upward trend, the long trailing stop line (orange line under bu
FREE

Updates
9/12/2023 - If you are looking for the Spock EA, I don't sell it anymore. DM me for more info.
24/10/2023 - Check out my other products. Starting to roll out some EAs & indicators based on this range.
Currently there is no MT5 version. I am using MT4 myself.
So I will spend my time mostly to develop more extensive stats for the Stats version and maybe even an EA. But I might develop a MT5 version.
All depends on the demand. Meaning, the more people request it, the bigger the chan
FREE
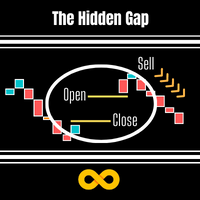
This Indicator is based on the Indice gaps between todays open price and yesturdays closing price. On Metatrader these are not shown as we only see a 24hr chart. If we want to know the gap between the open at 16:30 and yesturdays close at 23:30 on the SP500 this EA will reveal the gap. On Indices these types of Gap close approximately 60% of the time within the same day and is demonstrated on the panel which records previous gap closures and provides to the user a statistical proof of gaps clos
FREE

The advisor is based on a grid strategy and order averaging, is universal and can work on any currency pairs, depending on the settings, it is important to find out the range of price fluctuations for a specific currency bet over the last 2-3 months. During important news, it is recommended to set a high timeframe. The advisor has clear and easily manageable settings; you can configure the accuracy of averaging, the number of orders after which the martingale will work, and limit the number of
FREE

NewsReleaseEA is an expert to trade about economic news uses pending orders. Expert receives data for events from ' http://forexfactory.com '." The expert can trade up 28 (31 with yuan) pairs from one chart. Expert has the option for manual strategy (user strategy) or uses one of five included strategies. Expert has analyzer for any trade to show information for any currency and any pair to help trader to make better strategy.
Include Strategies Custom_Stategy - There are too many options t
FREE
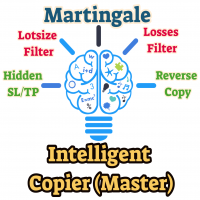
The Master utility is free, and you can buy/rent the client side utility from : https://www.mql5.com/en/market/product/41923
Now you can trade on multiple MetaTrader 4 accounts simultaneously, mirror the trades of any trading bot to your friends and family accounts (even if it is locked to your MT4 account number), create investment portfolios of many MT4 accounts, remove risk of unregulated Forex brokers, turn losing trading strategy into a winner and become an independent account manager imm
FREE

Constant Trader — это полностью автоматический профессиональный торговый робот. Разработан специально для валютного рынка EURUSD.
Советнику не нужно настраивать параметры. Готов работать на EURUSD M30. Вам нужно только определиться с выбором лота.
Он имеет умный алгоритм, который определяет тренд, отфильтровывает рыночный шум. Эксперт создает ордера по направлению тренда.
Входные и выходные заказы задаются комбинацией трех индикаторов, которые можно найти на любой платформе MT4: полосы Болин
FREE

Symmetrical Triangle Pattern Indicator - Mastering Trend Recognition in MetaTrader Unlock the power of trend recognition with the "Symmetrical Triangle Pattern" indicator for MetaTrader. This innovative tool simplifies the identification of symmetrical triangle patterns, providing traders with clear signals for potential trend continuation or reversal. Elevate your trading strategies with this MQL offering. Key Features : Accurate Pattern Recognition : The Symmetrical Triangle Pattern Indicator
FREE

The trading strategy bases on MACD signal and confluence of trends on multiple time frames. It supports martingale, smart trade and many options so that you can setup their own trading strategy from the basic one. Look for new idea, improve trading performance by yourself without limitation.
Outstanding Features Martingale trading : turn on/off martingale strategy. When you find out a parameter set which has a small value of maximum continuous loss, you can consider to turn on martingale mode t
FREE
Серия Tipu Panel представляет собой набор инновационных индикаторов, созданных для консолидации значений индикаторов в виде панели. Индикаторы легко могут загромоздить график и отвлечь вас от большей картины. Это также может быть подавляющим и визуально истощающим. Tipu Panel упрощает это, отображая каждый индикатор в виде аккуратно оформленной панели с ячейками. Вы можете настроить панель для отображения сигналов индикаторов на нескольких таймфреймах, а также для быстрого переключения между тай
FREE

The Time Zone indicator allows users to set specific time periods for major trading sessions (Asian, European, North American) and display them with distinct colors on the chart. Users can choose how many days of trading zones to show, set the start and end times for each session, and define the color to represent each trading period. The chart refreshes at user-defined intervals to ensure the time zone data is accurate and current. Key Features: Display Trading Zones: Users can choose to
FREE

NOTE!: The trend vote and the buy sell option shall match to the same direction before you put a trade!!
Indicator that uses Kalman filters (same as used on autonomous vehicles for data fusion between different sensors / technologies such as RADAR, LIDAR and Camera with Artificial Intelligence for object detection) by using the high and low price in order to identify buy and sell signals as indicated on the graph.
This indicator can be used on any timeframe with any currency or symbol.
This i
FREE

MA And Oscillation — это простая система, способная разобраться в путанице на рынке, просто наблюдая за скользящей средней и стохастиком. Сигнал подается при совпадении направления скользящей и осциллятора. Скользящая средняя, пожалуй, самый простой, но наиболее эффективный инструмент при торговле на старших таймфреймах. Мы используем скользящую и осциллятор для своевременного входа в рынок.
Особенности Способ упрощения рынка, которые порой бывает запутанным. Выбор получения сигнала только при
FREE

This outside bar indicator is the opposite of the inside bar. So what this MT4 outside bar indicator does is identifies outside bars for you as they form on your charts. Outside bar is a famous trading pattern in which the bar carry higher high and lower low compared with the previous bar, also known as mother bar. To trade based on Outside Bars, simply place buy stop order above the high price level of a bullish Outside Bar, and sell stop order should be placed below the low price level of a be
FREE
As the suggested, with this indicator you are able to switch from one symbol or timeframe to another in the same single chart. So forget about opening tons of chart on your screen! It's not designed for ICT or SMC trader, but if you are that kind of trader you still can use it. Imagine you have a strategy containing various indicators and settings, on a single chart you can screen the entry opportunity then move to the next symbol or timeframe.
FREE

Smart Grid Executor предусмотрен только для работы на платформе MetaTrader 4. Продукт работает на всех типах счетов и с любыми депозитами с МТ4-брокерами, не подчиняющимися правилам NFA (Национальной фьючерсной ассоциации). Рекомендуется следование за трендом. Рекомендуемое плечо >= 1:500. Тестирование на демо-счете 24.04.2014-09.07.2014 https://www.mql5.com/ru/signals/37964 Особенности Мультивалютный советник Таймфрейм - только H1 Работает на 4- и 5-значных котировках. Работает с мартингейлом А

See my other products here. One Click Order This product helps you to send your order as quickly and easily as possible. Send your order as fast as possible: Just set your position parameter values(Price, TP, SL, Ex Date) with just a few simple mouse drags. On the other hand, the calculation of the losses and profits value before ordering is always a big challenge for traders; This expert is very useful in taking a position and calculating the amount of the stop loss/the take profit(in the curr
FREE
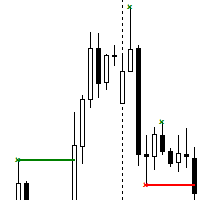
The Contraction/Expansion Breakout Indicator for MetaTrader 4 (MT4) is a powerful tool crafted to identify and signal the breakout of bullish and bearish contraction or expansion formations within financial markets. Utilizing advanced algorithmic calculations, this indicator assists traders in recognizing significant price movements that frequently accompany these formations, providing valuable insights for strategic trading decisions. Key Features: Contraction and Expansion Identification: The
FREE

Double Breakout - автоматический торговый советник, ведущий торговлю сразу по двум стратегиям. Советник имеет полностью настраиваемый мартингейл. В качестве входов используется индикатор Macd c настраиваемыми параметрами для каждого потока сделок. Для выхода из позиции используется задаваемый уровень тейкпрофита и стоплосса. Общие рекомендации Минимальный рекомендуемый депозит 1000 центов. Спред рекомендуется не более 3 пунктов. Лучше использовать трендовые валютные пары. После сделки, котор
FREE
IntradaySignals Intraday Signals is a visual and effective semi-automatic trading system, that: generates possible entry points to open BUY and SELL trades; displays recommended Take Profit and Stop Loss; displays current profit on open trade; displays current spread. The profitability of the indicator is shown in the screenshot on the example of the GBPUSD pair Does not redraw and works on opening bar. Time frames - M1-H1. Recommended TimeFrame-M5-M15. Signals are produced based on the used
FREE

Judas Swing ICT Forex without confirmation MT4
The Judas Swing ICT Forex without confirmation Indicator serves as a strategic tool in technical analysis, widely used in financial markets, especially within the ICT trading framework. It helps identify deceptive price moves that mislead traders before the market shifts back to its actual trend. This approach is crucial for recognizing market traps and making informed trading decisions in volatile conditions. «Indicator Installation & User Guide»
FREE

Индикатор разработан специально для торгового помощника Trade Shell (включая Trade Shell SMC ) чтобы обеспечить работу в тестере стратегий.
Тестируйте ваши торговые идеи и индикаторы. Запустите Trade Shell в визуальном тестере стратегий и поместите индикатор на график. После этого, вы сможете использовать все функции торгового помощника Trade Shell так же, как и в режиме реальной торговли! Tester Events работает только в тестере стратегий. Он не нуждается во входных параметрах.
Желаем уда
FREE

This indicators automatically draws the support and resistances levels (key levels) for you once you've dropped it on a chart. It reduces the hustle of drawing and redrawing these levels every time you analyse prices on a chart. With it, all you have to do is drop it on a chart, adjust the settings to your liking and let the indicator do the rest.
But wait, it gets better; the indicator is absolutely free! For more information: https://youtu.be/rTxbPOBu3nY For more free stuff visit: https:
FREE

ZonePro Supply Demand рисует свежие, проверенные, сломанные, старые и вложенные зоны до 3-х старших таймфреймов и отправляет оповещения, если зоны затронуты, вошли или сломаны, или разворотная свеча покидает зону! БЕЗ ПЕРЕКРАСКИ!
Информация о зоне:
Размер пункта если зона вложена в старший таймфрейм тестируется ли зона и сколько раз Панель трендов (вверху слева):
Показывает вам время Время до следующей свечи Общая тенденция Краткосрочное направление тренда Расстояние с начала тренда Скол

Индикатор R Inside Bar для Metatrader 4 предоставляет простые в использовании уровни ценового прорыва на основе внутренних баров.
Он работает на чистом ценовом действии и не перерисовывается, а всплывает в главном окне графика MT4 в виде двух цветных горизонтальных линий выше и ниже фактического внутреннего бара.
Зеленая горизонтальная линия действует как сопротивление, а красная — как поддержка.
Идея длинной и короткой торговли Открывайте ордер на покупку, если свеча закрывается выше зелено
FREE

Этот простой индикатор использует Ichimoku Kinko Hyo для поиска сильных и слабых валют в составе пары, чтобы обнаружить тренд. Индикатор также выдает сигналы на покупку и продажу на основе стандартного отклонения оборота вместе с силой валюты. Если цена выше как дневного облака (кумо), так и 26-дневной линии Kijun-sen, валюта считается сильной. Аналогично, если цена ниже как дневного облака, так и линии Kijun-sen, валюта считается слабой. Сопоставляя сильную и слабую валюты, советник ищет тренд.
FREE

"Recovery Drawdown" is an Expert Advisor (EA) specifically designed to address and overcome the challenge of drawdown in trading accounts. Drawdown occurs when an account experiences a series of consecutive losses, resulting in a significant decrease in available balance. This EA follows a cyclical strategy composed of several key steps. The first step is to close winning trades. This approach is implemented to secure the profits obtained up to that point and prevent them from turning into losse

FIBO DASHBOARD This dashboard lists down multi currency Fibonacci level whenever price hit the level. It draws a Fibonacci Retracement based on daily time frame. It draws arrows, sends pop-up alert and phone notification whenever price crosses Fibonacci levels. This tool is useful for users who trade with Fibonacci. INPUT ON Alert: set to true will pop-up alert whenever arrow appears. ON Push: set to true will send phone notification whenever arrow appears. ON Email:set to true will send email
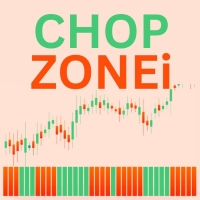
ChopZonei is a custom technical analysis indicator built to help traders identify trend strength and market conditions by calculating the angle of a chosen moving average (MA) over a specified period. The resulting angles are used to classify price action into various "chop zones," which are color-coded based on the direction and magnitude of the angle.
Key Features:
Multi-Timeframe Support: ChopZonei allows the user to calculate the indicator based on a higher timeframe (HTF) while avoiding
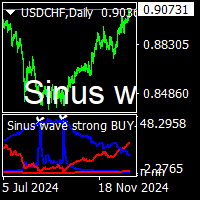
sinus wave strong buy sell indicator is nonrepaint top bottom point indicator.it work all pairs and all timeframe.suitable for beginners and experienced traders. it depend to sinus wave and vertex base .gives signal sinus wave over zero or below zero on approppirate vertex positions. cnt number has been set to 500 bars for demo mode. it can be increase to 2000 depend to charts has bar numbers. minimum value is 500. white points on red vertex spikes means sell. white points on blue vertex spikes

This indicator shows the breakeven line level for the total number of open positions of the current symbol with P/L value and total volume. This indicator is helpful to decide the exit level when using a trading grid strategy. The style of the breakeven line is customizable to choose the color, line shape and font size of the positions description. Send mobile notification when crossing a positive P/L target
FREE
Simple alert system which will alert you on your mobile terminal, email and on the chart whenever RSI crosses below the overbought level or above the oversold level. Use this alert system, so you don’t have to watch the chart all day for the RSI levels to break.
INPUTS: 1. RSI Period- (Default is 14). Number of candles the RSI indicator will look back for the calculations. 2. OB Level- (Default is 70). This is the Overbought level or Upper level for the RSI indicator. 3. OS

All about Smart Money Concepts Strategy: Market struture: internal or swing BOS, CHoCH; Orderblock; Liquity equal; Fair Value Gap with Consequent encroachment, Balanced price range; Level with Previous month, week, day level or in day level (PMH, PWH, PDH, HOD); BuySell Stops Liquidity (BSL, SSL); Liquidity Void Long Wicks; Premium and Discount; Candle pattern ... "Smart Money Concepts" ( SMC ) is a fairly new yet widely used term amongst price action traders looking to more accurately navigate

The Ichimoku at a glance has great appeal to me and most traders. The Gold on Ichimoku EA exploits the trend filter of the Ichimoku system, combines price recalculation and signal pattern calculation to create an optimally efficient automated trading system with low risk. The trades are also executed using the Scalper method to quickly exit the market. The trades always have Stop Loss available, along with Trailing settings and closing positions when the trend changes to control risk. EA is opt

Meet the next-generation EA Mecha Scalper designed for forex and gold markets. This advanced expert advisor meticulously tracks tick data and tick speed movements to identify high-probability trading opportunities. When signal patterns appear, the EA implements a unique entry method to trap momentum for optimal entry points. The EA executes trades using a scalping approach. Scalper strategy helps EA to quickly exit the market with small profit target and low risk. All trading orders have Stop L
Bollinger Bands Multi-Currency EA MT4 executes trades across multiple pairs based on Bollinger Bands reversal patterns. It supports advanced features like group stop-loss/take-profit and dynamic position sizing, allowing users to manage portfolio-wide risk effectively. For detailed documentation General Settings/Input Guide | Indicator Settings, Backtest and Set files You can download the MT5 version here Key Features: Implements a robust, backtested trading strategy. Supports multiple t
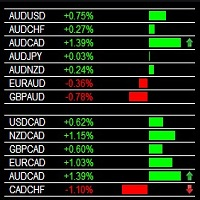
Multi Currency Strength Dashboard Scalper SCALP SIGNALS BASED ON THE ANALYSIS OF THE STRENGTH OF THE CROSS CURRENCY PAIRS- MAKES THE SIGNALS STRONG
Indicator Dashboard- calculates the strength of all markets , currency pairs , commodities . Using a proprietary logic. This data can be used to judge and take decisions whether to buy or sell them. If the particular market is strong means it is bullish , and also the related pair of that market is strong then it will be highly probable that the

BLACK GOLD utilizes the US Market in a New Trending Indicator Strategy and Intelligent Risk Reduction Algorithm with Stop Loss Options. New Exit Strategy to protect your profits when the trend changes. Minimum Deposit $500 REAL BACKTEST DATA - no manipulation or backtest conditioning like other EAs! 99.9% backtest quality. BLACK GOLD EA is fully automated trading system with manual trading tools inbuilt to control the EA from a simple interface. News indicator is programmed into the EA. Use ECN

ICT Core Content Concepts turned into indicator plus all previous tools known from the Position Smart Indicator . This makes it the Full PSI Private Version ( read more ) restricted up to now but available only after the Mentorship Core Content was made public on YouTube. You will find many price action study tools like: Central Bank Dealing Range - CBDR Asian Range FLOUT Profiles and SD targets on the CBRD, Asian Range and Flout both on the wicks and on the bodies Seek & Destroy Profil
Узнайте, как легко и просто купить торгового робота в MetaTrader AppStore - магазине приложений для платформы MetaTrader.
Платежная система MQL5.community позволяет проводить оплату с помощью PayPal, банковских карт и популярных платежных систем. Кроме того, настоятельно рекомендуем протестировать торгового робота перед покупкой, чтобы получить более полное представление о нем.
Вы упускаете торговые возможности:
- Бесплатные приложения для трейдинга
- 8 000+ сигналов для копирования
- Экономические новости для анализа финансовых рынков
Регистрация
Вход
Если у вас нет учетной записи, зарегистрируйтесь
Для авторизации и пользования сайтом MQL5.com необходимо разрешить использование файлов Сookie.
Пожалуйста, включите в вашем браузере данную настройку, иначе вы не сможете авторизоваться.