YouTubeにあるマーケットチュートリアルビデオをご覧ください
ロボットや指標を購入する
仮想ホスティングで
EAを実行
EAを実行
ロボットや指標を購入前にテストする
マーケットで収入を得る
販売のためにプロダクトをプレゼンテーションする方法
MetaTrader 4のための有料のテクニカル指標 - 105
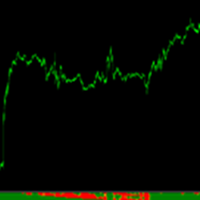
Power Real Trend es un indicador que no repinta y que muestra la dirección real que tiene el mercado, ofreciendo una clara manera de confirmar entradas. Es un indicador que para su constitución se realizan múltiples operaciones para formar los distintos rangos que se utilizan para su creación. Tiene un manejo muy sencillo dando sólo tres posibles valores (1,0,-1) altamente visual y de muy sencilla comprensión. La parte superior del mismo es la zona más sensible y la inferior corresponde a la te
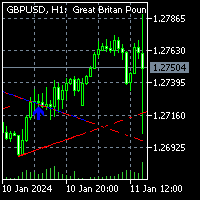
To get access to MT5 version click here . This is the exact conversion from TradingView: "Trendlines with Breaks" by LuxAlgo
This is a REPAINT indicator. Buffers are available for processing. However there are objects on chart to process also. All input fields are available. Alerts are generated based on bars closure. You can message in private chat for further changes you need. Thanks for downloading

貴方は金融市場での長期の機会を探している投資家ですか? ここにCustom Long-Term Trend Indicatorをご紹介いたします。 このインディケーターは、デイリー、ウィークリー、および月次のチャートよりも長い時間枠でポジションをトレードしたいトレーダー向けに設計されています。 明確で正確なシグナルで、情報を元にした意思決定をサポートします。 主な特徴: 長期戦略:このインディケーターは、長期のトレードに取り組む投資家に最適です。 推奨される時間枠: 最良の結果を得るために、このインディケーターはデイリーよりも長い時間枠で使用することをお勧めします。 正確なシグナル: インディケーターによって生成されたシグナルとキャンドルスティックの終了を待ち、よく考えられた意思決定を行ってください。 未決済注文: 最適な利用のために、バイストップやセルストップなどの未決済注文を使用することを検討してください。 適切なロットサイズ: 小額の残高を持つ口座は、0.01のロットサイズを使用して効果的なリスク管理を行うことができます。 推奨通貨ペア: このインディケーターに適した通貨ペアには

TMA - 三角形移動平均インジケーター TMA - 三角形移動平均インジケーターは、金融市場のトレンドを分析し特定するトレーダー向けの強力なツールです。 このインジケーターは三角形移動平均を知的に計算し、市場の方向に関する有益な洞察を提供します。 主な特徴: 長期の時間枠に最適:D1/W1/MN以上の期間での使用を推奨し、長期のトレンドを包括的に把握します。 ユニバーサル:全ての通貨ペアに適用可能で、様々な取引シナリオでの柔軟性と有用性を提供します。 精密な計算:三角形移動平均の高度な計算に基づいており、市場での潜在的なエントリーポイントと出口ポイントを特定するのに役立ちます。 このインジケーターは、堅実なテクニカル分析を求め、トレード戦略を向上させたいトレーダーにとって不可欠なツールです。 詳細情報やテクニカルサポートについては、メールでお問い合わせください。 注意:これはMetaTrader取引プラットフォーム用のインジケーターです。 TMA - 三角形移動平均インジケーターを手に入れて、市場分析を新たな高みに引き上げましょう! 資料を直接売り手からメールで受け取ることを選択し、

Fnix Ma カラー。 これはトレーダーが金融市場のトレンドを特定するのに役立つカスタムインディケーターです。MA - Master Trend Position Tradeは、資産のトレンドの分析を補助するために移動平均を計算して表示するツールです。 主な特徴: トレンドの特定のために移動平均を計算します。 D1/W1/MN(デイリー/ウィークリー/マンスリー)よりも長い時間枠での使用をお勧めします。 分析のためにペンディングオーダーの使用を提案します。 すべての通貨ペアと互換性があります。 追加の詳細: シンプルで直感的なビジュアルインターフェース。 設定可能なパラメータを備えた調整可能なインディケーター。 使用方法: インジケーターをテクニカル分析プラットフォームにインストールします。 資産のチャートに適用して計算されたトレンドを視覚化します。 サポートと連絡先: ご質問や技術的なサポートが必要な場合は、メールでお問い合わせください。 注意:これはカスタムインディケーターであり、投資分析や戦略の代替とはなりません。 ライブアカウントで使用する前にデモアカウントでテストすることを

Exclusive Limited Time Offer! Grab this useful indicator for a lifetime at just $49. Enhance your trading experience with this amazing Metatrader indicator that tracks your live trade status. The indicator displays live take profit, stop loss & trailed stop loss, or trailed profit value with the best dashboard with account balance alert. Indicator Features:
Trade Details The indicator shows the last 5 active trades data in chronological order. Don't miss this opportunity to get your copy today
Dear traders! This indicator automatically plots SuperTrends across 3 timeframes. SuperTrend is a trend following indicator. However, it is not much useful on single timeframe, as that gives many whipsaws. Professionals analysis across multi timeframes before taking trades. This adds confluence to trade setups.For the same purpose, Pro SuperTrends shows trend (or absence of trend) on 3 timeframes. Our trading odds improve, when positions are aligned with higher timeframes. Further, SuperTren

The Book of Changes is a product of ancient civilization and a philosophical work that highly integrates natural and social sciences in China. The Book of Changes believes that all things in heaven and earth are constantly developing, and it explains the laws of nature. This law reveals the characteristics of the entire universe, covering the attributes of all things in heaven and earth. The Book of Changes is the crystallization of the wisdom of the Chinese nation. It is the crystallization of
Indicador de Trading UltraPreciso para MetaTrader 4: "Mr Beast Signals no Repaint with alerts" Descubra la revolución en el análisis técnico con nuestro indicador Quantum Precision Pro diseñado para MetaTrader 4. Este avanzado indicador combina algoritmos de vanguardia con inteligencia artificial para ofrecer señales de compra y venta extremadamente precisas en tiempo real. Características destacadas: Precisión sin Igual: Nuestro algoritmo utiliza una combinación de análisis técnico y patrones d

The GGP Trendlines with Breaks Alert MT4 Indicator is a technical analysis tool that can assist investors in identifying market trends. The indicator returns pivot point based trendlines with highlighted breakouts. Users can control the steepness of the trendlines as well as their slope calculation method. This indicator is MT4 conversion of the Trendlines with Breaks Indicator by “ LuxAlgo “ in Trading View website and some alert methods are added to provide real-time alerts when a trading sign
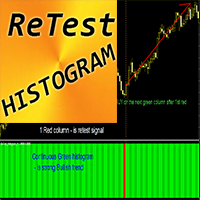
MT4用FXインジケーター「ReTestヒストグラム」
ReTest_Histogram インジケーターは、強い S/R レベルの再テスト後のメイン トレンド方向へのエントリー シグナルの検索に使用できます。 ReTest ヒストグラムは 2 色で表示できます。赤は弱気トレンド、緑は強気トレンドです。 同じ色の安定した連続ヒストグラム列が表示されたら、新しいトレンドが発生していることを意味します ReTest シグナルはヒストグラムの 1 つの列に反対の色があり、次の列にはトレンドの色が表示されます (図を参照) インジケーターにはモバイルおよび PC アラートが組み込まれています
インジケーターの使用方法: - 買いシグナルの場合: 安定した連続的な緑色のヒストグラム (上昇トレンド) + ヒストグラム上の 1 つの赤色の列 (再テスト) + 1 つの緑色の列 (ここでロング取引を開始) - 売りシグナルの場合: 安定した連続赤色ヒストグラム (下降トレンド) + ヒストグラム上の 1 つの緑色の列 (再テスト) + 1 つの赤色の列 (ここでショートトレードを開く)

RockTrader is an indicator that identifies market direction across chosen currency pairs and generates line signals for potential buy and sell opportunities within the selected timeframe. Its straightforward design makes it highly regarded and easily comprehensible for traders at basic and intermediate levels. The visual representation on the chart also enables users to conduct pure price action analysis. RockTrader is versatile, functioning across various financial assets, and boasts over an 85
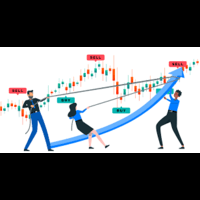
Key Features A key concept of technical analysis is that when a resistance or support level is broken, its role is reversed. If the price falls below a support level, that level will become resistant. If the price rises above a resistance level, it will often become support.
Horizontal support and resistance levels are the most basic type of these levels. They're simply identified by a horizontal line: Green Level in the chart, is Resistance Level. Red Level in the chart, is a Support Level.

The FX_ride custom indicator assists traders in recognizing market trends across preferred currency pairs and provides signals based on trend strength via a multi-colored histogram within chosen timeframes. It is particularly suited for day trading, swing trading, and position trading. Following signals from FX_ride in conjunction with employing sound money management practices can enhance the likelihood of profitable trading outcomes.

Gobbo è un indicatore professionale che evidenzia il trend del mercato con un aspetto grafico chiaro e comprensibile, è basato sulla Moving Average e può essere impostato su qualsiasi periodo di intervallo, di default impostato sul periodo 14, scegliendo un periodo più alto evidenzierà meno cambi di tendenza per un approccio sul medio o lungo periodo, con un periodo più basso più cambi di tendenza per un approccio sul breve termine L'aggiornamento e l'adattamento al time frame scelto avviene in

外国為替取引を本当に改善したいですか? AI Adaptive Scalper はまさにあなたが必要とするものです。 このユニークで革新的なトレンドインジケーターは、可能な限り最も正確なシグナルを提供するために、EURUSD 通貨ペアと h1 時間枠向けに特別に設計されています。
AI Adaptive Scalper は、ストキャスティクス、MACD、一目均衡表、ボリンジャー、ジグザグなどの一般的な指標を使用して、取引の最適なエントリーポイントとエグジットポイントを見つけます。 市場トレンドの変化を簡単に特定し、インジケーターが提供するシグナルに即座に反応できるようになります。
チャンネルに登録して、インジケーターやその他の取引関連トピックについてさらに詳しく学びましょう。
AI Adaptive Scalper の主な利点の 1 つは、取引ターミナルが過負荷になったり、フリーズしたりしないことです。 これは、技術的な問題を心配することなくインジケーターを安全に使用できることを意味します。 チャート上に矢印として表示される正確なシグナルに基づいて重要な意思決定を行う

PYTHONFX
INCEPTION TRADING SYSTEM
THE BROKERS WORST NIGHTMARE...
IMPORTANT! After the purchase please send me a private message to receive the installation manual and the setup instructions.
We proudly introduce the PYTHONFX ROYAL CIRCLE Inception trading system, your key to financial freedom. This is the brokers worst nightmare. Seriously! Modern market conditions require modern solutions & if you are still struggling to analyse the charts and struggling to find consistency in the

If you are curious about the position of the stochastic, RSI, CCI curve, whether it is at the OBOS level or not, then this trading tool is for you. Introducing the advanced trading tools of 2024. ATF Trend Following Trend Bar OBOS. This indicator is similar to MTF PPAAF Model S but have two layers. Click here to learn more about MTF PPAAFS . This trading tool is equipped with various powerful features : MTF = Multi Time Frame = Time Frame can be changed. On/off button. Customizable parameter,

1000% non-repaint high accuracy signal technical indicator. Solar wind Predator work on all pairs with high and low volatility Solar wind Predator work from the 1 minute timeframe to the Monthly timeframe Swing trading H1 to W1 Scalping M1 to M30 Blue arrows above the zero line look for buying(bullish) opportunities. Orange arrows below zero line look for selling(bearish) opportunities.

The Liquidation Estimates (Real-Time) experimental indicator attempts to highlight real-time long and short liquidations on all timeframes. Here with liquidations, we refer to the process of forcibly closing a trader's position in the market.
By analyzing liquidation data, traders can gauge market sentiment, identify potential support and resistance levels, identify potential trend reversals, and make informed decisions about entry and exit points.
USAGE (Img 1) Liquidation ref
Discount for all previous purchasers of my products valid price at 75 $ only for today.The Swing Hit Perfect Master Indicator for MT4 displays accurate buy and sell signals on the chart and is no repaint and can be used on any pair, gold and indices. It's all in one the best indicator Swing and trend detection and is able to make precise entries. The indicator for MT4 points dots on the chart arrow after the swing high and low is maintained and takes perfect entries with the trend. The template

Vision è un indicatore professionale che legge i dati storici del periodo impostato e in base a tali elabora una previsione scrivendo l'andamento sul grafico, l'impatto visivo eccellente rende chiaro l'andamento del prossimo trend e mette a fuoco il prezzo d'ingresso il posizionamento di ordini e la distanza per SL e TP, di default è impostato con un rapporto bilanciato 24 a 24 ciò significa che in base alle ultime 24 candele prevederà scrivendo sul grafico l'andamento delle 24 candele successiv

The arrow indicator without redrawing shows potential entry points into the market in the form of arrows of the appropriate color: the up arrows (usually green) suggest opening a purchase, the red down arrows suggest selling. The appearance of arrows may be accompanied by beeps. It is usually assumed to enter at the next bar after the pointer, but there may be non-standard recommendations. Arrow indicators visually "unload" the price chart and save time for analysis: no signal – no deal, if ther
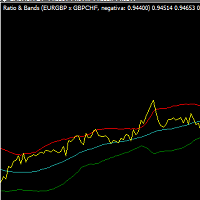
Hello everyone!
This incredible indicator for MT4 plataform calculates the ratio betwwen two symbols AND shows the bollinger bands for this ratio. It also considers if the two symbols have a positive or negative correlation for the calculations.
The result is a powerfull tool that brings very precious information to who that wants to trade in Forex based on correlation.
Enjoy!
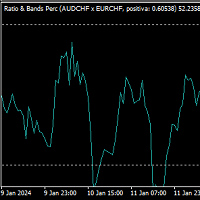
Hello everyone!
This incredible indicator for MT4 plataform calculates the ratio between two symbols, convert it into a percentual value and shows the result into a oscilation tunnel. It is derivated from the our other indicator (Ratio Bands). The basic diference is that instead of a bollinger bands, it uses a percentual oscillation that helps a lot during correlation trades.
It also considers if the two symbols have a positive or negative correlation for the calculations.
Good trades!

Classic Fractals indicator for MT4, with additional Trendlines connecting the latest couples of fractals
( fractals are showing highest high, and lowest low on each period)
Rules for trendlines:
-if new top fractal is below the last one = new resistance line
-if new bot fractal is above the last one = new support line
-Trendlines can be hidden
-Fractals can be hidden
Fractal Period = can be both even or uneven number, as it is setting for half (one side) of the bars sequence

Простой индикатор тренда в NRTR виде с отрисовкой линий стоплосса и тейпрофита, цвет и направление движения которых определяются действующим трендом. Индикатор имеет возможность подавать алерты, отправлять почтовые сообщения и push-сигналы при смене направления тренда. Следует учесть что значение входного параметра индикатора Deviation of the take profit line in points для каждого финансового актива на каждом таймфрейме необходимо подбирать индивидуально!

This is an arrow indicator without a future function,developed based on the most advanced profit trading algorithms.It has the most innovative and advanced dual trend analysis module, as well as the latest and highly effective market trend prediction algorithm.Trends are your friends, and following larger trends can earn the maximum profit in foreign exchange. This indicator helps traders identify current trends and track them. Someone once made a profit of 10 times in a week by relying on it.No

Features for software
Main functions: Accurate entry signals WITH NON REPAINTING! Once a signal appears, it remains valid! This is a significant distinction from other indicators that might provide a signal and then alter it, potentially leading to deposit losses. Now, you can enter the market with higher probability and precision. There's also a function to colour candles after an arrow appears until the target (take profit) is reached or a reversal signal appears . Display of STOP LOSS / TA
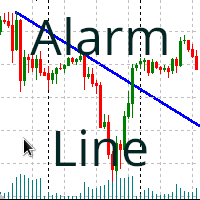
トレンドラインブレイクアウトアラート 説明: この指標は、 価格がトレンドラインを突破したときにアラート(音、 アラート、 または通知)をトリガーします。 これは、 トレンドラインの上または下で発生します。 パラメータ: Names of the trendlines. : トレンドラインの名前をカンマで区切ります(トレンドライン名の頭にスペースがなく、 正確であることを確認してください)。 Value over/under the line (E.g.: 0.03% or 500 pips). : アラートをトリガーする前にトレンドラインの上下のマージンを定義する値です。 次のパラメータに従って、 パーセンテージまたはピップスで指定できます。 Use value in percentage or pips? :前のパラメータがパーセンテージで与えられているか、 ピップスで与えられているかを定義します。 2nd bar? :Trueの場合、 トレンドラインの上下に2本のバーがあるときにアラートがトリガーされます。 Play sound? (Bug!) :Trueの場合、 スピーカーか

Introduction The Commodity Channel Index, commonly known as the CCI, is a versatile indicator used by traders and investors to identify cyclical trends in commodities, stocks, and other securities. It was developed by Donald Lambert in 1980, primarily for commodity trading, but has since found widespread application in various financial markets. The CCI is particularly favored for its ability to gauge overbought and oversold levels in price movements. Historical Background Donald Lambert, the

Preface: First of all, let me introduce myself. I am a programmer and have been working for over 20 years. 2023 has passed, and our studio has achieved a record of 500 times with 7 manual transmissions. Below, we will show you how to do it through a series of operations. The first step is to model. Modeling is to find a fixed trading pattern. I think everyone has heard of a 2/8 probability, and through this probability, we can further refine it, which means that 1 to 4 is the optimal state. We h
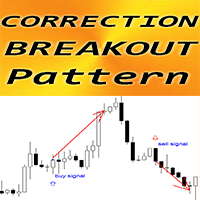
MT4用FXインジケーター「修正ブレイクアウトパターン」
インジケーター「修正ブレイクアウト パターン」は、プライス アクション取引にとって非常に強力なインジケーターです。再描画や遅延はありません。 インジケーターは、価格修正後に強気および弱気のブレイクアウト バーを検出します。 強気修正ブレイクアウト パターン - チャート上の青い矢印シグナル (写真を参照) 弱気修正ブレイクアウトパターン - チャート上の赤い矢印シグナル (写真を参照) PC、モバイル、電子メールによるアラート インジケーター「調整ブレイクアウトパターン」はサポート/レジスタンスレベルと組み合わせるのが良いです: https://www.mql5.com/en/market/product/100903
// さらに優れたエキスパートアドバイザーとインジケーターはここから入手できます: https://www.mql5.com/en/users/def1380/seller // また、収益性が高く、安定していて信頼性の高いシグナル https://www.mql5.com/en/signals/188

スイープパターン 最先端のツールは、弱気トレンドの回転と強気トレンドの回転の両方を比類のない精度で識別するように設計されています。
情報に基づいた取引の決定を下し、市場の一歩先を行くことができます。 MT5バージョン: WH Sweep Pattern MT5 スイープパターンの特徴:
自動的に検出し、さまざまな色とスタイルを使用して、チャート上に弱気と強気のトレンド ローテーションを描画します。 アラート (サウンド、電子メール、プッシュ通知) を送信し、チャート上に矢印を描画するので、取引シグナルを見逃すことはありません。 あらゆる通貨ペア、時間枠、市場状況に対応し、取引武器として多用途で信頼性の高いツールを提供します。 カスタマイズ可能なパラメーターを使用して、インジケーターを特定の取引設定に合わせて調整します。
市場のローテーションに不意を突かれないようにしてください。スイープ パターン インジケーターを使用して取引戦略を強化すると、弱気トレンドの反転または強気トレンドの反転を簡単に見つけることができます。
あなたが経験豊富なトレーダーであろうと、初心者で

Subscribe to the 'MA7 Trading' channel to receive notifications about new programs, updates and other information. Ask questions in the profile on the MQL5 .
Description of work
The 'MA7 Agave' indicator is based on the standard Average Directional Movement Index (ADX) indicator. Shows the intersection of the +DI and -DI lines. Detailed information about the 'MA7 Agave' indicator.
Indicator settings
General settings: ADX period - Average Directional Movement Index indicator period.
'MA7

This indicator is based on chart with specialty in volume, it clearly shows where the buying and selling force.
Note on images:
Settings and adjustments to the colors you prefer.
Being able to see the price that the market is at at the exact moment.
Able to accept more indicators in the same window, such as Bollinger Bands, Ma, Stochastic, MACD and many others that adapt to your best configuration.
SEEDER_Volume1 Mt4 indicator can be used on all types of charts, including RENKO c
Exclusive Limited Time Offer! Grab this powerful indicator for a lifetime at just $65. Open the power of precise decision-making with our revolutionary product, FX Correlation Matrix. This indicator is your key to understanding multiple FX currency pairs' positive and negative correlations at a glance, providing valuable insights to elevate your trading strategies.
Indicator Features:
Multiple-Frame Multi-Currency Dashboard: Displays 10 multiple currency pairs positive and negative correlati
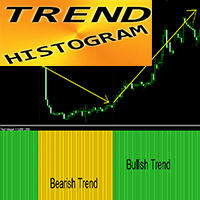
MT4用FXインジケーター「TRENDヒストグラム」
TREND ヒストグラム インジケーターは、標準的な MA クロスよりもはるかに感度が高く、効率的です。 インジケーターは 2 色で表示できます: 弱気トレンドの場合は黄色 (金色)、強気トレンドの場合は緑 (色は設定で変更可能) TREND ヒストグラムにはモバイルおよび PC アラートが組み込まれています このインジケーターを他の取引方法(プライスアクション、VSA、その他のインジケーター)と組み合わせるのは素晴らしいアイデアです。
// さらに優れたエキスパートアドバイザーとインジケーターはここから入手できます: https://www.mql5.com/en/users/def1380/seller // また、収益性が高く、安定していて信頼性の高いシグナル https://www.mql5.com/en/signals/1887493 に参加することも歓迎します。 当MQL5サイトのみでご提供しているオリジナル商品です。

Fair Value Gap is and MT4 Non Repaint and Non Lagging indicator which give alerts upon a signal is detected. It can be used for both scalping and swing trading.
The indicator is based on Trend following strategy and inbuilt trading algorithms of pure price action
Has alerts and also push notifications to your phone with signals to buy or sell.
Works on all Time-frames and MT4 brokers. It is as well a Multi-Currency Indicator, including Gold, Nasdaq and US30 pairs
Take advantage of this wo

Информационный индикатор, показывающий самые важные торговые уровни для внутридневной торговли, и не только. О понятии уровней «Поддержка» и «Сопротивление».
Всем известно, что исторический ценовой диапазон цен состоит из уровней от которых в прошлом, были значимые движения.
И уровни работающие в прошлом, наверняка будут работать и сейчас. К примеру, уровень, находящийся снизу текущей цены
является уровнем «Поддержки», если от него ранее было значительное движение. К примеру, уровень,
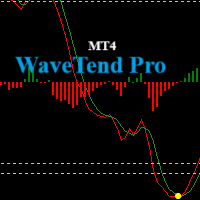
Introducing the Wave Trend Oscillator Indicator for MetaTrader 4(MT4). Our carefully designed oscillator leverages wave trend analysis principles to track market trends accurately. It assists traders in identifying potential buying and selling points based on market wave patterns, allowing you to stay informed. Key Features: Divergence Detection : Spot potential reversals in the market. Intermediate Level Crosses : Gain granular insights into market trends. Please note: The indicator states are
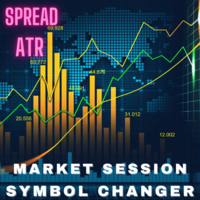
マーケットイージーインジケーター
マーケットイージーインジケーターは、トレーダーが1つの画面で異なる通貨ペア間を便利に切り替えることを可能にするインジケーターです。このEA(エキスパートアドバイザー)には市場セッション、スプレッド、ATRなど、トレーダーアナリシスを容易にするための複数の機能が組み込まれています。
マーケットイージーインジケーターを使用すると、複数のタブを開かなくても簡単に取引でき、チャート画面がよりクリーンで分析しやすくなります。
他のトップEAおよびインジケーター: https://www.mql5.com/en/users/lothimailoan/seller
主な特徴:
1. 1クリックで異なるペアのチャートを開く このインジケーターでは、クリック一つでペアを設定し、チャートを開くように構成できます。市場監視タブを繰り返し開く必要がなくなります。
2. オートドローの市場セッション インジケーターは、カスタマイズ可能なカラーボックスを使用してアジア、ロンドン、ニューヨークの時間枠を描画します。この機能により、セッションがアクティブ
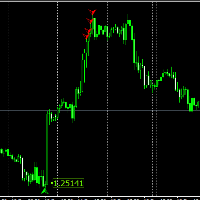
For those who have followed my FCK Quantum Scalping thread know about the FCK Quantum Scalping indicator and have taken the indicator to different levels (Mastermind) to suit his or her trading style. In this system, the Quantum indicator is only for showing us trading entries, and that’s it. Targets and stop levels are a little later. For those who don’t know what the FCK Quantum Scalping indicator is, I’ll tell you. The FCK Quantum Scalping indicator is basically a modified Wave indicator

Subscribe to the 'MA7 Trading' channel to receive notifications about new programs, updates and other information. Ask questions in the profile on the MQL5 .
Description of work
The 'MA7 Flax' indicator is based on the standard Average True Range (ATR) indicator and candle data. Shows candles that are larger in size relative to the ATR indicator value. Detailed information about the 'MA7 Flax' indicator.
Indicator settings
General settings: ATR period – Average True Range indicator period
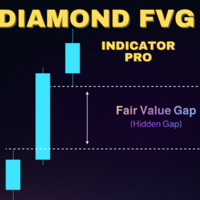
FVG(フェアバリューギャップ、ヒドゥンギャップ、アンバランス)は、三つのローソク足の間に現れる低ボリュームの価格帯を指します。
詳細なエキスパートアドバイザーやインジケーターについては、こちらを参照してください: https://www.mql5.com/en/users/lothimailoan/seller 私はロスです、もっとアップデートを受け取るにはこちらを購読してください: https://www.mql5.com/en/users/lothimailoan/news
1/ WRB-Hidden-Gapの理解:
このインジケーターでは、まず「ワイドレンジボディ(WRB)」と呼ばれる大きなボディを持つローソク足を最初に識別し、「」で表示します。ワイドレンジボディの条件は、「次のローソク足のボディが過去3本のローソク足のボディよりも大きい」ことです。識別されたWRB内で、もしローソク足にフェアバリューギャップがあれば、水平に青いゾーンが表示されます。
ゾーンは完全に埋まると停止します。
これはFVGの分析が簡単な優れたインジケーターです。
2/ パラ
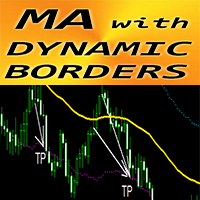
MT4用FXインジケーター「MA with Dynamic Borders」
インジケーターには移動平均に関連付けられた独自の機能があります - ダイナミックボラティリティボーダー ダイナミック ボラティリティ ボーダーは計算に平均トゥルー レンジ値を使用します このインジケーターは、テイクプロフィットのターゲット設定とボーダーラインでの SL の配置に最適です インジケーターはプライスアクションエントリーとの組み合わせにも優れています
// さらに優れたエキスパートアドバイザーとインジケーターはここから入手できます: https://www.mql5.com/en/users/def1380/seller // また、収益性が高く、安定していて信頼性の高いシグナル https://www.mql5.com/en/signals/1887493 に参加することも歓迎します。 当MQL5サイトのみでご提供しているオリジナル商品です。

RaysFX Donchian Channel
Questo indicatore può essere utile per identificare i livelli di supporto e resistenza, nonché per visualizzare visivamente la gamma di prezzo di un determinato periodo. Variabili Valore Periodo 20 TimeFrame Current Mode High/Low(true) o Close (false) Modalità true Telegram: https://t.me/SmartSaverOfficial Store: https://www.mql5.com/it/users/rays96/seller
Questo indicatore è stato Progettato da RaysFX

Metatrader 4 の Super Arrow Forex Signal インジケーターは、チャート上に正確な売買矢印を印刷する完全な FX 取引システムです。
このインジケーターは、メインの MT4 チャート ウィンドウに緑と赤の色の矢印として表示されます。
インジケーターが示す信号に従ってください。
トレードシグナル:
緑色の矢印は買いシグナルです。 赤い矢印は売りシグナルです。 スーパーアロー外国為替シグナルインジケーターは、トレードエントリーとトレードエグジットの両方に、または他の戦略やシステムのトレンド確認シグナルインジケーターとして使用できます。
このインジケーターはすべての通貨ペア(メジャー、マイナー、エキゾチック)で同様に機能し、正しく使用されれば有望な結果を示します。
取引のヒント:
Super Arrow Forex Signal インジケーターを使用して、独自のお気に入りのトレードエントリー、ストップロス、テイクプロフィットの方法を自由に使用して取引できます。
いつものように、全体的な傾向に合わせてトレードし、この指標を完全

Indicator for determining the direction of the current trend Sends signals about trend changes to the terminal, smartphone and email Allows you to quickly navigate when changing price direction Works on all timeframes, on any currency pairs, metals and cryptocurrencies Can be used when working with binary options Distinctive features Doesn't redraw Gives three types of signals Has simple settings Quickly adapts to any trading instrument; Works on all timeframes and all symbols; Suitable for trad
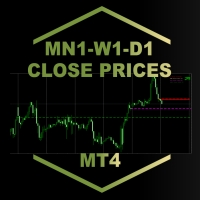
MN1-W1-D1 Close Price Indicator to Index Trading for MT4
The indicator draws lines to the close prices of the last closed bars of monthly, weekly and daily timeframes. Observably, these prices are significant support and resistance prices at major indices, like Nasdaq, DAX. The info panel always shows the prices relative to each other in the correct order. If the current price is the highest - i.e. higher than the last monthly, weekly and daily closing price - it is in the first row. The lowest
mt4 (Metatrader 4) の Scalper Signal Tarek インジケーターは、日足チャートでも、あらゆる時間枠であらゆる通貨ペアのスキャルピング シグナルを提供します。
このインジケーターは非常に信頼性が高く、軽量であり、取引プラットフォームの速度を低下させることはありません。
シグナルは、メインの MT4 チャート ウィンドウに緑と赤の色のシグナル矢印の形で表示されます。
売買シグナル:
緑色の矢印がチャートに表示されたら、買いポジションをオープンします。 チャートに赤い矢印が表示されたら売りポジションをオープンします。 取引ごとに 7 ~ 40 ピップスの利益を目指します (選択した時間枠によって異なります)。 Scalper Signal Tarek インジケーターは、トレードのエントリーとエグジットの両方に、または追加の短期トレンドフィルターとして使用できます。
このインジケーターはすべての通貨ペア(メジャー、マイナー、エキゾチック)で同様に機能し、正しく使用されれば有望な結果を示します。
取引のヒント:
Forex Sca

The Limiter One of the helpful tool to identify the limits of HH, HL, LH and LL easily, The Limiter is only a auxiliary tool and not a complete trading system, The market changes his psychology every week, day and sometimes every hour, for that there's no fixed default values and you must use the tuners settings and change the values, and use the limiter as you need, it's very simple customized tool, you can use it with any kind of indicators to have the best entry Recommend to use it on H1 bu

Miko Trend is a hybrid trend indicator, as it is based on signals from elementary indicators and a special algorithm for analysis. The indicator shows favorable moments for entering the market. The indicator's intelligent algorithm determines the trend, filters out market noise and generates input signals.
The indicator can be used primarily to determine the trend. The indicator can work both for entry points and as a filter. Uses two parameters for settings. The indicator uses color signalin

RaysFX TMAT3 è uno strumento potente che combina due tipi di medie mobili per aiutarti a identificare e seguire le tendenze del mercato. L’indicatore utilizza una media mobile triangolare centrata (TMA) e un T3 Moving Average. Queste due medie mobili lavorano insieme per fornire segnali di trading chiari e tempestivi. Quando il T3 Moving Average è inferiore alla TMA, l’indicatore considera che la tendenza del mercato sia al rialzo e genera un segnale di acquisto. Al contrario, quando il T3 Movin

The Ruby Trend indicator calculates the saturation levels of the price chart. A signal to exit the resale area is a buy signal. A signal to exit the overbought area is a signal to sell. Usually you need to set relative values for the overbought and oversold levels Bottom and Top for this indicator.
Most often, a good trend is visible visually on the price chart. But an experienced trader must clearly understand the current balance of power in the market before entering. And the indicator will
Embrace the Power With Ultimate Trend Trader Indicator. Facing the reality of individual traders, we are far from harnessing the capabilities of AI and high-frequency trading algorithms that dominate today's markets. Without access to massive data centers or infrastructure to compete on microseconds, the battle seems skewed. Yet, the true advantage lies not in technological arms but in leveraging human intellect to outsmart the competition. The Ultimate Trend Trader Indicator embodies this appr

Unlock the power of timely intra-day reversals with our cutting-edge "Intra-Day Reversal Arrow Indicator" available exclusively on MQL5. Designed to cater to traders seeking precision and efficiency in their trading strategies, this indicator offers clear visual signals pinpointing potential reversal points within the intraday market trends.
Key Features:
1. Arrow-Based Signals: Instantly identify potential reversal points with clear, easy-to-understand arrow signals displayed directly on

Draw On 1 Timeframe: Does exactly what the name says! When you draw a rectangle or trendline - the timeframe you draw it in, is the one it is visible. When you look at a higher or lower timeframe - the drawn object is not seen, but when you change back to the timeframe you originally draw in - the object can be seen. How to use it: This is an indicator that interacts with all trendline or rectangle objects drawn. Once running - it will automatically make any drawn trendline or rectangle objec

Market Structure MTF Dashboard Alerts: Is an fast way of checking the currently market structure on 4 timeframes! It lets you know if you are trading in the direction of both long-term and shor-term market bias. It is setup to track the High and Low positions to determine the current bias. Once the bias is shifting on the any of the 4 timeframes - you have the option to have an alarm notify you of the change. Once the alarm has gone off - you will be able to see a break of structure (BOS) form

Using the Neo Forex indicator algorithm, you can quickly understand what trend is currently developing in the market. The NeoX indicator accompanies long trends and can be used without restrictions on instruments or timeframes. Using this indicator you can try to predict future values. But the main use of the indicator is to generate buy and sell signals. The indicator tracks the market trend, ignoring sharp market fluctuations and noise around the average price. The indicator implements a type

The Compare Graphs indicator is an analysis tool that allows traders to compare two or more graphs on the same chart window. This indicator is commonly used in trading platforms such as MetaTrader and provides a clearer comparison of different financial instruments or time frames.
Functions of the Compare Graphs indicator may include: Selecting Charts: The trader can select the charts he wants to compare, such as price charts of different currency pairs or indicators on the same chart. Settin

Subscribe to the 'MA7 Trading' channel to receive notifications about new programs, updates and other information. Ask questions in the profile on the MQL5 .
Description of work
The 'MA7 Viola' indicator is based on the standard Moving Average (MA) indicator. Shows a sharp increase or decrease in the moving average. Detailed information about the 'MA7 Viola' indicator.
Indicator settings
General settings: Difference – difference between the last two MA values, percentage; Period ; Method

Make no mistake, this is not just another indicator; it's much more than that!
Welcome to a groundbreaking approach! Sunrise Divergence is not just another tool; it represents a deep understanding in how market dynamics are analyzed and traded. This indicator is crafted for traders who seek to navigate the markets with precision, leveraging the powerful concept of asset correlation, both positive and negative, to unveil trading opportunities that many overlook. In the markets, understanding t
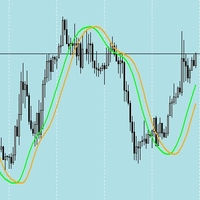
The Hull Moving Average (HMA) is renowned for its ability to smooth price movements effectively while maintaining responsiveness to recent price changes. When combined with a shifted Hull Moving Average crossover strategy, it offers a robust approach for identifying trends. Here's why: 1. Smoothness and Responsiveness : The HMA reduces noise in price data due to its weighted moving average calculation, which prioritizes recent prices. This smoothness helps filter out insignificant price fluctuat

RaysFX Forcaster è un indicatore avanzato per MetaTrader 4, progettato per fornire previsioni accurate del mercato. Questo indicatore utilizza un algoritmo sofisticato per calcolare i valori futuri basandosi su una serie di parametri configurabili dall'utente.
Caratteristiche principali: - TimeFrame : Permette all'utente di impostare il timeframe desiderato. Supporta diversi timeframes come M1, M5, M15, M30, H1, H4, D1, W1 e MN. - HalfLength : Questo parametro determina la lunghezza della met

MEGA TREND DASHBOARD
This Dashboard shows the Currency Strength across multiple timeframes. This SUPER DASHBOARD, Not only does it get your watchlist of currency pairs and shows the strength of each currency across the timeframes you Select - but also does it in a way that You can check it in 1 second!!! This indicator is very powerful because it is based on our custom algorithm to show the trends that are existing right now! The indicator does all the work for you by showing you what i

RaysFX Engulfing
RaysFX Engulfing è uno strumento potente per identificare i pattern di engulfing nel mercato Forex. Questi pattern sono segnali di inversione di tendenza che possono fornire opportunità di trading preziose. Caratteristiche principali : Rilevamento di pattern engulfing : L’indicatore identifica i pattern engulfing rialzisti e ribassisti, che sono segnali di possibili inversioni di tendenza. Segnali visivi : I pattern rilevati vengono evidenziati sul grafico con frecce blu e r

RaysFX DMI
Presentiamo l’Oscillatore RaysFX DMI, un indicatore personalizzato per la piattaforma di trading MetaTrader 4. Questo indicatore unico è progettato per fornire segnali di trading chiari e precisi basati sull’Indice di Movimento Direzionale (DMI). Caratteristiche principali: Oscillatore DMI: Calcola un oscillatore DMI basato su un periodo DMI specificato e un metodo di media mobile. Smoothing: L’oscillatore DMI viene ulteriormente lisciato in base a un periodo di lisciatura e a u

Subscribe to the 'MA7 Trading' channel to receive notifications about new programs, updates and other information. Ask questions in the profile on the MQL5 .
Description of work
The 'MA7 Galega' indicator is based on the standard Moving Average (MA) indicator. Shows a puncture of the moving average. Detailed information about the 'MA7 Galega' indicator.
Indicator settings
General settings: Period – MA period; Method – MA method; Apply to – price type; Consider the direction of the candle

RaysFX Dynamic Cycle Explorer (DCE) RaysFX Dynamic Cycle Explorer (DCE) è un potente indicatore di trading sviluppato per la piattaforma MetaTrader 4. Progettato con l’obiettivo di fornire ai trader un vantaggio competitivo, DCE utilizza algoritmi avanzati per identificare e segnalare le opportunità di trading più promettenti. Caratteristiche principali Multi-periodo: DCE utilizza sei periodi diversi per calcolare i suoi segnali, offrendo una visione completa del mercato. Super Trend Price: DCE
MetaTraderマーケットは、履歴データを使ったテストと最適化のための無料のデモ自動売買ロボットをダウンロードできる唯一のストアです。
アプリ概要と他のカスタマーからのレビューをご覧になり、ターミナルにダウンロードし、購入する前に自動売買ロボットをテストしてください。完全に無料でアプリをテストできるのはMetaTraderマーケットだけです。
取引の機会を逃しています。
- 無料取引アプリ
- 8千を超えるシグナルをコピー
- 金融ニュースで金融マーケットを探索
新規登録
ログイン