YouTubeにあるマーケットチュートリアルビデオをご覧ください
ロボットや指標を購入する
仮想ホスティングで
EAを実行
EAを実行
ロボットや指標を購入前にテストする
マーケットで収入を得る
販売のためにプロダクトをプレゼンテーションする方法
MetaTrader 4のための有料のテクニカル指標 - 110

The Geliosx indicator is designed to visually display the trend. One of the key tasks when monitoring the currency market is to determine the trend - a stable direction of price movement. Geliosx uses special calculations to smooth out sharp fluctuations that do not have a significant impact on the overall picture of the price movement.
This indicator is created for those who value their time and money.
The trend can be ascending (bull trend) or descending (bear trend). Typically, the trend
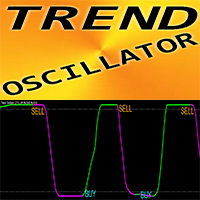
トレンドオシレーターは、高度なカスタムインジケーター、効率的な取引ツールです。
高度な新しい計算方法を使用 - パラメーター「計算価格」のオプションは 20 種類 これまでで最もスムーズなオシレーター 上昇トレンドの場合は緑色、下降トレンドの場合は赤色 売られすぎの値: 5 未満、買われすぎの値: 95 以上 このインジケーターを使用すると、PC およびモバイルアラートを使用して、標準戦略をアップグレードする機会が十分にあります
// より優れたエキスパートアドバイザーとインジケーターは、こちらで入手できます: https://www.mql5.com/en/users/def1380/seller // また、収益性が高く、安定していて信頼性の高いシグナルに参加することもできます https://www.mql5.com/en/signals/1887493 これは、この MQL5 Web サイトでのみ提供されるオリジナル製品です。

Support and Resistance Levels is an intelligent indicator that displays horizontal support and resistance levels, suitable for traders of different trading frequencies. You can select your preferred trading frequency, and the indicator will automatically calculate the support and resistance levels relevant to that frequency. Among these, the Bull-Bear Line is an interval used to distinguish the strength of bullish and bearish forces, and is an important level.
You can combine it with other in
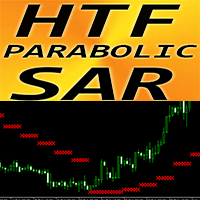
MT4 用外国為替インジケーター パラボリック SAR 高時間枠
MT4 用の優れた補助 HTF PSAR インジケーターを使用して、取引方法をアップグレードします。HTF は高時間枠を意味します PSAR は、価格変動のトレンド方向と潜在的な反転を判断するために使用されます。 このインジケーターは、トレーリング ストップに使用するのに最適です PSAR が価格より上にある場合 - 下降トレンド PSAR が価格より下にある場合 - 上昇トレンド このインジケーターは、メイン トレンドの方向への価格アクション エントリと組み合わせるのに最適です
// より優れたエキスパート アドバイザーとインジケーターは、こちらで入手できます: https://www.mql5.com/en/users/def1380/seller // また、収益性が高く、安定していて信頼性の高いシグナルに参加することもできます https://www.mql5.com/en/signals/1887493 これは、この MQL5 Web サイトでのみ提供されるオリジナル製品です。

Product Description: Precision Pattern Indicator for Consistent Profits Elevate your trading with the Precision Pattern Indicator, an advanced tool designed to spot a highly profitable and specific trading pattern. This indicator is your key to unlocking consistent profits with minimal effort. Key Features: Accurate Entry Signals: Receive clear entry signals with green arrows for buy opportunities and red arrows for sell opportunities, ensuring you never miss a profitable trade. Defined Risk Man

The Arriator forex indicator algorithm allows you to quickly determine the current trend in the market. The Elephant indicator accompanies long-term trends and can be used without restrictions on instruments or timeframes. This indicator not only helps predict future values, but also generates buy and sell signals. It tracks market trends, ignoring wild swings and market noise around the average price. The indicator implements a type of technical analysis based on the idea of market cyclicalit
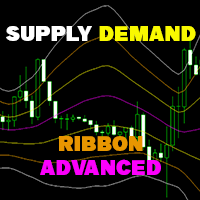
Supply Demand Ribbon is an indicator with moving supply and demand lines that help you identify price zones more easily.
The indicator helps you determine flexible entry, stop loss, and take profit areas.
There are also strategies for algorithmically changing ribbon colors.
From there you can come up with many trading strategies for yourself! You can try the Basic version here ! MT5 version: Click here! Feature in Advanced version: Hide/Show 2 Supply/Demand Over lines. Hide/Show 2

Indicatorul ANDROMEDA
Bun venit!
Indicatorul Andromeda este o creație nouă.
Acest indicator funcționează foarte bine pe H1.
Fiecare semnal asigură un profit cuantificat minim de 5, 10 sâmburi. Pentru profituri mai mari, se folosesc linii de rezistență, benzi TMA, Bollinger etc.
Singura problemă sunt știrile. Remediul pentru aceasta este Stop Loss.
Dacă indicatorul nu este afișat, citiți comentariul meu în secțiunea de comentarii pentru a afla cum să faceți acest lucru.
Verific

Lyre Histogram
Greetings!
The Lyre Histogram indicator is created for the M15 and M5 intervals.
Note Este posibil ca acești indicatori pe care îi punem în vânzare să nu funcționeze pe anumite platforme. De câțiva ani, unele platforme cu noi versiuni MT4 nu afișează toți indicatorii personalizați.
O soluție la această problemă este să descărcați acești indicatori pe o altă platformă de la un alt broker sau să reveniți la o versiune mai veche a MT4.
Am avut această problemă cu indicat

The Sirius X indicator reliably tracks market trends, ignoring wild swings and market noise. Suitable for trading on any timeframe, effectively filtering sudden price spikes and corrections by reducing market noise around the average price. For calculations, the indicator uses iLow, iHigh, iMA and iATR. The output based on these reliable indicators is also reliable. You can set up a sound signal and notifications, for example by email. The indicator does not redraw and works stably.
Configura
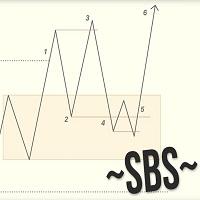
Swing Breakout Sequence | SBS presents a comprehensive trading strategy designed to help traders identify and capitalize on market swings and breakouts. The Swing Breakout Sequence (SBS) strategy is built around a series of well-defined steps to optimize trading decisions and improve profitability. Key Components of the SBS Strategy: Breakout Identification : The initial step involves identifying potential breakouts in the market. This is a crucial phase where traders look for key levels where t
To download MT5 version please click here .
- This is the exact conversion from TradingView: "Chandelier Exit" By "everget". - This is a non-repaint and light processing load indicator - input options related to coloring and labels are removed to fit into MetaTrader graphics. - Buffers are available for processing within EAs. - You can message in private chat for further changes you need.
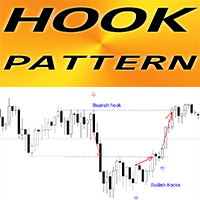
MT4 用 Forex インジケーター「フック パターン」
インジケーター「フック パターン」は、プライス アクション トレーディングに非常に強力なインジケーターです。再描画なし、遅延なし。 インジケーターは、チャート上の強気および弱気のフック パターンを検出します。 強気フック - チャート上の青い矢印信号 (画像を参照) 弱気フック - チャート上の赤い矢印信号 (画像を参照) PC、モバイル、および電子メール アラートが含まれています インジケーター「フック パターン」は、サポート/レジスタンス レベルと組み合わせるのに適しています: https://www.mql5.com/en/market/product/100903
// より優れたエキスパート アドバイザーとインジケーターは、こちらで入手できます: https://www.mql5.com/en/users/def1380/seller // また、収益性が高く、安定的で信頼性の高いシグナルに参加することもできます https://www.mql5.com/en/signals/1887493 これは、この
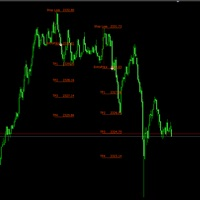
Best indicator for trend reversals Can be optimized for crypto trading or all currency pairs How to use:When the arrow appears, wait for the candle to close and open the order Level lines appear when candle closes, The system shows you the best entry levels It is simple and easy to use, no additional settings are required. Best indicator for beginners and professionals You can set the displayed stop loss and desired profit levels. You can use it alone or in addition to your strategy. Recommend
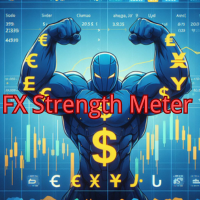
FX Strength Meter Pro は、外国為替市場で最適な取引機会を探求するトレーダー向けに設計された強力な指標です。当指標は主要通貨ペア(USD、EUR、GBP、CHF、AUD、NZD、JPY、CAD)の相対的な強弱をリアルタイムで表示し、取引戦略の最適化をサポートします。
主な特徴は以下の通りです:
- マルチタイムフレーム対応:分から月次チャート(M1、M5、M15、M30、H1、H4、D1、W1、MN1)まで、ユーザーは表示するタイムフレームを選択できます。左側に最も強い通貨が表示され、右に行くほど弱くなります。 - リアルタイム更新:秒単位での更新が行われ、常に最新の通貨強弱データが提供されます。 - 明確な視覚化:強弱関係は最も強いものから最も弱いものまで順に表示され、迅速な取引判断をサポートします。 - カスタマイズ可能な表示:テキストの色、フォントサイズ、行間を個人の好みやニーズに合わせて調整できます。
デフォルトの表示フォーマットは以下です:
- M1: JPY EUR NZD USD CHF CAD AUD GBP - M5: GBP E

We mark the fair value gap (FVG) and wait for the price to reach that zone, but sometimes it reverses before getting there. This can happen because we didn't notice the Balanced Price Range (BPR). My tools will enhance your analysis by displaying everything on the chart, helping you identify potential price reversal areas so you can make informed decisions about when to enter the market. MT5 - https://www.mql5.com/en/market/product/119228/ So, what is BPR or Balanced Price Range? A Balanced Pr

MT4 用 Forex インジケーター MA 加速、リペイントなし。
MA 加速 - スキャルピング インジケーターで、「MA スピード」インジケーターの補助ツールとして設計されています。
このインジケーターの計算は、物理学の方程式に基づいています。移動平均線の加速を示します。
MA 加速を使用すると、標準戦略でもアップグレードする機会がたくさんあります。SMA、EMA、LWMA に使用できます。 インジケーターの設定は非常に簡単です。
MA 加速インジケーターは、MA スピード インジケーターが値を変更する速度を示します。
MA 加速インジケーターの値が < 0 の場合: MA スピードは弱気方向に増加しています。MA 加速インジケーターの値が > 0 の場合: MA スピードは強気方向に増加しています。 MA 加速インジケーターは、MA スピード インジケーターと共に、メイン トレンドの方向のスキャルピング戦略で使用することをお勧めします。MA スピード インジケーターの値が < 0 の場合: トレンドが下降します。MA スピード インジケーターの値が > 0

Tired of sailing the seas of uncertainty in the financial market? Imagine having an experienced guide by your side, helping you unravel the mysteries of the charts and leading you safely towards financial success. With StakBank , you will have in your hands more than just a simple indicator. You will have a complete arsenal of tools to make assertive and profitable decisions . But what makes StakBank so special? Volume: Understand the driving force behind market movements , identifying support

Indicatorul Multivers
Bun venit!
Observați rezultatele foarte bune pe M15.
Dar funcționează bine și în celelalte intervale de timp. Trebuie doar să reglați TP, SL, Lot etc.
Noroc!
Dacă indicatorul nu este afișat, citiți comentariul meu în secțiunea de comentarii pentru a afla cum să faceți acest lucru.
Verificați mai întâi indicatorul sau expertul pe un cont DEMO, înainte de a-l cumpăra! Analizați-l bine! Vorbeste cu vanzatorul! Închiriați-l pentru o perioadă mai scurtă de timp. Pen

Why do I need to use the Market PA Monitor:
1.It is impossible to monitor multiple varieties and multiple TF of the market.
The market situation is constantly changing, with numerous varieties, and each variety has different timeframe from small to large. Each TF contains different market changes and trend alternations. Under numerous varieties and multiple TFs, there are countless trading opportunities every day. However, an ordinary trader cannot detect the trading opportunities of each v
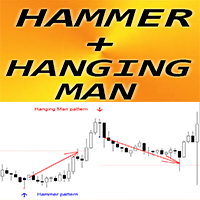
MT4 用 Forex インジケーター「ハンマーとハンギングマン パターン」
インジケーター「ハンマーとハンギングマン」は、プライスアクション取引に非常に強力なインジケーターです。再描画なし、遅延なし。 インジケーターは、チャート上で強気のハンマーと弱気のハンギングマンパターンを検出します: 強気のハンマー - チャート上の青い矢印シグナル (画像を参照) 弱気のハンギングマン - チャート上の赤い矢印シグナル (画像を参照) PC、モバイル、および電子メールアラート付き インジケーター「ハンマーとハンギングマン」は、サポート/レジスタンスレベルと組み合わせるのに最適です: https://www.mql5.com/en/market/product/100903
// より優れたエキスパートアドバイザーとインジケーターは、こちらで入手できます: https://www.mql5.com/en/users/def1380/seller // また、収益性が高く、安定的で信頼性の高いシグナルに参加することもできます https://www.mql5.com/en/signals

The GT_SqueezeBreakOut signal indicator is a momentum based strategy using the bollinger bands and standard deviation indicators (which indicate periods of low volatility and eventual breakout) as well as the Fisher momentum/trend indicator to filter quality trade signals. It shows the squeeze (price consolidation) periods on chart and also signals on breakout of squeeze/price consolidation. You get instant alert/ push notification both on chart and on any other device used to receive alert sig
-90% OFF
Golden Range 2 is one of the top entry indicators securing its future with its results. Indicator settings: Points = how precise pattern detection is AlertConfirmation = turn on(true) off(false) alert CalculatedBars = how many bars will be calculated
Please leave Positive comments, reviews. Buffer 0 Buy Arrow, Buffer 1 Sell Arrow, Buffer2 Buy Signal(Value:1/0), Buffer3 Sell Signal(Value:1/0) Buy Green, Sell Red
If you have any questions please email: win2mywin@gmail.com

Powerful Order Block indicator in Tradingview platform. Indicator type: Price Action indicator Introduction: The Order Block Indicator - Elevating Your Price Action Analysis. If you're seeking a comprehensive Order Block indicator on the MQL5 platform, look no further.
Firstly, according to this indicator, an OB is understood as a zone of pending orders from large institutions that haven't been fully executed, revealing themselves in the market through subtle signs. Prices react strongly wh
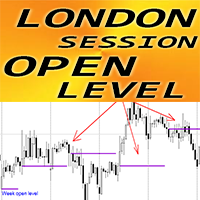
MT4 用 Forex インジケーター「ロンドン セッション オープン レベル」
インジケーター「ロンドン セッション オープン レベル」は、日中取引に非常に役立つ補助インジケーターです セッション オープン価格レベルは、日中に価格がそのエリアに戻ることが非常に多いため、非常に重要です。 インジケーターは、各日のロンドン セッション オープン価格レベルを毎日表示します また、インジケーターは月曜日の週オープン レベルも表示します 日中取引を行うトレーダーがターゲットを設定したり、サポート/レジスタンス エリアとして使用したりするのに役立ちます。
// より優れたエキスパート アドバイザーとインジケーターは、こちらで入手できます: https://www.mql5.com/en/users/def1380/seller // また、収益性が高く、安定していて信頼性の高いシグナルに参加することもできます https://www.mql5.com/en/signals/1887493 これは、この MQL5 Web サイトでのみ提供されるオリジナル製品です。
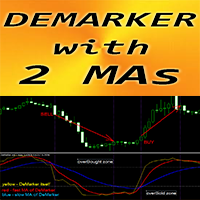
MT4 用 Forex インジケーター「DeMarker と 2 つの移動平均」
DeMarker オシレーター曲線は、インジケーター計算期間中の以前の高値と安値に対する現在の価格位置を示します 「DeMarker と 2 つの移動平均」インジケーターを使用すると、DeMarker オシレーターの高速移動平均と低速移動平均を確認できます 売りエントリーは買われすぎゾーン (0.7 以上) から、買いエントリーは売られすぎゾーン (0.3 以下) から取得するのに最適です インジケーターはパラメーターを使用して簡単に設定でき、どの時間枠でも使用できます 買いと売りのエントリー条件は画像で確認できます 買い (売り) シグナル条件を検討します: (1) - 売られすぎ (買われすぎ) で高速 MA が低速 MA を上向き (下向き) に交差: 買い (売り) 取引を開きます (2) - DeMarker 値が買われすぎゾーンで高速 MA を下向きに交差 (売られすぎゾーンで高速 MA を上向きに交差): 買い (売り) 取引を終了します
//より優れたエキスパートアドバイザーとイ

The Listo trend direction indicator shows the current trend direction by coloring the bars in red and blue. It is suitable for all currency pairs and timeframes. It is important to remember that to enter the market it is necessary to take into account an integrated approach and additional signals. The operating principle of the indicator is based on automatically determining the current state of the market and analyzing historical data when placing it on a chart.
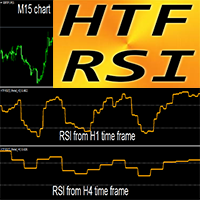
MT4 用 Forex インジケーター HTF RSI オシレーター
RSI 自体は、最も優れた、最も人気のあるオシレーターの 1 つです。HTF は、Higher Time Frame を意味します。
買われすぎゾーンは RSI が 70 を超える場合、売られすぎゾーンは RSI が 30 を下回る場合です。 RSI は、強気と弱気の価格モメンタムに関する情報を提供します。 このインジケーターは、プライス アクション エントリを使用するマルチタイム フレーム トレーディング システム、または他のインジケーターとの組み合わせに最適です。
HTF RSI インジケーターを使用すると、Higher Time Frame の RSI を現在のチャートに添付できます。 インジケーターには、モバイルおよび PC アラートが組み込まれています。
// より優れたエキスパート アドバイザーとインジケーターは、こちらで入手できます: https://www.mql5.com/en/users/def1380/seller // また、収益性が高く、安定していて信頼性の高いシグナルに参

Gann Angles Indicator The Gann Angles Indicator is a powerful technical tool based on the theory of William Delbert Gann. It helps traders identify potential support and resistance levels, as well as trend direction across various time intervals. Key features: Automatic determination of extremum within a specified time range Construction of 9 Gann Fan lines with angles of 82.5, 75, 71.25, 63.75, 45, 26.25, 18.75, 15, and 7.5 Flexible line color customization Adaptation to both upward an

Get rid of trading confusion and embrace stable income! Are you still worried about finding a low-risk and stable profit method? Are you still anxious about judging the market direction and controlling the risk of placing orders? The new cross-platform arbitrage indicator helps you easily achieve stable returns! Accurately capture arbitrage opportunities without you having to worry! The cross-platform arbitrage indicator is a powerful tool that can monitor the price differences of the same finan
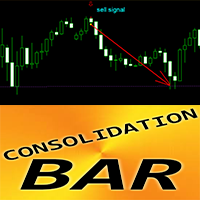
MT4 用 Forex インジケーター コンソリデーション バー パターン
インジケーター「コンソリデーション バー」は、価格アクション取引用の非常に強力なブレイクアウト重視のインジケーターです インジケーターは、1 つのバーの間に狭い領域で価格のコンソリデーションを検出し、ブレイクアウトの方向、保留中の注文、および SL の位置を表示します 強気のコンソリデーション バー - チャート上の青い矢印のシグナル (画像を参照) 弱気のコンソリデーション バー - チャート上の赤い矢印のシグナル (画像を参照) 再描画なし、遅延なし、高い R/R 比率 (報酬/リスク) PC、モバイル、メールアラートが含まれています インジケーター「コンソリデーションバーパターン」は、サポート/レジスタンスレベルと組み合わせるのに適しています: https://www.mql5.com/en/market/product/100903
// より優れたエキスパートアドバイザーとインジケーターは、こちらで入手できます: https://www.mql5.com/en/users/def1380/s

Indicatorul excepțional ISKANDER
Bun venit!
Studiați și experimentați excepționalul indicator IKANDER! Merita.
Funcționează pe toate intervalele de timp și pe toate perechile. Observați rezultatele foarte bune prezentate în aceste imagini și în videoclip.
Succes!
Notă Este posibil ca acești indicatori și experți pe care i-am scos la vânzare să nu funcționeze pe anumite platforme. De câțiva ani, unele platforme cu noi versiuni MT4 nu afișează toți indicatorii personalizați.
O soluție
Meta indicator
Bun venit!
Studiu și experiență Metaindicator. Există trei indicatori integrați într-unul singur.
Funcționează pe toate intervalele de timp și pe toate perechile. I prefer the M15.
Am deja o tranzacție câștigată cu el.
Succes!
Notă Este posibil ca acești indicatori și experți pe care îi avem de vânzare să nu funcționeze pe anumite platforme. De câțiva ani, unele platforme cu noi versiuni MT4 nu afișează toți indicatorii personalizați.
O soluție la această problemă

「MultiSymbol & TF Chart Integrated」インジケーターは、迅速に包括的な市場ビューを提供するために設計されており、好みの時間枠で最大60の通貨ペアを単一のチャートで監視すること(複数モード)や、すべての時間枠で取引しているペアを表示すること(シンプルモード)を可能にします。 主な利点: 完全監視: 単一のチャートで希望するすべてのペアを一目でリアルタイムで監視できます。
時間節約: チャート間の切り替えを避け、各ペアの動きをリアルタイムで確認できます。
トレンド分析: トレンドフォローのトレーダーに最適で、意思決定前にトレンドを確認するために上位の時間枠を見ることができます。
極端なカスタマイズ: インジケーターのすべての側面を特定のニーズに合わせて調整します。 極端なカスタマイズ: 高度に設定可能なインジケーターパラメーター:
シンボルと時間枠: 最大60の異なるシンボルを設定できます。 各シンボルには独自の時間枠を持つことができます(例:M1、M5、M15、M30、H1、H4、D1、W1、MN1)。 表示モード: シンプルモード: 特定の時間

Fibonacci Wave Bands Indicator The Fibonacci Wave Bands indicator utilizes Fibonacci ratios to create dynamic bands around a central moving average. These bands are derived from key Fibonacci ratios (typically 38.2%, 50%, 61.8%) and adapt to market volatility, offering insights into potential support and resistance zones. Key Features: Fibonacci Levels: The indicator plots multiple bands above and below a central moving average based on Fibonacci ratios. Dynamic Support and Resistance: Bands ser
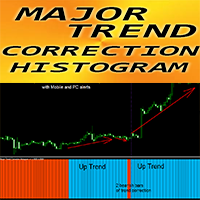
MT4 用 Forex インジケーター「主要トレンド修正ヒストグラム」
主要トレンド修正ヒストグラム インジケーターは、大きなトレンドを検出するために設計されました インジケーターは 2 色で表示されます: 弱気トレンドの場合は赤、強気トレンドの場合は青 (色は変更できます) 同じ色のヒストグラム列が 10 列以上連続している場合は、新しいトレンドの始まりを意味します インジケーターにはモバイルおよび PC アラートが組み込まれています インジケーターの感度を左右するパラメーター「期間」
インジケーターの使用方法: 1) 同じ色のヒストグラム列が 10 列以上連続しているかどうかを確認します。これは新しいトレンドの始まりを意味します (青 - 強気、赤 - 弱気) 2) 次に、反対色の列が 1 つまたは 2 つ発生し、メイン トレンドの色に戻った場合、これがトレンド修正です。 3) 修正後に検討すると良いでしょう。大きな上昇トレンドの場合は買いトレードを開き、大きな下降トレンドの場合は売りトレードを開きます。
// さらに優れたエキスパートアドバイザーとインジケーターは、
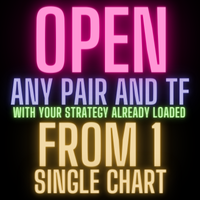
異なる通貨ペアやタイムフレームを監視するために複数のチャートを切り替えるのに疲れましたか? Pairs and TF Changer インディケーターがあなたのトレード体験を革新します! すべての戦略インディケーターを読み込んだら、 Pairs and TF Changer をチャートに追加します。必要に応じて、その位置、色、または表示する列数を調整できます! 主な特徴: シームレスな統合: このインディケーターを簡単にトレーディング戦略に統合できます。 ワンクリックで、すべての通貨ペアとタイムフレームを単一のチャートで取引できます。 追加のチャートを切り替えたり開いたりする必要がなくなります。 高度にカスタマイズ可能: チャート上の任意の位置にその位置を調整します(上、下、左、右)。 ボタンの1行または10行を表示するように設定できます。 トレーディングテーマに合わせて色をカスタマイズできます。 チャートを清潔で整然と保つためにボタンを透明にします。 ユニバーサルな互換性: すべての種類のインディケーターと戦略に対応しています。 外為、金属、米国株、指数、石油、先物、暗号通貨など、す
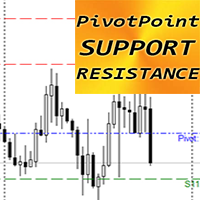
MT4 用 Forex インジケーター「ピボット ポイント サポート レジスタンス」
インジケーター「ピボット ポイント サポート レジスタンス」は、プライス アクション トレーディングの非常に強力な補助インジケーターです ピボット レベルは、前のトレーディング期間の市場パフォーマンスから重要な価格の平均として計算されます ピボット レベル自体は、全体的な市場状況に応じて、最高のレジスタンスまたはサポートのレベルを表します インジケーター「ピボット ポイント サポート レジスタンス」は、価格によって到達できる最も可能性の高い反転レベルを示します。 R1、R2、R3 - レジスタンス レベル (赤) S1、S2、S3 - サポート レベル (緑) 計算用の設定では、日次、週次、月次の前のトレーディング期間を使用できます インジケーター「ピボット ポイント レジスタンス サポート」は、プライス アクション パターンを介してテイク プロフィット ターゲットまたは価格反転を計画するのに最適です。 インジケーターの使用方法: 1) 対応するチャートにインジケーターを添付します 2) 必要な
Indicator de înaltă precizie
Bun venit!
Indicatorul de înaltă precizie a fost creat pentru intervalul de timp M5. Rezultatele sunt foarte bune. Vă recomandăm un TP = 10 sâmburi. Dar poate fi mai mare. Acest indicator are potențialul de a declanșa tranzacții mult mai lungi.
Experimentează-l!
Noroc!
IMPORTANT! Verificați mai întâi indicatorul sau expertul pe un cont DEMO, înainte de a-l cumpăra! Analizați-l bine!
Închiriați-l pentru o perioadă mai scurtă de timp. Pentru a vedea cum
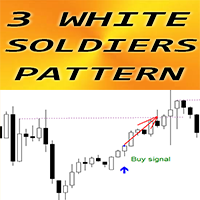
MT4 用 Forex インジケーター「3 White Soldiers パターン」
インジケーター「3 White Soldiers パターン」は、プライスアクション取引に非常に効果的です。再描画や遅延はありません。 インジケーターはチャート上で強気の 3 つの白い兵士のパターンを検出します: チャート上の青い矢印の信号 (画像を参照) PC、モバイル、および電子メールアラートが含まれています また、その兄弟である弱気の「3 つの黒いカラスのパターン」インジケーターも利用できます (以下のリンクに従ってください) インジケーター「3 つの白い兵士のパターン」は、サポート/レジスタンス レベルと組み合わせるのに最適です: https://www.mql5.com/en/market/product/100903
// より優れたエキスパート アドバイザーとインジケーターは、こちらで入手できます: https://www.mql5.com/en/users/def1380/seller // また、収益性が高く、安定的で信頼性の高いシグナルに参加することもできます https:

Misio - can be used as an independent trading system. The indicator determines the market trend, ignoring sharp fluctuations and noise around the average price. It displays the trending movement with potential stop points.
Simple, clear and effective use. The indicator does not redraw and does not lag. Suitable for all currency pairs and all timeframes.
Interpretation:
The location of the rate above or below the shadows indicates the presence of a trend. A move into the shadows signals a
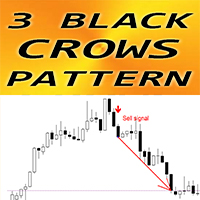
MT4 用 Forex インジケーター「3 Black Crows パターン」
インジケーター「3 Black Crows パターン」は、プライスアクション取引に非常に効果的です。再描画なし、遅延なし。 インジケーターはチャート上で弱気な 3 Black Crows パターンを検出します: チャート上の赤い矢印信号 (画像を参照) PC、モバイル、および電子メールアラートが含まれています また、その兄弟である強気の「3 White Soldiers パターン」インジケーターも利用できます (以下のリンクに従ってください) インジケーター「3 Black Crows パターン」は、サポート/レジスタンス レベルと組み合わせるのに最適です: https://www.mql5.com/en/market/product/100903
// より優れたエキスパート アドバイザーとインジケーターは、こちらで入手できます: https://www.mql5.com/en/users/def1380/seller // また、収益性が高く、安定的で信頼性の高いシグナルに参加することもできま

Indicatorul Argo
Indicatorul Argo este special creat pentru intervalul de timp M5. Rezultatele sunt foarte bune.
Indicatorul funcționează și pe intervale de timp mai lungi, dar semnalele sunt rare.
Marcatorul nu revopsește.
Vă recomandăm un TP minim de 5, 10 sâmburi pentru M5.
Acest indicator arată similar cu indicatorul Fantastic, dar este construit pe un model diferit.
Succes!
Note Dacă indicatorul nu este afișat, citiți comentariul meu în secțiunea de comentarii pentru a afla cu

Săgeți H1 Este creat pentru gama H1. Funcționează mai bine pentru perechile EURUSD și EURJPY. Marcatorul nu revopsește. Succes! Dacă indicatorul nu este afișat, citiți comentariul meu în secțiunea de comentarii pentru a afla cum să faceți acest lucru. Verificați mai întâi indicatorul sau expertul pe un cont DEMO, înainte de a-l cumpăra! Analizați-l bine! Închiriați-l pentru o perioadă mai scurtă de timp. Pentru a vedea cum funcționează și dacă funcționează pe computer.
The Reversal Candlestick Structure indicator detects multiple candlestick patterns occurring when trends are most likely to experience a reversal in real-time. The reversal detection method includes various settings allowing users to adjust the reversal detection algorithm more precisely.
A dashboard showing the percentage of patterns detected as reversals is also included. USAGE Figure 1 Candlestick patterns are ubiquitous to technical analysts, allowing them to detect trend continuati

MT4 用 Forex インジケーター「HTF ボリンジャー バンド」
MT4 用プロフェッショナル インジケーター「HTF ボリンジャー バンド」で取引方法をアップグレードしましょう。HTF は Higher Time Frame を意味します。 ボリンジャー バンドは市場で最高のインジケーターの 1 つで、取引に最適なツールです。 価格アクションの約 90% は 2 つのバンド間で発生します。 HTF ボリンジャー バンド インジケーターは、価格アクション エントリを使用するマルチタイム フレーム取引システム、または他のインジケーターとの組み合わせに最適です。 このインジケーターを使用すると、Higher Time Frame のボリンジャー バンドを現在のチャートに添付できます。
// より優れたエキスパートアドバイザーとインジケーターは、こちらで入手できます: https://www.mql5.com/en/users/def1380/seller // また、収益性が高く、安定していて、信頼性の高いシグナル https://www.mql5.com/en/signa
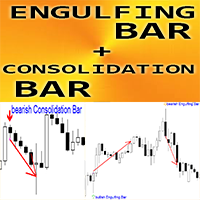
MT4 用 Forex インジケーター「エングルフィング バーとコンソリデーション バー パターン」
インジケーター「エングルフィング バーとコンソリデーション バー パターン」は、プライス アクション トレーディングに非常に効果的です インジケーターはチャート上のエングルフィング バーとコンソリデーション バーを検出します: 強気エングルフィング バー パターン - チャート上の緑の矢印信号 弱気エングルフィング バー パターン - チャート上のオレンジ色の矢印信号 強気コンソリデーション バー パターン - チャート上の青い矢印信号 弱気コンソリデーション バー パターン - チャート上の赤い矢印信号 再描画なし、遅延なし統合バー自体の R/R 比率 (報酬/リスク) は高いです
PC、モバイル、メールアラート付き インジケーター「エングルフィングバーと統合バーパターン」はサポート/レジスタンスレベルと組み合わせるのに最適です: https://www.mql5.com/en/market/product/100903
// より優れたエキスパートアドバイザーとインジ

To get access to MT5 version please click here . This is the exact conversion from TradingView: " WaveTrend" by LazyBear.
This is a light-load processing and non-repaint indicator. All input options are available. Buffers are available for processing in EAs. You can message in private chat for further changes you need. The filling area option is omitted to fit into MT4 graphics.
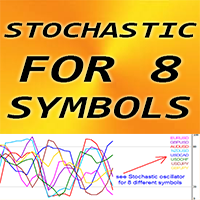
MT4 用 Forex インジケーター「8 シンボルのストキャスティクス」
ストキャスティクス オシレーターは市場で最も優れたインジケーターの 1 つであり、多くのトレーダーにとって最適なツールです。
買われすぎゾーン - 80 以上、売られすぎゾーン - 20 以下 80 以上のゾーンから売りエントリーを取り、20 以下から買いエントリーを取るのに最適です
「8 シンボルのストキャスティクス」を使用すると、1 つのチャートで最大 8 つの異なるシンボルのストキャスティクス値を制御できます このインジケーターは、プライス アクション エントリーと組み合わせるのにも最適です。
// より優れたエキスパート アドバイザーとインジケーターは、こちらで入手できます: https://www.mql5.com/en/users/def1380/seller // また、収益性が高く、安定していて信頼性の高いシグナルに参加することもできます https://www.mql5.com/en/signals/1887493 これは、この MQL5 Web サイトでのみ提供されるオリジ

GoTrend Multi-Timeframe インディケーター "GoTrend Multi-Timeframe" インディケーターは、異なる時間枠で通貨ペアの全体的および特定のトレンドを迅速かつ効率的に評価するためのトレーダーにとって必須のツールです。 このインディケーターは、トレーダーが市場の方向性を一目で明確かつ包括的に把握し、意思決定を最適化し、取引戦略の効果を高めることを可能にします。 主な特徴: マルチタイムフレーム分析: このインディケーターは、M5、M15、M30、H1、H4、D1の6つの異なる時間枠の詳細な分析を提供し、トレーダーが各期間のトレンドを理解できるようにします。 統合されたテクニカル指標: インディケーターは、RSI、SAR、MA、MACD、およびADXの5つの強力なテクニカル指標を使用して、各時間枠でのトレンド方向を決定します。 明確で直感的な視覚化: 信号は、直感的なシンボルと色でメインチャートの選択したコーナーに表示されます。これにより、トレーダーは一目で市場の状況を評価できます。 組み合わせ信号: 各指標の個別の信号に加えて、"GoTrend M

Trend oscillator indicator for tracking microtrends and pullbacks. Determines even a minor change in trend . Allows you to open positions in a timely manner in accordance with market changes. Works on all timeframes, all currency pairs, metals, indices and cryptocurrencies. Can be used when working with binary options. Distinctive features Does not redraw after the candle closes; Accurately detects trend changes; Simple and clear setup; Works on all timeframes and all trading instruments; Suit

Pipwise Indicators Multiple MAs The Pipwise Indicators Moving Averages indicator is a powerful tool for technical analysis in MetaTrader 4 (MT4). It allows traders to visualize and analyze moving averages from multiple periods on a single chart. Here are the key features:
Customizable Moving Averages: Traders can choose the number of moving averages to plot (up to 9 MAs). Each Moving Average is customiseable.
Method Selection: The indicator supports various moving average methods, includin

The Accelerator Oscillator (AC) technical indicator measures the acceleration or deceleration of the current market strength. It is designed to identify potential trend reversal points and is used to determine the moment of buying or selling assets. The indicator helps traders make decisions based on changes in market dynamics. This implementation of the indicator is its creative version. Since the standard version is very limited by its built-in settings, this implementation has significantly
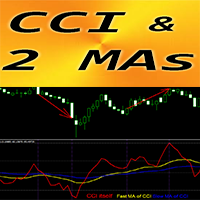
MT4 用 Forex インジケーター「CCI と 2 つの移動平均」
コモディティ チャネル インデックス (CCI) は、トレンド方向へのモメンタム トレーディングに最適です。 「CCI と 2 つの移動平均」インジケーターを使用すると、CCI インジケーターの高速移動平均と低速移動平均を確認できます 上昇トレンド - 高速 MA が低速 MA を上回ります。下降トレンド - 高速 MA が低速 MA を下回っています CCI は、取引で最も人気のあるオシレーターの 1 つです - 現在の価格と過去の平均価格の差を測定します オプション 1 - 50 から -50 の値の中心領域からトレンド方向にトレードを開始し、インジケーターがそれぞれ 200/-200 の領域に到達したら終了します 重要なレベル: +/-200、オプション 2 - +200 ゾーンより上から売りエントリーを取り、-200 より下からトレンド方向に買いエントリーを取ります インジケーターにより、トレンドの変化を非常に早い段階で確認する機会が得られます // より優れたエキスパート アドバイザーとインジケータ

Installation MetaTrader 4 Download: Download the provided file PrecisionStopDemo.ex4. Copy the File: Open MetaTrader 4. From the top menu, click on File > Open Data Folder. Navigate to MQL4 > Indicators. Copy the file PrecisionStopDemo.ex4 into this folder. Restart MetaTrader: Close and reopen MetaTrader 4. Add Indicator to Chart: In the Navigator (Ctrl+N), expand the Indicators folder. Find the indicator PrecisionStopDemo and drag it onto the desired chart.
Configuration After adding the i

Tired of navigating the sea of uncertainties in the financial market? Imagine having an experienced guide by your side, helping you decipher the mysteries of charts and leading you confidently toward financial success. With StakBank, you'll have more than just a simple indicator in your hands. You'll have a complete arsenal of tools to make assertive and profitable decisions. But what makes StakBank so special? Volume: Understand the driving force behind market movements, accurately identifying

Key Features: Pattern Recognition : Identifies Fair Value Gaps (FVGs) Spots Break of Structure (BOS) points Detects Change of Character (CHoCH) patterns Versatile Application : Optimized for candlestick charts Compatible with any chart type and financial instrument Real-Time and Historical Analysis : Works seamlessly with both real-time and historical data Allows for backtesting strategies and live market analysis Visual Representation : Draws rectangles to highlight significant areas on the cha

Volume Profile Indicator for MT4 Gain a trading edge with the "Volume Profile" indicator for MetaTrader 4 (MT4). This advanced technical analysis tool allows you to precisely identify key support and resistance levels based on transaction volume. Easily visualize market areas of high interest, where trading volumes are highest, and use this information to make more informed trading decisions. Key Features: Clear and detailed visualization : The indicator displays volume histograms directly on th

Insight Pro is a comprehensive tool for market analysis. It offers various features such as trend analysis, resistance and support levels, and distribution analysis, suitable for both novice and experienced traders. Features Trend Analysis Detects and visualizes market trends. Suggests potential entry and exit points based on trends. Customizable trend lines for clear market direction. Displays extreme levels based on standard deviation. Positive slope indicates buy orders; negative slope indic
Semnal M1 fără pierderi A
Indicatorul este creat pentru M1.
Semnalele sunt relativ rare, dar de bună calitate.
Succes!
Note Dacă indicatorul nu este afișat, citiți comentariul meu în secțiunea de comentarii pentru a afla cum să faceți acest lucru.
IMPORTANT! Verificați mai întâi indicatorul sau expertul pe un cont DEMO, înainte de a-l cumpăra! Analizați-l bine!
Închiriați-l pentru o perioadă mai scurtă de timp. Pentru a vedea cum funcționează și dacă funcționează pe computer.
Presentation of the "Color Range Indicator" The "Color Range Indicator" is a powerful technical analysis tool designed for the MT4 platform, perfect for traders who want a clear and immediate view of market trends. This indicator draws a colored line based on the current trend, making it easier to interpret price movements. Indicator Description: Green line : Indicates an uptrend. Use this signal to consider buying opportunities. Red line : Indicates a downtrend. Use this signal to consider sell
Trend Analyser Pro is a versatile trend analysis tool designed for traders who want to capitalize on market trends across multiple timeframes. This indicator combines advanced trend detection, dynamic signals, and higher timeframe analysis to provide you with a comprehensive view of market movements, empowering you to make well-informed trading decisions. 50% DISCOUNT - ENDING SOON ! BONUS - Trend Analyser Pro TradingView Indicator - After you purchase or rent this product, please send m

MT4 用 Forex インジケーター HTF 一目均衡表
一目均衡表は、最も強力なトレンド インジケーターの 1 つです。HTF は、Higher Time Frame を意味します。このインジケーターは、トレンド トレーダーや、プライス アクション エントリとの組み合わせに最適です。 HTF 一目均衡表を使用すると、Higher Time Frame の 一目均衡表を現在のチャートに添付できます。 上昇トレンド - 赤い線が青い線より上(両方の線が雲より上)/ 下降トレンド - 赤い線が青い線より下(両方の線が雲より下) 価格が一目均衡表の雲の上限を突破した場合にのみ買い注文をオープンします 価格が一目均衡表の雲の下限を突破した場合にのみ売り注文をオープンします HTF 一目均衡表インジケーターは大きなトレンドを捉える機会を提供します
// より優れたエキスパートアドバイザーとインジケーターは、こちらで入手できます: https://www.mql5.com/en/users/def1380/seller // また、収益性が高く、安定的で信頼性の高いシグナルへの参加も歓
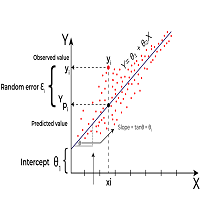
Linear Regression is a statistical method used to model the relationship between two or more variables. The primary goal of Linear Regression is to predict the value of one variable (called the dependent variable or outcome variable) based on the value of one or more other variables (called independent variables or explanatory variables) Linear Regression can be applied to technical analysis, and it is indeed one of the tools used by traders and analysts to make predictions and identify trends i
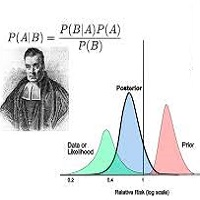
Bayesian methods can be effectively applied to predict price trends in financial markets, including Forex, stocks, and commodities. Here’s how Bayesian techniques can be used for trend prediction: 1. Bayesian Linear Regression Bayesian linear regression can be used to model the relationship between time and price. This method allows for the incorporation of prior beliefs about the trend and updates the trend as new data comes in. Example: Suppose you want to predict the price trend of a curren
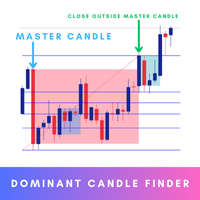
Dominant Candle Finder is a significant candlestick on a price chart that stands out due to its size, volume, or price movement compared to surrounding candles. It often indicates strong buying or selling pressure and can be used to identify potential reversal points, breakouts, or continuations in the market. Dominant candles can serve as key indicators for traders to make informed decisions, providing insights into market sentiment and potential future price movements. MT5 Version - https:

-AUDUSD M15 - Every time there is any crossing of the RED lines , it means sell. - Every time there is any crossing of the GREEN lines , it indicates buy.
Discover the Future of Trading with Our Exclusive Indicator! In the dynamic world of financial markets, precision and the ability to anticipate movements are crucial for success. With this in mind, we have developed an exclusive indicator that combines cutting-edge technology with a sophisticated approach to offer you an indispensable to

The Accumulation/Distribution (AD) Technical Indicator is a tool used in technical analysis to determine whether an asset is being accumulated (bought) or distributed (sold) in the market. Key Characteristics of the AD Indicator: Purpose: The AD indicator is used to assess the balance between buying (accumulation) and selling (distribution) of an asset. This helps traders and investors evaluate the strength of the current trend and potential reversals. Interpretation: Rising Indicator: When the
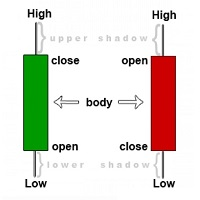
The indicator searches for candles on the price chart that are larger than those specified in the settings and marks them on the chart.
You can choose two types of candle size measurement (Units of Calculation): Points and Percentages. Points - size calculation will be in points. (for a five-digit quote point = 0.00001 and similarly for others)
Percentages - the candle size will be calculated as a percentage. You can also choose between which values to measure (Between Levels):
High/L

Advance Currency Meter is a currency meter that detects strong market trends. This indicator is good for scalping, intraday trading and swing trading. The indicator will detect short term to long term market trends. This will give you good insight which currencies are best to trade as of the moment.
Note : Kindly contact me before you make any purchases. Works well with my MACD Currency Strength Meter
MetaTraderマーケットはトレーダーのための自動売買ロボットやテクニカル指標を備えており、 ターミナルから直接利用することができます。
MQL5.community支払いシステムはMetaTraderサービス上のトランザクションのためにMQL5.comサイトに登録したすべてのユーザーに利用可能です。WebMoney、PayPal または銀行カードを使っての入金や出金が可能です。
取引の機会を逃しています。
- 無料取引アプリ
- 8千を超えるシグナルをコピー
- 金融ニュースで金融マーケットを探索
新規登録
ログイン