YouTubeにあるマーケットチュートリアルビデオをご覧ください
ロボットや指標を購入する
仮想ホスティングで
EAを実行
EAを実行
ロボットや指標を購入前にテストする
マーケットで収入を得る
販売のためにプロダクトをプレゼンテーションする方法
MetaTrader 4のための有料のテクニカル指標 - 108
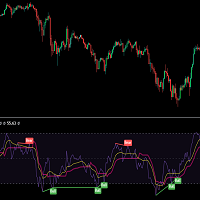
MOST is applied on this RSI moving average with an extra default option added VAR/VIDYA (Variable Index Dynamic Moving Average)
MOST added on RSI has a Moving Average of RSI and a trailing percent stop level of the Moving Average that can be adjusted by changing the length of the MA and %percent of the stop level.
BUY SIGNAL when the Moving Average Line crosses above the MOST Line
LONG CONDITION when the Moving Average is above the MOST
SELL SIGNAL when Moving Average Line crosses belo
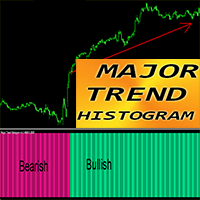
MT4用FXインジケーター「メジャートレンドヒストグラム」
本当に大きなトレンドを捉えるように設計されたメジャー トレンド ヒストグラム インジケーター インジケーターは 2 色で表示できます: 弱気トレンドの場合は DeepPink、強気トレンドの場合は SpringGreen (色は変更可能) 初期段階でトレンドを検出します。標準的な MA クロスよりもはるかに効率的です。 メジャー トレンド ヒストグラムは、プライス アクション、VSA、その他の指標など、他の取引方法と組み合わせることができます。 インジケーターにはモバイルおよび PC アラートが組み込まれています
// さらに優れたエキスパートアドバイザーとインジケーターはここから入手できます: https://www.mql5.com/en/users/def1380/seller // また、収益性が高く、安定していて信頼性の高いシグナル https://www.mql5.com/en/signals/1887493 に参加することも歓迎します。 当MQL5サイトのみでご提供しているオリジナル商品です。
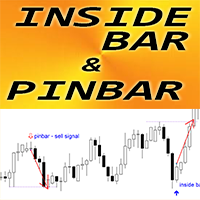
MT4用外国為替インジケーター「インサイドバー&ピンバーパターン」
インジケーター「インサイドバー&ピンバーパターン」はプライスアクション取引に非常に強力です インジケーターはチャート上のインサイドバーとピンバーパターンを検出します。 強気パターン - チャート上の青い矢印シグナル (写真を参照) 弱気パターン - チャート上の赤い矢印シグナル (写真を参照) 再塗装は不要です。 遅延はありません。 インサイドバー自体のR/R比(報酬/リスク)が高い PC、モバイル、電子メールによるアラート インジケーター「インサイドバー&ピンバーパターン」はサポート/レジスタンスレベルと組み合わせるのに最適です: https://www.mql5.com/en/market/product/100903
// さらに優れたエキスパートアドバイザーとインジケーターはここから入手できます: https://www.mql5.com/en/users/def1380/seller // また、収益性が高く、安定していて信頼性の高いシグナル https://www.mql5.com/en/sign

MA Trend Following Indicator for MT4 is a simple technical analysis tool designed to follow the trend in any currency pair chosen by the trader by combining 3 moving averages on two different time frames, one long term and one short term.
It basically provides a bullish or bearish signal when the moving averages on one time frame align with the moving averages on a different time frame to have a confluence signal.
The indicator is presented as a screener with multiple currency pairs (that
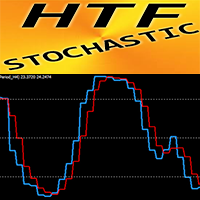
MT4の外国為替インジケーターHTFストキャスティクス
確率的オシレーターは市場で最高のインジケーターの 1 つであり、多くのトレーダーにとって完璧なツールです。 HTF とは、より高い時間枠を意味します。 買われすぎゾーン - 80 以上。 売られすぎ 1 - 20 未満 HTF 確率的インジケーターは、特にプライスアクションエントリーを伴うマルチタイムフレーム取引システムに優れています。 このインジケーターを使用すると、より高い時間枠から現在のチャートにストキャスティクスを接続できます --> これはプロの取引アプローチです インジケーターにはモバイルおよび PC アラートが組み込まれています HTF 確率オシレーターは、通常の発散検出にも使用できます。
// さらに優れたエキスパートアドバイザーとインジケーターはここから入手できます: https://www.mql5.com/en/users/def1380/seller // また、収益性が高く、安定していて信頼性の高いシグナル https://www.mql5.com/en/signals/1887493 に参加す

MAXLUM SYSTEM is a Trading System that uses anti-Margin Call without using SL with a positive correlation Hedging Strategy
Simple example of BUY on EURUSD and SELL on GBPUSD at the same time This kind of trading will not occur as a Margin Call By calculating the GAP difference between the 2 pairs we can take advantage of the GAP
This indicator will be more effective if you use Data Analysis download excel file on telegram Group Please join the Maxlum System Telegram group for details t.me/m

This tool helps you to find easily and clearly when you enter trade with day time and price examples Entered Buy at Monday 20:30 with price 2150 Exited buy at Tues 10: 30 with price 2187 You can convert as local time by inputting shift hours and minutes.
Trading is a learning skill, so you have to evaluate your trading performance at the end of your day. Did you follow your rules? If you did then it was a win, regardless if you earned pips or not. If you didn't follow my rules then is a
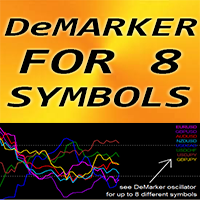
MT4用外国為替インジケーター「DeMarker for 8 Symbols」、リペイントなし
DeMarker オシレーター カーブは、インジケーター計算期間中の以前の高値および安値と比較した現在の価格の位置を示します。 DeMarker は、他のオシレーターの中で最も効率的な規則的な発散信号を提供します。 買われすぎゾーン (0.7 以上) で定期的に発散する売りエントリーと、売られすぎゾーン (0.3 以下) で定期的に発散する買いエントリーを取得するのは素晴らしいことです。 「8 シンボルの DeMarker」は、1 つのチャート上で最大 8 つの異なるシンボルの DeMarker 値を制御する機会を提供します。 このインジケーターは、売られすぎ/買われすぎエリアからの価格アクションのエントリーと組み合わせるのにも優れています。
// さらに優れたエキスパートアドバイザーとインジケーターはここから入手できます: https://www.mql5.com/en/users/def1380/seller // また、収益性が高く、安定していて信頼性の高いシグナル http
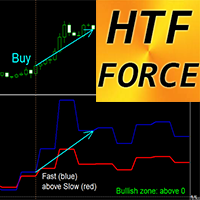
MT4用外国為替インジケーターHTFフォースオシレーター
HTF Forceは、マルチタイムフレーム取引のための強力なインジケーターです。 HTF とは、より高い時間枠を意味します。 フォースインデックスは、価格と出来高のデータを単一の値に結合する最上位の指標の 1 つです。 高時間枠の値はトレンドの方向を示すことができます (下降傾向 - 0 未満、上昇傾向 - 0 より上) ファストフォース - 青線、スローフォース - 赤線 買いシグナル - 速いラインが遅いラインを上向きにクロスし、両方 - 0 を上回ります (図を参照) 売りシグナル - 速いラインがクロスする 遅いラインが下向き、および両方 - 0 を下回る (図を参照) インジケーターにはモバイルおよび PC アラートが組み込まれています
// さらに優れたエキスパートアドバイザーとインジケーターはここから入手できます: https://www.mql5.com/en/users/def1380/seller // また、収益性が高く、安定していて信頼性の高いシグナル https://www.mql5.com/
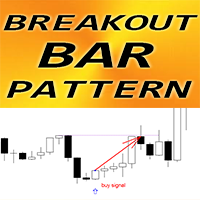
MT4用FXインジケーター「ブレイクアウトバーパターン」
インジケーター「ブレイクアウト バー パターン」は、プライス アクション取引にとって非常に強力なインジケーターです。再描画や遅延はありません。 インジケーターはチャート上のブレイクアウトバーパターンを検出します。 強気ブレイクアウトバーパターン - チャート上の青い矢印シグナル (写真を参照) 弱気ブレイクアウトバーパターン - チャート上の赤い矢印シグナル (写真を参照) PC、モバイル、電子メールによるアラート インジケーター「ブレイクアウトバーパターン」はサポート/レジスタンスレベルと組み合わせるのに最適です: https://www.mql5.com/en/market/product/100903
// さらに優れたエキスパートアドバイザーとインジケーターはここから入手できます: https://www.mql5.com/en/users/def1380/seller // また、収益性が高く、安定していて信頼性の高いシグナル https://www.mql5.com/en/signals/1887493 に

The Tripl indicator is designed to visually display the current trend in the market. One of the key aspects of currency market analysis is identifying a trend, which is a stable direction in which prices are moving. For this purpose, the Tripl indicator uses calculations that smooth out sharp fluctuations that do not have a significant impact on the overall trend of price movements.
A trend can be either upward (bullish) or downward (bearish). Most often, a trend develops for a long time befo

With the growth of information technology and the increasing number of participants in financial markets, traditional analysis tools are becoming less effective. Conventional technical indicators, such as the moving average or stochastic, in their pure form are unable to accurately determine the direction of the trend or its reversal. Is it possible to find an indicator that remains effective for 14 years without changing its parameters, and at the same time adapts to market changes? Yes, such

この取引ツールを使用すると、15の市場を同時にスキャンできます。
新しい取引インジケーター2024のご紹介:
️ダッシュボード マルチ通貨 マルチタイムフレーム ダブルCCI。
この取引ツールを作成した理由は少なくとも2つあります。
まず、1つの市場だけを観察することに飽き飽きしています。
次に、別の市場でのエントリーの瞬間を失いたくないのです。
そのため、同時に他の市場の状況を知りたいのです。
このため、複数の市場の状況を同時にスキャンできるスキャナーが必要です。
私は、高速CCIライン> (または<=) 低速CCIラインがM1からH4 (またはM1からM30のみ) から始まる市場をよく探します。
私の分析に同意するなら、これはあなたが探していた取引インジケーターです。
市場の状況が上記の要件を満たす瞬間を逃さないでください。
これは、多くの優れた機能を備えたストキャスティクスのスキャナーまたはダッシュボードです。
高速 CCI ラインのデータを表示できます 低速 CCI ラインのデータを表示できます 高速 CCI ラインと低速 C
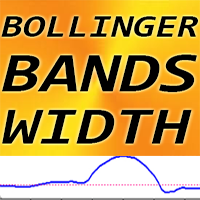
MT4の外国為替インジケーターのボリンジャーバンド幅、再ペイントなし。
-BB幅インジケーターは、標準のボリンジャーバンドインジケーターと併用することができます。 -ボリンジャーバンドインジケーターの組み合わせは非常に優れているため、このソフトウェアはすべてのボリンジャーバンドインジケーターファンにとって必須です。 ブレイクアウトをトレードするのに効率的 -BB幅インジケーターはボリンジャーバンド間の距離(スパン)を示します。
BB幅の使用方法(写真の例を参照): 1) 過去 6 か月の BB 幅の最小値を見つけ、この値に 25% を加算して LEVEL を取得します。 2) BB幅インジケーターにLEVELを取り付けます。 ボリンジャーバンドインジケーターもチャートに添付します。 3)価格がボリンジャーバンドインジケーターの境界線の間でフラットになり、BB幅の値がレベルを下回るまで待ちます。 4) ボリンジャーバンドインジケーターの境界を通過するブレイクアウトを待ちます(ローソク足はバンドの外側で閉じるはずです)、BB幅を確認してください - それはレベルより上である必要が
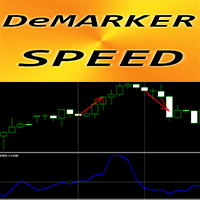
MT4用外国為替インジケーター「DeMarker Speed」
この指標の計算は物理学の方程式に基づいています。 DeMarker Speed は DeMarker 自体の 1 次派生です DeMarker オシレーター カーブは、インジケーター計算期間中の以前の高値および安値と比較した現在の価格の位置を示します。 DeMarker スピードは、標準の DeMarker オシレーターが売られ過ぎ/買われ過ぎゾーンにある場合にエントリーをスキャルピングするのに適しています (写真のように) DeMarker 速度インジケーターは、DeMarker 自体が方向を変える速度を示します - 非常に敏感です DeMarker 速度インジケーターの値が 0 未満の場合: 速度は負です。 DeMarker 速度インジケーターの値が > 0 の場合: 速度は正です インジケーターにはモバイルおよび PC アラートが組み込まれています
// さらに優れたエキスパートアドバイザーとインジケーターはここから入手できます: https://www.mql5.com/en/users/def1380/

この取引ツールを使用すると、15 の市場を同時にスキャンできます。
新しい取引指標 2024 のご紹介:
️ ダッシュボードのマルチ通貨マルチタイムフレームダブルRSI。
私がこの取引ツールを作成した理由は少なくとも 2 つあります。
まず、1 つの市場だけを観察することに飽きました。 次に、別の市場への参入の瞬間を逃したくないです。
だからこそ、他の市況も同時に知りたいのです。
このため、複数の市場の状況を同時にスキャンできるスキャナーが必要です。
私は、高速 RSI ライン > (または <=) 低速 RSI ラインが M1 から H4 (または単に M1 から M30) で始まる市場をよく探します。
また、M1 から M30 まで売られすぎ/買われすぎの市場をよく探します。
私の分析に同意するなら、これがあなたが探していた取引指標です。
市況が上記の要件を満たす瞬間を見逃さないでください。
これは、多くの優れた機能を備えたストキャスティックのスキャナーまたはダッシュボードです。
高速RSIラインのデータを表示可能 遅いRSIライ
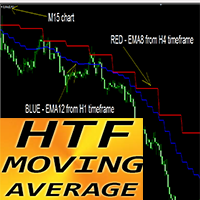
MT4の外国為替インジケーターHTF移動平均
MT4 用のプロフェッショナルな HTF MA インジケーターを使用して取引方法をアップグレードします。 HTF とは、より高い時間枠を意味します。 このインジケーターは、プライスアクションエントリーを持つトレンドトレーダーに最適です。 HTF MA インジケーターを使用すると、より高い時間枠からの移動平均を現在のチャートに添付できます。 インジケーターはより高い時間枠からの傾向を示します --> これは常に収益性の高い方法です。 HTF MA インジケーターは、低リスクで大きな利益を得る機会を与えます。
使い方: D1 から H4 または H1 チャートに MA を添付します H4 から H1、M30、または M15 のチャートに MA を添付します など(写真参照)
// さらに優れたエキスパートアドバイザーとインジケーターはここから入手できます: https://www.mql5.com/en/users/def1380/seller // また、収益性が高く、安定していて信頼性の高いシグナル https://www.m

Elevate your trading game with TigerSignals – the ultimate MetaTrader 4 indicator. Designed for simplicity and precision, TigerSignals provides crystal-clear buy and sell signals, making it a must-have for traders of all levels.
Features: User-Friendly: Easy-to-use interface ensures hassle-free integration into your trading strategy. Alerts: Sound, phone, and email alerts. Receive notifications when a new signal appears, giving you the freedom to step away from the chart! Lot Size Calcula

The indicator show Higher timeframe candles for ICT technical analisys Higher time frames reduce the 'noise' inherent in lower time frames, providing a clearer, more accurate picture of the market's movements.
By examining higher time frames, you can better identify trends, reversals, and key areas of support and resistance.
The Higher Time Frame Candles indicator overlays higher time frame data directly onto your current chart.
You can easily specify the higher time frame candles yo
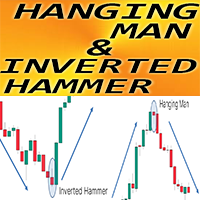
MT4用外国為替インジケーター「ぶら下がっている男と逆ハンマーパターン」
インジケーター「ハンギングマンと逆ハンマーパターン」は、プライスアクション取引にとって非常に強力なインジケーターです。再描画や遅延はありません。 インジケーターは、チャート上で強気の逆ハンマーパターンと弱気のハンギングマンパターンを検出します。 強気の逆ハンマー - チャート上の青い矢印シグナル (写真を参照) 弱気のハンギングマン - チャート上の赤い矢印シグナル (写真を参照) PC、モバイル、電子メールのアラートが含まれています インジケーター「ハンギングマンと逆ハンマーパターン」は、サポート/レジスタンスレベルと組み合わせるのに最適です: https://www.mql5.com/en/market/product/100903
// さらに優れたエキスパートアドバイザーとインジケーターはここから入手できます: https://www.mql5.com/en/users/def1380/seller // また、収益性が高く、安定していて信頼性の高いシグナル https://www.mql5.c

Auto Multi Channels VT Ещё один технический индикатор в помощь трейдеру. Данный индикатор, автоматически показывает, наклонные каналы в восходящем,
нисходящем и боковом движении цены, т.е. тренды. (Внутри дня. Среднесрочные и долгосрочные, а также Восходящие, нисходящие и боковые).
О понятии Тренд. На бирже, трендом называется направленное движение ценового графика в одну из сторон (вверх или вниз) . То есть, тренд в трейдинге — это ситуация,
когда цена определенное время возрастает или

Introducing the Ultimate Horizontal Line Alert Indicator for MT4! Transform your trading with the smartest tool in the market. Our Horizontal Line Alert Indicator isn't just any indicator — it's your new trading partner that combines precision, flexibility, and intuitive control. What Does It Do? This revolutionary MT4 indicator automatically adjusts trend lines to be horizontal with just the press of the 'L' key. It’s perfect for traders who want to focus on specific price levels, ensu
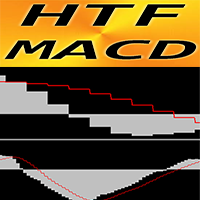
MT4用外国為替インジケーターHTF MACDオシレーター
HTF とは、より高い時間枠を意味します。 MACD インジケーター自体は、トレンド取引で最も人気のあるインジケーターの 1 つです。 このインジケーターは、プライスアクションエントリーまたは他のインジケーターと組み合わせたマルチタイムフレーム取引システムに最適です。 HTF MACD インジケーターを使用すると、より高い時間枠から現在のチャートに MACD を添付できます --> これはプロの取引アプローチです インジケーターにはモバイルおよび PC アラートが組み込まれています
// さらに優れたエキスパートアドバイザーとインジケーターはここから入手できます: https://www.mql5.com/en/users/def1380/seller // また、収益性が高く、安定していて信頼性の高いシグナル https://www.mql5.com/en/signals/1887493 に参加することも歓迎します。 当MQL5サイトのみで販売しているオリジナル商品です。
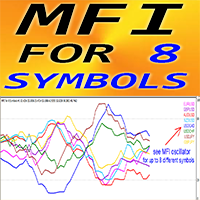
MT4用FXインジケーター「MFI for 8 Symbols」。
マネー フロー インデックス (MFI) は、売られすぎゾーンと買われすぎゾーンを識別するために価格と出来高のデータを使用するテクニカル オシレーターです。 MFI が 80 を超えている場合は買われすぎから売りエントリーを取得し、20 を下回っている場合は売られすぎから買いエントリーを取得するのは素晴らしいことです。 MFIはダイバージェンス検出に非常に役立ち、プライスアクションと組み合わせるのも最適です。 「MFI for 8 Symbols」は、1 つのチャート上で最大 8 つの異なるシンボルの MFI 値を制御する機会を与えます。 MFI オシレーターは、強気および弱気の価格の勢いに関する情報を提供します
// さらに優れたエキスパートアドバイザーとインジケーターはここから入手できます: https://www.mql5.com/en/users/def1380/seller // また、収益性が高く、安定していて信頼性の高いシグナル https://www.mql5.com/en/signals/1
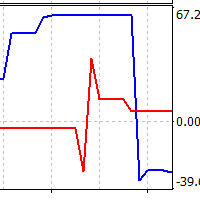
Two lines are being drawn in a separate window. And both are representing an angle of a trendline. One trendline is measured going across two price highs, but the other is measured across two lows. You get to choose the period from which the first price high and first price low is being determined. The second high and low comes from identical time period preceding the first one. Feel free to experiment with the period count until you get the confirmation you are looking for.

TrendWave Oscillator is an advanced MT4 oscillator that not only identifies the trend direction but also provides visual and audio alerts to enhance trading strategies.
Key Features: - Color-coded trend indication: - Blue : Indicates an uptrend, signaling potential price growth. - Orange : Indicates a downtrend, suggesting possible price decline. - Gray : Represents a flat market or lack of clear entry signals.
- Graphical signals on the chart : - Aqua : Highlights an uptrend, empha
AlphaTrend AM is an indicator that allows you to open a position at the very beginning of a significant price movement. The second most important quality of the indicator is the ability to follow the trend as long as possible in order to obtain all potential profits while minimizing potential losses. The indicator determines the trend and points to possible entry points formed by local highs/lows. The indicator allows you to notify the user about your signals by sending messages to the terminal

Safe Trade Indicator MT4
The Safe Trade indicator is an analytical and technical tool that has different features and very accurate signals. This indicator can be used in various markets such as the stock market and the forex market. It states and also provides buy and sell signals.
Features of the Safe Trade indicator
Receiving signals as notifications on the Metatrader mobile application. Receive signals by email. Receiving signals in the form of warning messages or alarms on Metatrader.

タイトル: BBMA 構造ガイド - BBMA 構造ガイド
説明: BBMA 構造ガイドは、BBMA 構造の進化をより簡単かつ効率的に理解するのに役立つ特別な MQL4 インジケーターです。BBMA、または「Bollinger Bands Moving Average」は、「一歩先を行く」というモットーで知られており、市場構造を深く理解することの重要性を強調しています。
BBMA 構造ガイドを使用すると、価格変動の基本的な市場構造パターンを迅速に識別できます。これにより、より正確かつ効果的な取引の決定が可能になります。このインジケーターは情報を明確で直感的に表示し、次の取引ステップをより自信を持って進むことができます。
主な特徴: - **深い理解:** BBMA 構造ガイドは、市場構造を明確に示し、市場のダイナミクスをより良く理解できます。 - **使いやすさ:** 直感的なインターフェイスで設計されており、すべての経験レベルのトレーダーが簡単に使用できます。 - **強力なシグナル:** このインジケーターは、**CSAK**(キャンドルスティックの強力な方向)や *
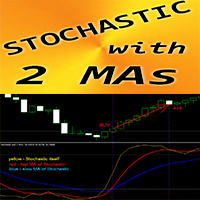
MT4用外国為替インジケーター「確率的および2つの移動平均」
確率的オシレーターは市場で最高のインジケーターの 1 つであり、多くのトレーダーにとって完璧なツールです。 「確率的および 2 移動平均」インジケーターを使用すると、確率的オシレーターの高速移動平均と低速移動平均を確認できます。 買われすぎゾーン - 80 以上。 売られすぎ 1 - 20 未満 80 ゾーンを超えるゾーンから売りエントリーを取得し、20 ゾーン未満から買いエントリーを取得するのは素晴らしいことです。 写真で売買エントリー条件を確認できます。 買い(売り)シグナル条件を考慮してください。 (1) - 売られ過ぎ(買われ過ぎ)で速いMAが遅いMAを上向き(下向き)にクロスする: 買い(売り)取引を開始する (2) - 確率的値が買われ過ぎゾーンにあり、MA を下向きに高速で交差します (売られ過ぎゾーンでは MA を上向きに高速で交差します): 買い (売り) トレードからの終了
// さらに優れたエキスパートアドバイザーとインジケーターはここから入手できます: https://www.mql5.co

TLBD Chart Indicator MT4
Drawing a trend line in price charts is one of the most important methods to identify the market trend, many traders use the trend line break for positioning because they believe that the trend line break means changing the trend and creating a new trend. As a result, the breaking of the trend line is an important sign for traders to open their positions in the direction of the trend. The TLBD indicator is a very suitable tool for detecting the breaking of dynamic tren

Market Magnet - This is not just a convenient tool, but rather an indispensable assistant for those who prefer to analyze the market using a clean chart. Sometimes even experienced traders need an additional analytical tool to identify key entry and exit points for trades. That's where Market Magnet comes in.
This indicator is ideal for those who often have difficulty identifying trend inflection points or drawing trend lines on a chart. It offers a visual representation of key market moments
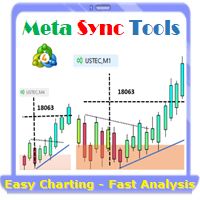
Supercharge Your MetaTrader Analysis and Trading with Meta Sync Tools! Struggling to analyze price action across different timeframes? Meta Sync Tools eliminates the frustration of unsynced crosshairs and charts, allowing seamless multi-timeframe analysis. Missing key correlations between assets and constantly switching between charts? Meta Sync Tools empowers you to visualize relationships between instruments effortlessly. Tired of wasting time on repetitive tasks? With 30+ Customizable Short

Introduction
The "Smart Money Concept" transcends mere technical trading strategies; it embodies a comprehensive philosophy elucidating market dynamics. Central to this concept is the acknowledgment that influential market participants manipulate price actions, presenting challenges for retail traders.
As a "retail trader", aligning your strategy with the behavior of "Smart Money," primarily market makers, is paramount. Understanding their trading patterns, which revolve around supply

MT4指標紹介:Kラインレベル指標、トレーダーが100%取引機会を特定するのを支援 概要: Kラインレベル指標は、トレーダーが高確率な取引機会を特定するのを支援する強力な技術分析ツールです。Kラインの高値、安値、始値、終値を分析することにより、この指標は価格行動のサポートとレジスタンスレベルを明らかにし、明確な視覚効果で提示します。 機能: 潜在的なトレンド反転の特定: 価格行動が停滞または反転する可能性のある領域を特定し、トレンド方向に沿った取引を可能にします。 ブレイクアウトの活用: サポートとレジスタンスレベルのブレイクアウトを予測し、ブレイクアウトの勢いを捉え、利益を最大化できるようにします。 エントリーとエグジットポイントの最適化: 取引の最適なエントリーとエグジットポイントを正確に特定し、全体的な取引精度を向上させます。 利点: 100%の取引機会の特定: サポートとレジスタンスレベルを特定することで、すべての潜在的な取引機会を発見するのを支援します。 明確で理解しやすいチャート: サポートとレジスタンスレベルをチャートに直接描画することで、市場構造を一目瞭然で把握できます

hint: my basic indicators are used like that KingLevel combind with KingSequence will provides basic insights of the price action of the markets and KingSequenceSgn is just for the convienent for watching. And plus with Forex Trading mentor subsccription I will assist you to win the market at first later if it's great will be upgraded to King Forex trading mentor.
Slide 1: Title Slide Title: Unveiling Market Rhythms with Advanced Price Momentum Analysis Subtitle: A Revolutionary Trading Ind
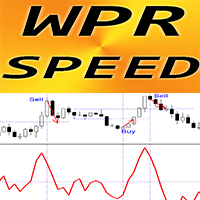
MT4用外国為替インジケーター「WPR SPEED」 - 優れた予測ツール!
この指標の計算は物理学の方程式に基づいています。 WPR SPEED は WPR オシレーター自体の 1 次微分です WPR SPEED は、横ばい市場や横ばい市場でのエントリーのスキャルピングに適しています WPR SPEED インジケーターは、WPR 自体が方向を変える速度を示します - 非常に敏感です モメンタムスキャルピング取引戦略には WPR SPEED インジケーターを使用することをお勧めします。インジケーターの大きなサイズのピークを見つけます - (写真のように) 反対方向にスキャルピング取引を開きます インジケーターにはモバイルおよび PC アラートが組み込まれています
// さらに優れたエキスパートアドバイザーとインジケーターはここから入手できます: https://www.mql5.com/en/users/def1380/seller // また、収益性が高く、安定していて信頼性の高いシグナル https://www.mql5.com/en/signals/1887493 に参
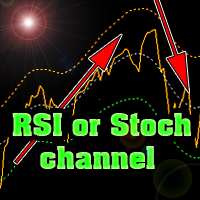
The indicator plots Stochastic or RSI levels in the price channel of a trading instrument.
Download the indicator for FREE right now and test it in the strategy tester.
It is easy to determine the trend direction and overbought or oversold levels.
The settings are standard for any of these indicators.
It is possible to change settings for each trading instrument separately.
You can use currencies, stock markets, futures or cryptocurrencies.
The indicator can be used as an independen
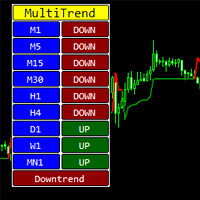
The indicator shows the direction of the trend on different timeframes.
Timeframes can be disabled in the settings.
The bottom line of the indicator reports the prevailing trend - up or down.
The indicator can be used on any trading instruments - currencies, stocks, futures, indices, metals, cryptocurrencies.
This indicator can be used as an independent trading system or as an addition to another system.
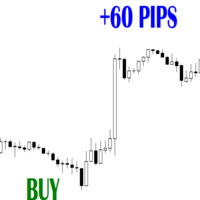
組み合わせる他のボリュームツール: https://www.mql5.com/en/market/product/72744 大量の極端な状況の特定: このインジケーターを、トレーダーが激しい買い圧力または売り圧力の時期を正確に特定するための強力なツールとして位置づけます。 出来高を利用するインジケーターのプライマリバッファーが、トレーダーが市場活動の高まりを示す出来高のスパイクを特定するのにどのように役立つかを強調します。 これらの大量の極端な値は、多くの場合、強い価格変動と一致するため、潜在的なトレンドの反転または継続を示す重要性を強調します。
極端な取引高の特定: 市場の優柔不断や参加の欠如を示す可能性のある、取引高が低い期間を検出するインジケーターの機能を示します。 現在のトレンドにおける潜在的な枯渇を示す、弱い買い圧力または売り圧力のインスタンスを出来高ベースのバッファーがどのように特定できるかを強調します。 この機能は、流動性が低い期間の取引を避けようとするトレーダーや市場の反転の可能性を予測するトレーダーにとって価値のあるものとして位置づけてください。
視覚的

Use GANN 369 to use a combination of 30's,60's,90's time to cross 3's,6's,9's. Any larger combination of these cross smaller combinations of these
Using GANN 369 Method for Trading Reversals The GANN 369 method, inspired by the works of W.D. Gann and Nikola Tesla's 3, 6, 9 numerical patterns, can be employed to identify potential reversals in financial markets. By combining specific periods (30, 60, and 90) with the numbers 3, 6, and 9, traders can seek opportunities for trend changes.
>>> BIG SALE PROMOTION: 50% OFF + GIFT EA! - Promo price: $64 / Regular price $129 <<< - The promotion will end soon!
The Forex Trend Tracker is an advanced tool designed to enhance the trading capabilities of forex traders. This sophisticated indicator uses complex mathematical formulas alongside the Average True Range (ATR) to detect the beginnings of new upward and downward trends in the forex market. It offers visual cues and real-time alerts to give traders a competitive advantage in th

Overview
In the evolving landscape of trading and investment, the demand for sophisticated and reliable tools is ever-growing. The AI Trend Navigator is an indicator designed to meet this demand, providing valuable insights into market trends and potential future price movements. The AI Trend Navigator indicator is designed to predict market trends using the k-Nearest Neighbors (KNN) classifier.
By intelligently analyzing recent price actions and emphasizing similar values, it help
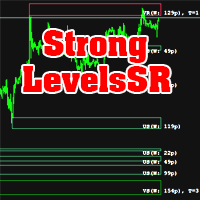
The indicator calculates support and resistance levels. There is a hint in the upper left corner. This hint can be removed. Hint in two languages (English and Russian). The width of support and resistance levels is shown. The number of levels touched is displayed. Works on all timeframes. Can be used as an independent trading system, and as an addition to another system. Download the demo version of the indicator right now and try it in the strategy tester!
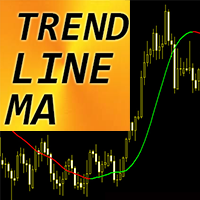
MT4用FXインジケーター「トレンドライン移動平均線」
トレンド ライン MA - 次世代の移動平均です。 先進的な新計算方式を採用。 インジケーターは遅延なくトレンドを示します。 標準的な SMA、EMA、LWMA インジケーターよりもはるかに高速かつ明確です。 このインジケーターを使用すると、標準的な戦略さえもアップグレードする機会がたくさんあります。 緑色は強気トレンドを意味します。 赤色 - 弱気トレンド。
// さらに優れたエキスパートアドバイザーとインジケーターはここから入手できます: https://www.mql5.com/en/users/def1380/seller // また、収益性が高く、安定していて信頼性の高いシグナル https://www.mql5.com/en/signals/1887493 に参加することも歓迎します。 当MQL5サイトのみで提供しているオリジナル商品です。

The presented indicator clearly and very accurately displays the current trend, its beginning and end. The indicator is also used to identify support/resistance levels. The operating principle of the indicator is based on another popular and time-tested indicator - Bollinger Bands. The indicator allows you to send notifications to a mobile terminal and email. Customizable parameters: Bollinger Bands Period; Bollinger Bands Deviation; Offset Factor; Alerts - displays a dialog box containing inf
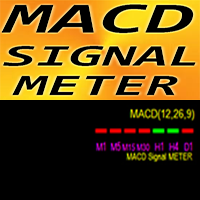
MT4用外国為替インジケータMACDシグナルメーター
非常に便利なMACDシグナルメーターインジケーターは、7つのタイムフレームの現在のMACD値(シグナルの上/下)を同時に表示します。 緑色のボックス - MACD がシグナルを上回っている 赤いボックス - MACD がシグナルを下回っています 外国為替インジケーターMACDシグナルメーターは、マルチタイムフレーム取引のトレードエントリーフィルターとして使用できます
// さらに優れたエキスパートアドバイザーとインジケーターはここから入手できます: https://www.mql5.com/en/users/def1380/seller // また、収益性が高く、安定していて信頼性の高いシグナル https://www.mql5.com/en/signals/1887493 に参加することも歓迎します。 当MQL5サイトのみで提供しているオリジナル商品です。
Confident trading with levels of support and resistance! We present to you the indicator " Levels of support and resistance ", which will become your indispensable assistant in the world of trading.
The indicator automatically identifies key levels of support and resistance , on the basis of which you can:
Make Exact Deals : Entering the market at levels of support and resistance greatly increases the chances of successful trading. Identify trend movements : A breakthrough or rebound from

We present you the indicator "Candle closing counter", which will become your indispensable assistant in the world of trading.
That’s why knowing when the candle will close can help:
If you like to trade using candle patterns, you will know when the candle will be closed. This indicator will allow you to check if a known pattern has formed and if there is a possibility of trading. The indicator will help you to prepare for market opening and market closure. You can set a timer to create a p

The Zigzag Indicator is a powerful tool, developed to assist traders in identifying market trends by highlighting significant highs and lows of a trade. It is designed with the flexibility to adjust to fluctuating market conditions and to filter the minor price fluctuations in the market to focus on substantial ones.
The Zigzag Indicator adheres only to movements that meet a specific percentage or a defined number of points, allowing it to weed out minor price movements and focus solely on
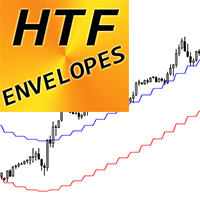
MT4用FXインジケーター「HTFエンベロープ」
MT4 用のプロフェッショナルな HTF エンベロープを使用して取引方法をアップグレードします。 HTF とは、より高い時間枠を意味します。 エンベロープは市場で最高のトレンド指標の 1 つであり、取引に最適なツールです これは、トレーダーが極端な買われ過ぎと売られ過ぎの状態や取引範囲を特定するのに役立ちます。 HTF エンベロープインジケーターは、プライスアクションエントリーや他のインジケーターと組み合わせたマルチタイムフレーム取引システムに最適です。 インジケーターを使用すると、より高い時間枠からのエンベロープを現在のチャートに添付できます。
// さらに優れたエキスパートアドバイザーとインジケーターはここから入手できます: https://www.mql5.com/en/users/def1380/seller // また、収益性が高く、安定していて信頼性の高いシグナル https://www.mql5.com/en/signals/1887493 に参加することも歓迎します。 当MQL5サイトのみでご提供しているオリジ
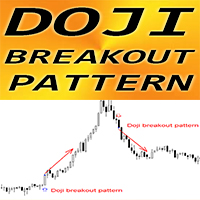
MT4用外国為替インジケーター「Doji Breakoutパターン」
インジケーター「Doji Breakout pattern」は純粋なプライスアクション取引です。再描画や遅延はありません。 インジケーターは、Doji ローソク足がパターンの中央にあり、最後のローソク足がブレイクアウトとなる、Doji パターンのトレンド方向へのブレイクアウトを検出します。 強気の Doji ブレイクアウト パターン - チャート上の青い矢印シグナル (写真を参照) 弱気な Doji ブレイクアウト パターン - チャート上の赤い矢印シグナル (写真を参照) PC、モバイル、電子メールのアラートが含まれています インジケーター「Doji Breakout pattern」はサポート/レジスタンスレベルと組み合わせるのに適しています: https://www.mql5.com/en/market/product/100903
// さらに優れたエキスパートアドバイザーとインジケーターはここから入手できます: https://www.mql5.com/en/users/def1380/selle

Contact me for instruction, any questions! Introduction Chart patterns are an essential tool traders and investors use to analyze the future price movements of securities. One such pattern is the triple bottom or the triple top pattern, which can provide valuable insights into potential price reversals. This pattern forms when a security reaches a low price level three times before reversing upward or reaches a high price level three times before reversing downward.
Triple Top Bottom
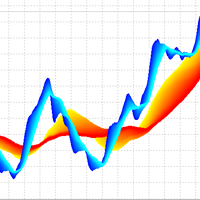
3D Trend Indicator is a non-repaint indicator using multiple moving averages with a 3D surface view. By using this indicator, you can remove uncertainties that can happen using a single and fixed moving average period. You can use a cloud area using a range of moving average periods. Also a wide range of visual settings are added to this indicator to have a better view from the cloud area. Alert and notification system added to the indicator to inform the trader about the action of candles on t
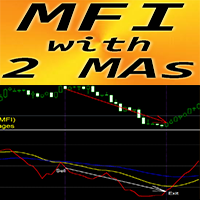
MT4用外国為替インジケーター「MFIと2つの移動平均」
マネー フロー インデックス (MFI) は、売られすぎゾーンと買われすぎゾーンを識別するために価格と出来高のデータを使用するテクニカル オシレーターです。 「MFI と 2 つの移動平均」インジケーターを使用すると、MFI オシレーターの高速移動平均と低速移動平均を確認できます。 インジケーターはトレンドの変化を非常に早い段階で確認する機会を与えます このインジケーターはパラメーターを介して設定するのが非常に簡単で、任意の時間枠で使用できます。 写真で売買エントリー条件を確認できます。 買い(売り)シグナル条件: (1) - 高速 MA が遅い 1 つを上向き (下向き) に横切る、(2) - 赤い MFI ラインが速い MA の上 (下) にある、(3) - 赤いラインが黄色のラインに接近している、 (4)-赤いラインは黄色のラインから上向き(下向き)にリバウンドします、(5)-買い(売り)フックが形成されたばかりです - ここでオープントレード、(6)-重要:MAがクロスした後の最初のフックのみを使用してください
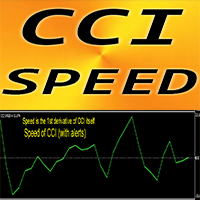
MT4用外国為替インジケーター「CCI Speed」
この指標の計算は物理学の方程式に基づいています。 CCI Speed は CCI 自体の 1 次派生製品です コモディティ チャネル インデックス (CCI) は、現在の価格と過去の平均価格の差を測定します。 CCI スピードは、メイントレンドの方向にエントリーをスキャルピングするのに適しています。適切なトレンド指標と組み合わせて使用します。 CCI 速度インジケーターは、CCI 自体が方向を変える速度を示します - 非常に敏感です CCI 速度インジケーターの値が 0 未満の場合: 速度は負です。 CCI 速度インジケーターの値が > 0 の場合: 速度は正です インジケーターにはモバイルおよび PC アラートが組み込まれています
// さらに優れたエキスパートアドバイザーとインジケーターはここから入手できます: https://www.mql5.com/en/users/def1380/seller // また、収益性が高く、安定していて信頼性の高いシグナル https://www.mql5.com/en/signal

Binarias & Forex (+90% Ratio-Win Next Candle) Espere que el precio llegue a una buena zona (fuerte) sea soporte, resistencia, zona de oferta o demanda, fibonacci level key, cifra redonda. Haciendo lo anterior definitivamente habrá una reversión en el precio y obtendrá su ITM en primera vela dando una efectividad del 100% siguiendo la tendencia. Es muy importante estar atento a las noticias fundamentales en el mercado y estas no afecten tu trading. Sesiones comerciales: cualquiera (24 horas).
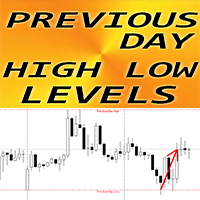
MT4用FXインジケーター「前日高値安値レベル」
「前日高値安値レベル」という指標はとても便利な補助指標です 昨日の高値と安値は価格がそこから反発することが非常に多いため、非常に重要です。 これらのレベルは信頼できるサポートとレジスタンスと見なすことができます - 価格はそれらを非常に尊重します リバーサル取引手法やスキャルピングを使用する日中トレーダーにとって便利な指標です。 プライスアクションとの組み合わせも非常に良い
// さらに優れたエキスパートアドバイザーとインジケーターはここから入手できます: https://www.mql5.com/en/users/def1380/seller // また、収益性が高く、安定していて信頼性の高いシグナル https://www.mql5.com/en/signals/1887493 に参加することも歓迎します。 当MQL5サイトのみでご提供しているオリジナル商品です。
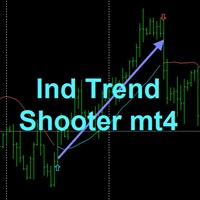
TREND SHOOTER With alerts
It is a trend indicator based on moving averages that very efficiently calculates changes in market direction.
This has the ability to anticipate changes of direction very early.
FEATURES
This indicator particularly draws two moving averages that are used only to show color changes. they can wear these moving stockings as they wish as they do not affect the color change behavior bullish blue color bearish red color where the line is interrupted it is not reco

MT4用FXインジケーター「ATRトレーリングストップ」
MT4 用の優れた補助 ATR トレーリング ストップ インジケーターを使用して、取引方法をアップグレードします。 このインジケーターはトレーリングストップの目的に最適です ATRトレーリングストップは市場のボラティリティに自動的に適応します 遅延がなく、セットアップも簡単 このインジケーターは、メイントレンドの方向への価格アクションエントリーと組み合わせるのに最適です。
// さらに優れたエキスパートアドバイザーとインジケーターはここから入手できます: https://www.mql5.com/en/users/def1380/seller // また、収益性が高く、安定していて信頼性の高いシグナル https://www.mql5.com/en/signals/1887493 に参加することも歓迎します。 当MQL5サイトのみで提供しているオリジナル商品です。
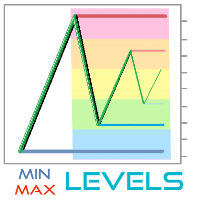
MinMax Levels MinMax Levels – は、重要な取引期間 (日、週、月) の最高値、最低値、始値レベルを示す指標です。
各外国為替市場参加者は、取引システムのレベルを使用します。 それらは、トランザクションを行うための主なシグナルであることも、分析ツールとして機能する追加のシグナルであることもできます。 この指標では、大規模な市場参加者の主要な取引期間であるため、日、週、月が重要な期間として選択されました。 ご存知のとおり、価格はレベルからレベルへと移動するため、重要なレベルに対する価格の位置を把握しておくと、取引の意思決定を行う際に有利になります。 また、便宜上、両方のレベル自体を有効または無効にするためのボタンが追加されており、ボタンを折りたたんで価格チャートの作業ウィンドウのスペースを空けることができます。
各外国為替市場参加者は、取引システムのレベルを使用します。 それらは、トランザクションを行うための主なシグナルであることも、分析ツールとして機能する追加のシグナルであることもできます。 この指標では、大規模な市場参加者の主要な取引期
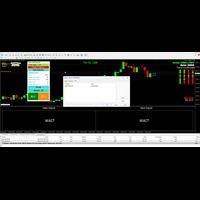
The Indicator Has signal with wait , Ready To Buy and Ready To Sell to make you ready to execute when signal coming , it very easy to use and very profitable , good for forex , Binary or crypto and GOLD , you just wait and execute , no need to analysis , because it already analysis by indicator , for exsample Wait than ready to buy or ready to sell than buy or sell you just entry as per instruction of indicator , very easy and usefull
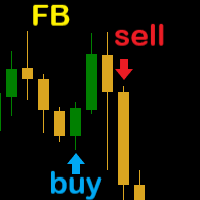

Volume Clarity Pro The Volume Clarity Pro provides clarity in the movement of price for any financial instrument, including currency pairs, cryptocurrencies, equities, commodities and indices. The Volume Clarity Pro maps out where price is consolidating, retracing, resisting or settled in areas of support. The Volume Clarity Pro accurately displays the month's price action, offering crucial data about your selected trading pair for chart analysis and trade initiation. The Volume Clarity Pro is

Chart Clarity Dashboard The Chart Clarity Dashboard provides clear insights into price movements for various financial instruments like currency pairs, cryptocurrencies, equities, commodities, and indices. This dashboard displays detailed price information in real-time, making it easier for traders to make decisions quickly. It shows price movements down to the second, giving you essential data before you trade or analyze charts. Chart Clarity Dashboard allows you to monitor price changes acros

Interceptor - an arrow indicator shows potential market entry points in the form of arrows of the corresponding color: up arrows (blue) suggest opening a buy, down arrows (red) suggest selling. The appearance of arrows may be accompanied by sound signals if the sound option is enabled. It is assumed to enter on the next bar after the indicator, but there may be non-standard recommendations for each strategy. Interceptor visually “unloads” the price chart and saves analysis time: no signal - no d

It's a variation of mid of HH and LL since it compares the higher of HH or LL against a period and twice the number of bars back to avoid whipsaws.
I used to display this against lines on a chart, but made a histogram out of it and it looks interesting.
It looks good at gauging trend strength and general turns (see image below).
The name of the indicator is BAM, which is an acronym for "Below and Above Mid".
Ways to use it:
1. To see general trend on longer TFs (more than 60 ba

It's a variation of mid of HH and LL since it compares the higher of HH or LL against a period and twice the number of bars back to avoid whipsaws.
I used to display this against lines on a chart, but made a histogram out of it and it looks interesting.
It looks good at gauging trend strength and general turns (see image below).
The name of the indicator is BAM, which is an acronym for "Below and Above Mid".
Ways to use it:
1. To see general trend on longer TFs (more than 30 ba
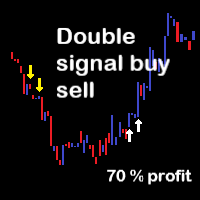

GAP DETECTOR
FVG in trading refers to "Fair Value Gap", . It is a concept used in technical analysis to identify areas on a price chart where there is a discrepancy or gap between supply and demand. These gaps can occur due to rapid movements in price, usually as a result of important news or economic events, and are usually filled later as the market stabilizes.
The GAP DETECTOR indicator is designed to identify fair value gaps (FVG) on the price chart and filter them using volatility to d
MetaTraderプラットフォームのためのアプリのストアであるMetaTraderアプリストアで自動売買ロボットを購入する方法をご覧ください。
MQL5.community支払いシステムでは、PayPalや銀行カードおよび人気の支払いシステムを通してトランザクションをすることができます。ご満足いただけるように購入前に自動売買ロボットをテストすることを強くお勧めします。
取引の機会を逃しています。
- 無料取引アプリ
- 8千を超えるシグナルをコピー
- 金融ニュースで金融マーケットを探索
新規登録
ログイン