YouTubeにあるマーケットチュートリアルビデオをご覧ください
ロボットや指標を購入する
仮想ホスティングで
EAを実行
EAを実行
ロボットや指標を購入前にテストする
マーケットで収入を得る
販売のためにプロダクトをプレゼンテーションする方法
MetaTrader 4のための有料のテクニカル指標 - 102

Point Trend Indicator - An indicator of the upper and lower level of the trend, which can determine the trend direction and indicate its strengthening. The trend direction is determined by round dots; if the points are above the zero line, the trend is bullish; if below, the trend is bearish. The increase in directional movement is indicated by arrows. It has the only parameter for manual adjustment - Duration of the trend direction.
Possibilities
Works on all time frames Adapts to any fin

Are you looking for a reliable tool to help you identify trends in the Forex market? Look no further! Introducing "Trend Spotting," your ultimate trend identification solution for MetaTrader 4 (MT4).
How to determine the trend: Down Trend: As soon as the Yellow signal line is below zero, the Green Slow Trend line is below zero and the main trend osliator falls below zero, it means that the downtrend has started. Up Trend: When the Yellow signal line is above zero, the Green Slow Trend line is

Bollinger Squeeze Trend Indicator is a technical analysis tool used in the investment and trading world. This indicator helps identify market trends by analyzing the price movements of assets.
The Bollinger Squeeze Trend Indicator uses a variation of Bollinger Bands and focuses specifically on the relationships between volatility and price movements. Essentially, the Bollinger Squeeze Trend indicator is designed to recognize periods of narrowing and widening of bands. This can help identify p

xBrat Range Breakout For The MT4 Platform. Designed to help define opening ranges of major markets, along with Gold Pit opens, Oil Pit opens and for major economic data points. We recommend timeframes for opening ranges on different type of instruments further down this description.
The xBrat Range Breakout combines the xBrat indicator with the range breakouts. It identifies price movements, market momentum, and trends. MT4 xBrat Range Breakout isn’t only about finding breakout chances. It hel

A universal pulse indicator for finding an entry point for a trend breakdown, followed by transaction tracking at Fibonacci levels without redrawing. The indicator itself is an independent trading system designed for intraday trading on the M5 time frame, but it also performs well on large timings. Trading on the indicator occurs exclusively with pending orders, which allows you to solve one of the biggest problems of any trader, these are trend - flat definitions. The essence is to filter out

The Market Structures Pro indicator finds and displays 5 (five) patterns of the Smart Money Concepts (SMC) system on the chart, namely:
Break Of Structures (BoS) Change of character (CHoCH) Equal Highs & Lows Premium, Equilibrium and Discount zones with Fibo grid High-high, Low-low, High-low and Low-high extremes
Patterns are displayed for two modes - Swing and Internal and are easily distinguished by color on the chart. Internal mode features higher contrast colors, finer lines, and sm

custom Power Trading Indicator or in short called Customm.
This indicator combines multiple build in custom indicators for super accurate prediction of price movements on all trading pairs like EUR/USD , USD/JPY , GOLD , OIL , SILVER . This indicator can be converted to and expert adviser also , this indicator is very good for scalping or a long time positions . This indicator doent not repaint or re draw .
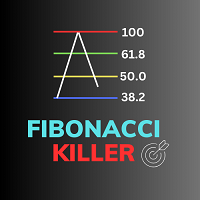
Fibonacci Killer - Your Ultimate Trading Assistant Are you ready to take your trading to the next level? Introducing Fibonacci Killer, the ultimate trading indicator designed to help you spot critical trading opportunities like never before. Key Features : Fibonacci Magic : Fibonacci Killer harnesses the power of Fibonacci retracement levels to provide you with precise entry signals. It monitors the market and generates signals as soon as a new candle begins, giving you a head start in your trad

The ENG TREND is a powerful tool designed for traders in the forex and financial markets who seek a unique approach to identifying support and resistance levels. This indicator leverages the principles of numerology, a discipline that explores the mystical and symbolic meanings of numbers, to create a trend analysis method that goes beyond traditional technical analysis. Key Features: Numerology-Based Analysis: The ENG TREND applies numerology principles to price data, allowing traders to uncove

Next level of trend trading here. Possibility 75%, the indicator analyzes the current market to determine short (small dot), middle (circle with a dot inside) and long (cross with a circle and a dot inside) trends. Wingdings characters of Aqua color represents the beginning of the UP trend. Wingdings characters of Orange color represents the beginning of the DOWN trend. Possibility 75% Indicator will improve your trading in the world of forex, commodities, cryptocurrencies and indices.

Добрый день. Всем привет. Здравствуйте. Я. трейдер 20 лет опыта торгов. Вадим Сергеевич Лепехо. Предлагаю Вам на смотрины индикатор. Индикатор прост. Работает по мувингам. Работать на нем лучше всего с 09:00- 18:00 мск. времени. На "таймфреме": m5; m15. Слегка замысловатая схема чтения сигнала в виде стрелок. Если индикатор рисует стрелку на графике вверх, ХОД ДЕЛАЕМ ВНИЗ от Low - откладываем 10 пипсов, ход делаем - отложенным ордером(pending), SELL STOP Если индикатор рисует стрелку на графике
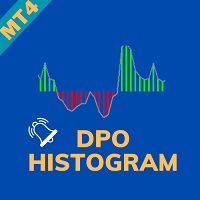
Indicator DPO Histogram Alert - The Ultimate Trading Companion Unveil the potential of the "DPO Histogram Alert Indicator," your steadfast ally in the realm of trading. This robust tool is meticulously crafted to ensure you're always in the know by providing prompt alerts based on the Detrended Price Oscillator (DPO) Histogram. Basic Details : Indicator Type : DPO Histogram Alert Alert Features : Real-time alerts for significant DPO Histogram movements. Customization : Fully adjustable settings

Всем привет. Данный индикатор прост, как божий день. Кстати, я , Вадим Сергеевич Лепехо, трейдер(частный) опыт 20 лет. Предлагаю приобрести мой индикатор. Построен он на базе индикатора arrrows_template. Индикатор рисует стрелки на графике при пересечении скользящих. Все просто. Видим стрелку вниз - ходим вниз отложенным ордером(pending) SELL STOP, откладываем от Low 10pips(пипсов). Фиксируем профит в целях 5, 10,15 пунктов. Видим стрелку вверх - ходим вверх отложенным ордером(pending) BUY STOP

The UT Bot Alert MT5 Indicator is an advanced technical analysis tool designed to help traders optimize their trading performance. This indicator is MT5 conversion of the UT Bot alerts indicator by “QuantNomad “ in Trading View website and some alert methods are added to provide real-time alerts when a trading signal is generated, in order to allow traders to act quickly and efficiently. Key Features: Alert Types: in addition to the terminal pop-up alerts, the mobile notification sends the alert

Добрый всем ДЕНЬ, вечер, утро. Я, трейдер(частный), Вадим Сергеевич Лепехо, 20 лет опыта. Предлагаю Вам очередной продукт. Построен на базе индикатора arrows_template.Индикатор не затейливый. Вообщем прост в понимании. Видите квадраты синего цвета: High & Low. Ждите куда цена пробьет, после пробития дожидаемся появления зоны: боковик, флэта, консолидации, замедления, накопления. Выставляем отложенный ордер от High или Low смотря куда был пробой: вверх или вниз. Цена приблизительно почти доходи
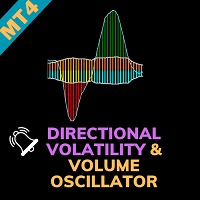
Directional Volatility & Volume Oscillator - Unleash Your Trading Potential Welcome to a new era of trading excellence with the "Directional Volatility & Volume Oscillator." This innovative indicator is engineered to provide you with essential insights into market volatility and volume, empowering you to make well-informed trading decisions. Basic Details : Indicator Type : Directional Volatility & Volume Oscillator Key Metrics : Real-time volatility and volume insights for precise trading analy

Step into the future of automated trading with the Beast Indicator V7, The indicator allows you to trade binary options. T his indicator give high winning ratio with over 20 years of backtesting an unparalleled tool that seamlessly transforms your trading journey into an effortless and lucrative venture. Designed to simplify and optimize the trading process, the Beast Indicator is the ultimate game-changer, offering a hassle-free experience that allows you to set your buy and sell options effo
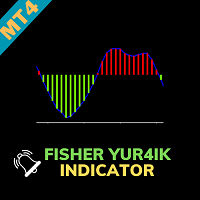
Fisher Yur4ik Indicator - Unlock Precise Trading Insights Explore a world of precision in trading with the "Fisher Yur4ik Indicator." This advanced tool is designed to provide traders with accurate insights into price trends, allowing for well-informed decisions and enhanced profitability. Basic Details : Indicator Type : Fisher Yur4ik Indicator Key Metrics : Real-time analysis of price trends and potential turning points. Customization : Fully customizable settings to align with your unique tra

GG TrendBar Indicator - Your Multitimeframe ADX Trading Solution Experience the power of multi-timeframe trading with the "GG TrendBar Indicator." This versatile tool, built upon the ADX indicator, offers precise insights by considering multiple timeframes, ensuring you make well-informed trading decisions. Basic Details : Indicator Type : GG TrendBar Indicator (Multi-Timeframe ADX) Key Metrics : Real-time ADX analysis across multiple timeframes. Customization : Enable or disable specific timefr

以下は、「 トップブレイクアウトインジケーターMT4 」という名前のオールインワンインジケーターの紹介です。
このインジケーターは、トレーディングおよびプログラミングの豊富な経験を持つチームによって開発されました。
MQL5チャンネル: https://www.mql5.com/en/channels/diamondscalping テレグラムチャンネル: https://t.me/autoprofitevery MT5: https://www.mql5.com/en/market/product/107047?source=Site+Market+Product+Page
この1つのインジケーターだけで、取引と口座管理の両方が簡単に行えます。このインジケーターには、次の2つの主な機能が含まれています。
1/ シグナル機能 このインジケーターは、EURJPY通貨ペア(推奨)のブレイクアウト戦略に基づいて毎日シグナルを生成します。4時間ごとにボックスが作成されます。ブレイクアウトが発生した場合、シグナルアラートが提供されます。
インジケーターは5つの利益確定ポ
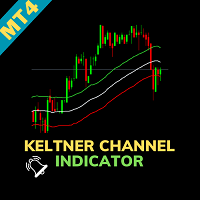
Keltner Channel Indicator - Uncover Market Trends with Precision Welcome to the world of precision trading with the "Keltner Channel Indicator" for MetaTrader 4. This powerful tool, inspired by Chester Keltner's work, helps you analyze price movements and identify potential trends with remarkable accuracy. Basic Details : Indicator Type : Keltner Channel Indicator Key Metrics : Real-time price volatility analysis. Customization : Fully customizable settings to align with your unique trading stra

Introducing the Accumulated RSI, your ultimate tool for precise trend identification and momentum analysis in the world of Forex and financial markets. This cutting-edge MetaTrader 4 (MT4) indicator, designed for traders seeking unparalleled insight and accuracy, empowers you to make well-informed trading decisions like never before. Features Accurate Trend Detection: The Accumulated RSI utilizes the Relative Strength Index (RSI) in an innovative way to pinpoint the prevailing market trends wit

The " Rsi Monitor Screen " is a powerful and versatile MetaTrader 4 (MT4) indicator designed to provide a comprehensive overview of the Relative Strength Index (RSI) across multiple timeframes on a single screen. This tool is essential for traders seeking a holistic view of RSI data, enabling informed decision-making and precise analysis. Key Features: Multi-Timeframe RSI Display: This indicator displays RSI values for various timeframes, from M1 (1 minute) to MN1 (monthly), all on a single, use

レベルResSup MT4取引指標は、価格チャート上のサポートラインと抵抗ライン、および予想される追加のチャネルラインを独立して構築します。
指標に関する情報 インジケーターには、サポートレベル(青で示されています)と抵抗レベル(赤で示されています)があります。 インジケーターには、より多くの形成サポートレベルもあります(このようなレベルは、前述の色のストロークで提供されます)。
内部サポートレベル(緑色でマークされている)と抵抗レベル(ピンクでマークされている)もあります。 それらが干渉する場合は、必要に応じてオフにすることができます。
オレンジ色の垂直StartTL線は履歴に沿って移動することができ、線は自動的に再描画されます(再描画されていない場合はグラフを更新します)。
右上隅には、Levels ResSup MT4取引インジケータがサポートラインと抵抗ラインの数を表示します。
この指標は、すべての通貨ペア、暗号通貨、株式で機能します。 すべての時間枠で。
インジケーターの設定 FirstBar=1;//最初のライン構築バー(垂直線座標
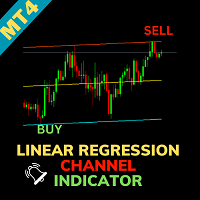
Linear Regression Channel Indicator - Visualize Trends with Precision Enter the world of precision trading with the "Linear Regression Channel Indicator" for MetaTrader 4. This versatile tool, based on linear regression analysis, provides you with a clear visual representation of market trends, enabling you to make well-informed trading decisions. Basic Details : Indicator Type : Linear Regression Channel Indicator Key Metrics : Real-time price trend analysis through linear regression. Customiza
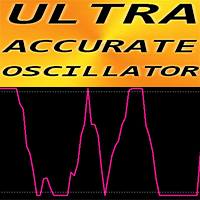
MT4用の超正確なオシレーター
UA オシレーター - たとえば EMA などのトレンド インジケーターと組み合わせて使用すると、約 80% の精度を持つ高度なカスタム インジケーターです。
先進的な新計算方式を採用。 UA オシレーターは、標準の MT4 オシレーターよりもはるかに高速で正確です。 新世代のオシレーター - EMA10 と組み合わせた使用例を写真で確認してください。 売られすぎの値: 0.03 未満 // 買われすぎの値: 0.97 以上 このインジケーターを使用すると、標準的な戦略さえもアップグレードする機会がたくさんあります。 インジケーターの設定はとても簡単です。 メインパラメータ: 感度 - 推奨値: 0.5-0.8
// さらに優れたエキスパートアドバイザーとインジケーターはここから入手できます: https://www.mql5.com/en/users/def1380/seller // また、収益性が高く、安定していて信頼できるシグナル https://www.mql5.com/en/signals/1887493 に参加することも歓迎し
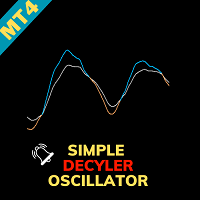
Welcome to the Simple Decycler Oscillator, a powerful indicator designed to enhance your trading experience. This user guide provides comprehensive insights into using the indicator effectively, ensuring you make informed trading decisions. Overview The Simple Decycler Oscillator is a versatile tool that combines two Decyclers, utilizing periods of 100 (fast - green) and 125 (slow - blue). This dual approach, akin to moving averages, facilitates trend identification through a straightforward cr
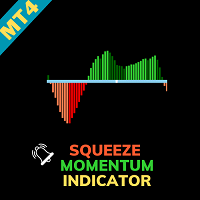
Squeeze Momentum Indicator - Unleash the Power of Market Momentum Welcome to the world of precision trading with the "Squeeze Momentum Indicator" for MetaTrader 4. This advanced tool is designed to help you harness the power of market momentum, providing you with actionable insights to make well-informed trading decisions. Basic Details : Indicator Type : Squeeze Momentum Indicator Key Metrics : Real-time analysis of market momentum. Customization : Fully customizable settings to align with your

Всем Добрый День. Вас беспокоит всех снова, я Вадим Сергеевич Лепехо. Предлагаю свой продукт на обозрение, просмотр, оценку его. Продукт(индикатор) прост в понимании сигнала(алерта), алготрейдинга. Индикатор рисует над свечами кружки, точки красного и зеленого цвета. Нужно дождаться появления череды точек одного цвета(цвет череды красный), а потом должен появиться зеленого цвета кружок, точка и обязательно сформироваться потом точка другого цвета, т.е. красного. Выставляем сетку ордеров вверх и

Всем добрый. Это снова, я, Вадим Сергеевич Лепехо. Предлагаю приобрести и протестировать кота в мешке, мяууууууу )))). Очень просится вы заметили. Данный индикатор рисует знаки на графике. Цена пробивает их и в принципе ожидаем возврата цены обратно. Индикатор работает, отталкивается от дивергенции на рынке форекс. Хотя, если вы опытные трейдер, юзеры. Рынка(форекс), как такого и нет. Это не суть Главное получать профит постоянно. Спасибо за внимание До свидания.

Description: Unlock the power of numerology in your trading with our unique Numerology Indicator. This indicator is meticulously designed to provide traders with insights based on numerology principles and 0.7 values, offering a fresh perspective on market analysis. How It Works: Our Numerology Indicator leverages the ancient wisdom of numerology, which assigns numerical significance to various aspects of life. In the context of trading, we've harnessed the mystical power of 0.7 values, aligning

Attractive Numero - Numerology Levels Indicator Description: Discover the fascinating world of numerology in trading with our "Attractive Numero" indicator. This innovative tool allows you to seamlessly integrate numerology principles into your technical analysis, helping you identify critical supply and demand levels that can significantly enhance your trading strategy. How It Works: "Attractive Numero" is designed to harness the power of numerology to pinpoint supply and demand levels. You hav

Cycle Engineering Indicator - Automatic Level Drawing Description: Step into the realm of advanced technical analysis with our "Cycle Engineering Indicator." This cutting-edge tool seamlessly combines the power of cycle engineering theory and numerical principles to automatically generate key trading levels, offering a deeper understanding of market cycles and dynamics. How It Works: The "Cycle Engineering Indicator" is based on a sophisticated theory of market cycles, which takes into account n

Daily Reverse - Day Number-Based Reversal Predictor Description: Experience a revolutionary approach to price reversal prediction with our "Daily Reverse" indicator. This innovative tool leverages day numbers to forecast potential market reversals by drawing vertical lines on the hourly timeframe, giving you valuable insights into intraday trading opportunities. How It Works: "Daily Reverse" harnesses the power of day numbers to predict price reversals. By calculating day-specific patterns, this
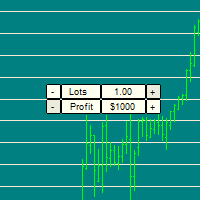
Easily manage your risk and position sizing! It can be tricky to size your trade in the moment, due to different currency / commodity values. For example, placing a 1 Lot position on XAUUSD can easily blow an account that could handle 1 lot on GBPUSD. See screenshots to see how Gold can move $500 on 1 lot much faster than GBPUSD.
THe indicator draws horizontal lines that allow you to easily compare the potential risk/reward across timeframes and symbols. ---- Inputs are: Risk Size: The Loss/Pr

The GGP Squeeze Momentum MT4 Indicator is a volatility and momentum tool designed to help traders optimize their trading performance and providing traders with actionable insights to make well-informed trading decisions. This indicator is MT4 conversion of the Squeeze Momentum Indicator by “LazyBear “ in Trading View website and some alert methods are added to provide real-time alerts when a trading signal is generated, in order to allow traders to act quickly and efficiently. For MT5 version p
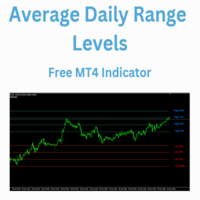
The Average Daily Range Levels indicator shows the ADR levels on the chart as if they were supports and resistances and is updated daily.
By default the indicator uses the 5-day average of the daily range. There are several strategies that suggest that these levels can be used to determine where the price can bounce and it is often said that the price can typically move 75% of the ADR.
In future versions I may add alerts at each level
Can you suggest any changes?
Greetings!

This script automatically calculates and updates ICT's daily IPDA look back time intervals and their respective discount / equilibrium / premium, so you don't have to :) IPDA stands for Interbank Price Delivery Algorithm. Said algorithm appears to be referencing the past 20, 40, and 60 days intervals as points of reference to define ranges and related PD arrays. Intraday traders can find most value in the 20 Day Look Back box, by observing imbalances and points of interest. Longer term traders c

Support and Resistance Barry Indicator - Your Path to Precision Trading Explore the world of precision trading with the "Support and Resistance Barry Indicator" for MetaTrader 4. This robust tool is designed to help you identify key support and resistance levels with exceptional accuracy, enhancing your ability to make well-informed trading decisions. Basic Details : Indicator Type : Support and Resistance Barry Indicator Key Metrics : Real-time identification of crucial support and resistance l
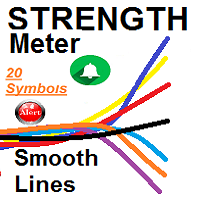
SMOOTH STRENGTH METER INDICATOR (SMOOTH LINE) it draws Currencies TREND Volatility Power / Strength lines : - Detects the 2 highly TRENDED Volatile pairs ( will be the Bold Lines ) - A very Helpful Indicator - It draws smooth lines for up to 20 currencies pairs representing Volatility strength and power - First it indicates the most powerful trended direction pairs : Strongest / Weaker - MAIN FUNCTION :it gives indication of the UP trend most Volatile Line and the

シグナルトレーディングインジケーター Sea Candles MT4は、CCIオシレーターを使用して価格の動きの方向を決定し、ポジションを開くための信号を生成します。 商品チャネル指数[CCI]-移動平均からの価格の偏差を測定します。 価格が新しい高値に達し、CCIが以前の高値を上回ることができないときに発散が表示されます。 この古典的な相違の後には、通常、価格修正が続きます。 CCIは通常±100の内で及びます。 ±100の上/下の値は、買われ過ぎ/売られ過ぎの状態と是正的な増加の確率について知らせます。
指標に関する情報 指標はローソク足の形で提示され、市場の状態に応じて4色で塗られます。
また、便宜上、インジケータに存在するすべての色はメインメニューで作成されます。
インジケータは、端末、電話、メールで通知を提供します。 色の変化に応じてトリガーされます。
指標の使い方 指標の色に応じて、私たちは売買します。 通知はすべてのケースに対して提供されます。
あなたは色と彼らがスクリーンショットで何を意味するのかを詳しく見ることができます。
また、す

The GGP Wave Trend Oscillator MT4 Indicator is a volatility and momentum tool designed to help traders optimize their trading performance and providing traders find the most accurate market reversals. This indicator is MT4 conversion of the Indicator: WaveTrend Oscillator [WT] by “ LazyBear “ in Trading View website and some alert methods are added to provide real-time alerts when a trading signal is generated, in order to allow traders to act quickly and efficiently. When the oscillator is ab

Advanced Scalper MT4Forex indicatorは、スキャルピング取引だけでなく、売られ過ぎや買われ過ぎのレベルに基づいた式です。 この指標は、すべての通貨ペアで機能します,
cryptocurrencies、株式、インデックス。 あなたのニーズに合わせてカスタマイズすることができ、それが任意の取引戦略に余分になることはありません普遍的な指標。
指標に関する情報 高度なダフ屋MT4外国為替指標は、目を傷つけず、知覚するのが楽しいカラーヒストグラムの形で提示されます。
市場の状況に応じて変化し、あなたは常に市場がどのような状況にあるかを理解することができるようになります。
Advanced Scalper MT4arrow forex indicatorは高度なパラメータを持っており、その信号を再描画しません。
トレンド指標と組み合わせて使用し、現在のトレンドの方向に排他的に取引を開くことをお勧めします。
指標を購入した後、私に連絡して、この指標で動作するように偉大なトレンド指標を取得してください!
指標の使い方 高度のダフ

Std Channels The Std Channels Indicator is a technical indicator that uses standard deviation to create five channels around a price chart. The channels are used to identify support and resistance levels, as well as trends and reversals. The indicator is calculated by first calculating the standard deviation of the price data over a specified period of time. The channels are then created by adding and subtracting the standard deviation from the price data. The five channels are as follows: Upper

The Forex Smart System is a user-friendly and intuitive trading solution designed to empower traders in the complex world of forex trading. With a focus on simplicity and practicality, this system offers a streamlined approach that makes it accessible to traders of all experience levels. User-Friendly Interface: The Forex Smart system is designed with simplicity in mind, making it accessible to traders of all experience levels. Its intuitive interface ensures that users can focus on trading rath
Support Resistance Tracking Indicator The Support Resistance Tracking Indicator is a technical analysis tool that helps traders identify and track support and resistance levels. It is a valuable tool for traders of all levels, from beginners to experienced professionals. How it works The Support Resistance Tracking Indicator uses a variety of methods to identify support and resistance levels. These methods include: Historical price action: The indicator looks for price levels where the market

Auto Channel Trend The Auto Channel Trend Indicator is a technical analysis tool that automatically draws trend channels on any chart. It uses a simple algorithm to identify the trend direction and then draws two parallel lines that represent the support and resistance levels of the channel. Features: Automatic trend channel drawing Support and resistance levels Trend direction identification Customizable parameters How to use: Add the indicator to your chart. Adjust the parameters to your likin
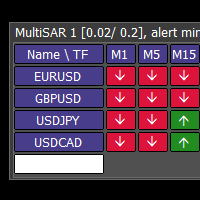
This tool monitors Parabolic SAR indicators on all time frames in the selected markets. Displays a table with signals to open a BUY trade (green) or SELL trade (red). You can easily add or delete market names / symbols. If the conditions for opening a trade on multiple time frames are met, you can be notified by e-mail or phone message (according to the settings in MT4 menu Tools - Options…) You can also set the conditions for sending notifications. The list of symbols/ markets you have entered
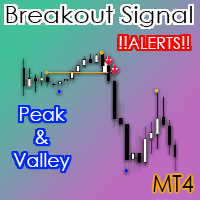
The valley and peak indicator strategy used in forex is a technical analysis approach that aims to identify potential trend reversals in the market. The strategy is based on identifying peaks and valleys in the price chart, which are points where the price reaches a high or low and then reverses direction. The valley and peak indicator is a tool that helps traders identify these patterns and generate buy and sell signals based on them. Here are the key steps involved in using the valley and pea
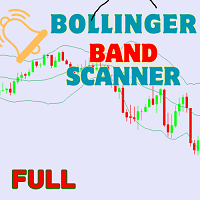
Welcome to the world of advanced trading with the Bollinger Bands Scanner! Maximize your trading potential with our powerful MT4 indicator designed for seamless analysis and real-time insights. Key Features: Effortless Bollinger Bands Scanning: Unlock the full potential of the Bollinger Bands Scanner by effortlessly scanning multiple assets. Receive instant alerts when specific Bollinger Bands conditions are met, ensuring you stay ahead of market movements. Comprehensive Dashboard Insights: Gai
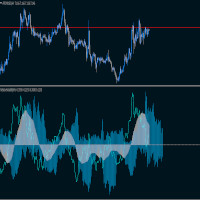
The indicator shows the deviation of the moving average relative to the volatility leading half of its period.
The red histogram shows the moving average relative to the anchor point.
The blue histogram shows volatility relative to the leading half
of the moving average.
The blue line simulates the price relative to the moving average.
The indicator is perfect for both grid trading and trend trading.
The signal does not change when the timeframe changes
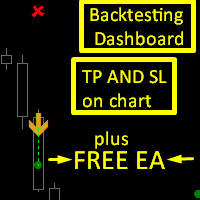
Ambitious Donchian EA can be downloaded from comment section but it need the ambitious donchian indicator to work.
Ambitious Donchian is a Donchian Channel and XO histogram based indicator that gives buy and sell signals in form of up and down arrows with tp and sl as objects on chart.
features :
1. Tp and Sl for each signal , the tp and sl can be selected as based on points or ATR value from indicator settings.
2.backtesting dashboard : the dashboard shows the following according to your i

This is the finest structure marking you will ever find in any market. indicator is coded considering the actual structure any trader would use. indicator is coded based on actual candle breaks and not coded based on any pivot or predefined values or specific number of candles high and low. please check out the screenshot. if you want me to fine tune it according to your needs then i am open for it.

The Flip Flop indicator tracks market trends, ignoring sharp fluctuations and market noise. The indicator can work both for entry points and as a filter.
The Flip Flop indicator displays information in a visual way. Helps in finding entry points during analysis. Suitable for trading on small time frames because it ignores sudden price spikes or corrections in price movements by reducing market noise around the average price.

Trend Channel is a Forex trend arrow indicator for identifying potential entry points. I like it, first of all, because it has a simple operating mechanism, adaptation to all time periods and trading tactics. Created based on a regression channel with filters. We display the signals of the Trend Channel indicator on the price function chart using a mathematical approach.
How it works: when the price breaks through the overbought/oversold zone (channel levels), a buy or sell signal is generate

Wave WOLD MT4外国為替インジケータは、Wolf waveを検索し、取引端末の現在のウィンドウに表示するように設計されています。 取引でオオカミの波を使用するトレーダーのための優れた指標。 取引戦略への適用は、効率と収益性を大幅に向上させます。
指標に関する情報 他のWolf wave指標とは異なり、Wave WOLD MT4外国為替指標は、その有効性を大幅に高める多くの機能を備えています:
最初のものは開いているWindows5Pointパラメータ(真の値)情報サポートを提供します。つまり、Wolf waveが登場したチャートのウィンドウを展開します。 たとえば、EURUSD、AUDUSD、GBPUSDチャートが開いていて、それぞれにWave WOLD MT4インジケーターがインストールされている場合、ユーロモデルが検出されると、対応するチャートが自動的に他のチャートの上に前景に表示され、多数の商品を取引するときに非常に便利になります。 2番目の機能は、ユーザーが自分で選択できるパラメータ(デフォルト設定(12,26,9))であるmacd上の組み込みの発散分析で

The "Angel Algo" indicator, designed for the TradingView platform, is a powerful technical analysis tool that assists traders in identifying dynamic support and resistance levels in real-time. It provides valuable insights into potential breakout points and market regimes.
At its core, the "Angel Algo" indicator utilizes a rolling window of price data to calculate maximum and minimum price levels. It then dynamically identifies support and resistance levels by examining specific conditions re

Trend analysis is perhaps the most important area of technical analysis and is the key to determining the overall direction of an instrument's movement. The Quest Trend indicator determines the prevailing trend. They help analyze the market on a selected time interval. Trends are based on the principle of higher highs, higher lows (for an uptrend) and lower highs, lower lows (for a downtrend). They can have different time periods and they can be related to each other like fractals. For example,

Supreme Arrow は、RSI およびデマーカー インジケーター戦略に基づいた mt4 用のアロー インジケーターです。
この戦略はトレンド市場に適していますが、特にスキャルピングに使用される場合はレンジ市場でも機能します。
推奨される期間 : 任意
推奨アドオン: 200 SMA
Supreme Arrow インジケーターは再ペイントやバックペイントを行わず、信号は遅延しません。 -------------------------------------------------------------------------------------------------------------------------

With this tool you can create some useful data in a CSV file.
You can:
- Determine time frame - the number of candles to be loaded - Name the file whatever you want - Select additional data sets to be loaded
The following data is written to a CSV file.
- Time when the candle was created. - Open price - Close price - High price - Low price
The following selection is also available to you:
- Volume - RSI (you can also select the period) - Moving Avarage (you determine the period and m
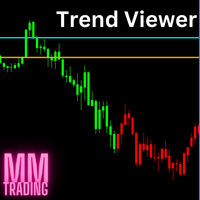
This indicator changes the color of the chart when prices are more bullish or bearish. It is recommended to use this indicator on small timeframes and only during peak trading hours. And don't forget your stop limit. This is not an oracle and not a holy grail.
In the settings, you can change the color of the candles and also their sentiment. To do this, use the Set 1 and Set 2 settings and test.
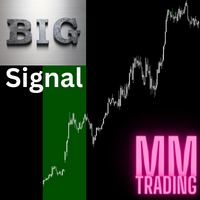
This is a multi-timeframe indicator that collects data from multiple time frames. It tries to identify the trend and predict a pullback. You have to understand that trends emerge suddenly and with that the pullback turns into a new trend. This is not a holy grail, always remember your stoploss. Use this indicator as a complement to your existing strategy.
The lines that are displayed on the chart can be changed so that they are only displayed in the indicator window and are therefore not dist
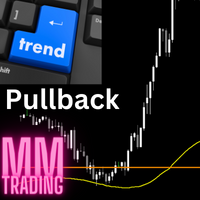
This indicator is not an ordinary moving avarage, even if it behaves similarly. I really like to use this to identify pullbacks. I only use this strategy once a day for one instrument, not more often. It is best if the price is further away from the line in the morning and when the pullback occurs, then you can create an entry setup using this indicator. Use additional indicators or use this as a supplement to your existing strategy.
This is not a holy grail. A pullback can quickly become a t
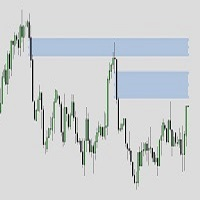
ICT Fair value gapes / Balanced price ranges it marks the fvgs i.e., bisi and sibi both filled and unfilled based on your requirements. it can work on mtf while your on any other time frame i.e., seeing on 5 min. you can watch from filled (BPRs) to unfilled (imbalances) of monthly/weekly/daily/H4/H1 to your likings It can be using multiple times using unique ID with buttons option to on and off the required TF or keeping them all.
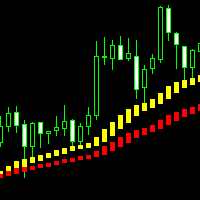
这是 一款可以直观识别波段趋势的分析指标,手工交易最佳选择,不重绘不漂移。 适应任何新手和量化交易的朋友。 参数设置(您购买指标后若不知道如何使用,请私信我): 快线: g_period_88 20
慢线: g_period_88 40
===========交易信号 ===========
快线:黄/蓝线;慢线:红/绿线 多头方向:快线上穿慢线,快线在慢线上方 空头方向:快线下穿慢线,快线在慢线下方
做多信号: 当快线上穿慢线形成一轮多头方向时,首轮多单进场条件为出现两根以上连续阴线,第3根以上K线出现一根阳线,且收盘价格在慢线上方,慢线为红线,即可成交第一单多单,同时如果满足价格回踩触碰到快线,出现一条阳线,且收盘价格在慢线上方,慢线为红线时,也可成交第一单多单;当第一轮多单结束后,此轮多头方向的多单只能满足价格回踩触碰到快线后,出现一条阳线收盘价格在慢线上方,慢线为红线时,才可继续做多进场,即不管快线是黄线或蓝线,只要阳线收盘价格在慢线上方,慢线为红线时就可以做多进场;当快线在慢线上方,阳线收盘价格在慢线上方,但慢线为绿线时,则不进场
做空信号: 当快线下穿

The indicator is the advanced form of the MetaTrader 4 standard Fibonacci tool. It is unique and very reasonable for serious Fibonacci traders.
Key Features
Drawing of Fibonacci retracement and expansion levels in a few seconds by using hotkeys. Auto adjusting of retracement levels once the market makes new highs/lows. Ability to edit/remove any retracement & expansion levels on chart. Auto snap to exact high and low of bars while plotting on chart. Getting very clear charts even though man
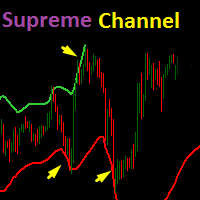
TV atr チャネル指標に基づいた Supreme Channel 指標は、トレーダーに現在のトレンドの反転の可能性に関するヒントを与える動的なサポートとレジスタンスバンドです。
推奨時間枠:15M以上
推奨設定: デフォルトですが、トレーダーは必要に応じて変更することを選択できます。 ==========================================================================
パラメーター :
1. チャンネルの長さ
2.帯域幅(2つのチャネルライン間の距離)
3.乗数(ATR値乗数)
4. チャンネルを表示 (True/False) =====================================================================
Supreme Diamond は、反転およびトレンド取引戦略に基づいたマルチタイムフレーム インジケーターです。インジケーターは再ペイントやバックペイントを行わず、シグナルも遅延せず、アラート付きで売買シグナルを提供します。
インジケーターには、選択できる 2 つの信号モードがあります (ダイヤモンドとして最適なエントリを使用) input 。これが true に設定されている場合、インジケーターは通常モードの信号をフィルターし、可能な限り最良のものをダイヤモンド信号として提供します。ダイヤモンド モードではダイヤモンド信号を微調整することはできません。 。 通常モードは、(ベストエントリーをダイヤモンドとして使用する)入力が false に設定されている場合です。これにより、バンド設定が有効になり、スクリーンショットに示すように、ボリンジャーバンド戦略として通常モードが有効になります。 最高のパフォーマンスが得られるため、ダイヤモンド モードの使用を強くお勧めします。 Supreme Diamond の取引方法: インジケーターからシグナルを受け取ったら取引を開始し、前の安値/
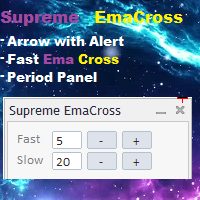
Supreme EmaCross は 2 つの指数移動平均クロスに基づくインジケーターです。EMA クロスに基づいて買いと売りの矢印を生成し、シグナルの出現時にアラートを発します。インジケーターは再描画やバックペイントを行わず、矢印は遅延せず、インジケーターは高速です。トレーダーがインジケーター設定に行かずに ema の値を変更できる ema 期間変更パネル。パネルは移動可能です。
================================================= ====
パラメーター :
速い期間 : 速い絵馬期間
遅い期間 : 遅い絵馬期間
通知とアラートの設定
絵馬ラインのオン/オフ
絵馬の線の色
絵馬の十字矢印のオン/オフ
絵馬の十字の矢印の色
================================================= =========
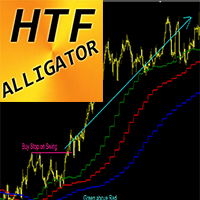
外国為替インジケーターアリゲーターMT4のより高いタイムフレーム
アリゲーターインジケーターは最も強力なトレンドインジケーターの1つです。 HTF とは、より高い時間枠を意味します。 このインジケーターは、トレンドトレーダーだけでなく、プライスアクションエントリーとの組み合わせにも最適です。 HTF アリゲーター インジケーターを使用すると、より高い時間枠から現在のチャートにアリゲーターをアタッチできます。 緑の線が赤の線を上回り、赤が青を上回っている場合にのみ購入エントリーを検討します - チャート上の最新のスイングの最大値で買いストップの未決注文を手配します 緑の線が赤の線を下回り、赤が青を下回っている場合にのみ売りエントリーを検討します - チャート上の最新のスイングの最小値に売りストップの未決注文を配置します HTFアリゲーターインジケーターは、低リスクで大きな利益を獲得する機会を与えます。
// さらに優れたエキスパートアドバイザーとインジケーターはここから入手できます: https://www.mql5.com/en/users/def1380/seller //
MetaTraderマーケットは、開発者がトレーディングアプリを販売するシンプルで便利なサイトです。
プロダクトを投稿するのをお手伝いし、マーケットのためにプロダクト記載を準備する方法を説明します。マーケットのすべてのアプリは暗号化によって守られ、購入者のコンピュータでしか動作しません。違法なコピーは不可能です。
取引の機会を逃しています。
- 無料取引アプリ
- 8千を超えるシグナルをコピー
- 金融ニュースで金融マーケットを探索
新規登録
ログイン