YouTubeにあるマーケットチュートリアルビデオをご覧ください
ロボットや指標を購入する
仮想ホスティングで
EAを実行
EAを実行
ロボットや指標を購入前にテストする
マーケットで収入を得る
販売のためにプロダクトをプレゼンテーションする方法
MetaTrader 4のための有料のテクニカル指標 - 49

Ultra Arrows Scalper Pro Ultra Arrows Scalper pro indicator for efficient binary options trading ----------- complete lack of redrawing -----------... ....... ... An arrow is formed on the current candle and indicates the direction of the next candle and the possible direction of the trend in the future. Enter the deal is on the next candle. its advantages: signal accuracy. complete lack of redrawing. You can choose absolutely any tool. the indicator will provide many profitable and accurate
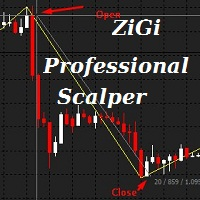
ZiGi Professional Scalper Indicator: Real Wave Analysis Tool This indicator reveals the true waves of the market by identifying alternating highs and lows on the price chart, thus displaying the market's wave structure. The algorithm of this indicator is entirely new, and its association with ZiGi Professional Scalper and Zigzag is purely cosmetic. It is based on eight radically different algorithms and is capable of calculating market volumes in real-time. When using this indicator, manual wave
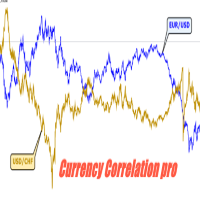
Currency Correlation pro
Currency correlation happens when the price of two or more currency pairs moves in conjunction with one another. There can be both positive correlation, where the price of the currency pairs moves in the same direction and negative correlation, where the price of the currency pairs moves in opposite directions. this indicator put the price of 5 pairs on sub-windows so you see what happens in one chart.
How to use Correlation Indicator?
You can simply choose curren
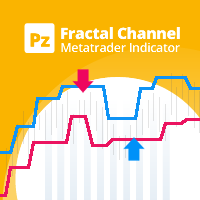
これは、変動するフラクタル期間のブレイクアウトをトレードするための非常にシンプルでありながら効果的な指標です。フラクタルは、奇数のバーの価格形成であり、中央のバーが形成の最高または最低価格ポイントです。これらの価格は短期のサポートとレジスタンスのレベルとして機能し、このインジケーターは価格チャネルを描き、ブレイクアウトを表示するために使用します。 [ インストールガイド | 更新ガイド | トラブルシューティング | よくある質問 | すべての製品 ] 取引が簡単 フラクタルブレイクアウトは長いトレンドを開始することができます フラクタルチャンネルは素晴らしいトレーリングストップメソッドです 再描画および非再描画ではありません あらゆる種類のアラートを実装します カスタマイズ可能な色とサイズ 期間を長くすると、ブレークアウトの信頼性が高まりますが、出現頻度は低くなります。この指標は、より高いタイムフレーム分析で確認する必要があります。一般に、短い時間枠ではフラクタル期間を増やし、長い時間枠ではフラクタル期間を短くします。
入力パラメータ 期間:フラクタルを計算するバーの量。奇数で
Fast Signal Fx This indicator is working very simple. The indicator will detect the swing pattern and find the return point. The main structure was combined with Stochastic Oscillator level for return point and moving average calculation for confirm the direction. The important strategy is making fast signal for scalper trading technique with high frequency trade. Indicator Installation Attach this indicator to the chart window of currency pairs. The recommended currencies are EURUSD, GBPUSD, U

Indicator is used for: defining price probability distributions. This allows for a detailed representation of the channel and its borders and forecast the probability of a price appearing at each segment of its fluctuations; defining the channel change moment. Operation principles and features Indicator analyzes a quote history on lower timeframes and calculates a price probability distribution on higher ones. Forecast algorithms allow the indicator to calculate probability distributions and m
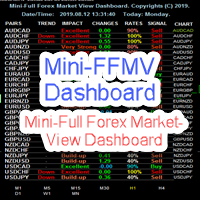
MINI FFMV Dashboard MINI FFMV Dashboard is a MINIATURE custom indicator of FULL FOREX MARKET-VIEW DASHBOARD created to give the Traders a full view of what is going on in the market. It uses a real time data to access the market and display every bit of information needed to make a successful trading. It shows as many as 30 currency pairs or as allowed to display in the Market Watch of your MT4 USAGE: For Solo Trading For Basket Trading (See the screenshot on how) COMPONENTS: Trend: Overall tren

Mini Forex Market-View Dashboard and Mini-CSM Mini Full Forex Market View Dashboard is a miniature creation of FULL FOREX MARKET_VIEW Custom indicator created to give the Traders a full view of what is going on in the market but in a partial matter to make it conscise. It is useful most especially for those who don't like bogus indicators or those who have a PC with limited screen size. It uses a real time data to access the market and display every bit of information needed to make a successful

This indicator calculate the minimum,maximum,average and relative (to points of the bar) spread in the chart applied period. The indicator must be applied to one or more different period on a Pair and analyze the spread for all the Pairs available by the Broker. The csv output for one minute chart is something like this https://gofile.io/?c=K5JtN9 This video will show how to apply the indicator https://youtu.be/2cOE-pFrud8

An Indicator that calculates the Pivot Point line, along with the 2 levels of support and resistance lines, known as S1, S2, R1, R2 respectively.
The formulas for calculation are as follows:
Pivot point (PP) = (High + Low + Close) / 3
First level support and resistance: First resistance (R1) = (2 x PP) – Low First support (S1) = (2 x PP) – High
Second level of support and resistance: Second resistance (R2) = PP + (High – Low) Second support (S2) = PP – (High – Low)
The trader can adj

このシステムは、初心者トレーダー向けに一貫したエントリを作成するように設計されたシンプルなシステムです。同じ方向の2つの連続したバーが見つかり、ADRおよびADXインジケータが確認されると、入力矢印が配置されます。アイデアは、システムの聖杯を探しているのではなく、市場に参入する規律ある方法を持つためにシステムを使用しているということです。代わりに、お金とリスク管理に焦点を当てる必要があります。 ピボットポイントをターゲットラインとして使用して、可能性のあるエントリに利益を生むスペースがあるかどうかを判断し、報酬/リスク比が最小2対1の場合にのみ市場に参入することをお勧めします。そのため、エントリの場所から次のピボットラインまでのスペースは、エントリからストップロスラインまでのスペースの少なくとも2倍の大きさでなければなりません。 リスクはストップロスの金額であり、アカウント値の0.5〜1.0%である必要があります。使用を開始する場合、リスクはさらに少なくなり、0.2%になる可能性があります。利益も非常に少ないため、それは非常に少ないように見えますが、いくつかの損失を連続して取ることを学

Mars 9 is a TREND indicator is a powerful indicator of TREND DIRECCTION for any par and any timeframe. It doesn't requires any additional indicators for the trading setup.The indicator gives clear signals about opening and closing trades.This Indicator is a unique, high quality and affordable trading tool. Can be used in combination with other indicators
Perfect For New Traders And Expert Traders Low risk entries. Never repaints signal. Never backpaints signal. Never recalculates signal.

Insider Scalper Binary This tool is designed to trade binary options.
for short temporary spends. to make a deal is worth the moment of receiving the signal and only 1 candle if it is m1 then only for a minute and so in accordance with the timeframe.
for better results, you need to select well-volatile charts....
recommended currency pairs eur | usd, usd | jpy ....
the indicator is already configured, you just have to add it to the chart and trade .... The indicator signals the next can

インディケータは現在のクオートを作成し、これを過去のものと比較して、これに基づいて価格変動予測を行います。インジケータには、目的の日付にすばやく移動するためのテキスト フィールドがあります。
オプション:
シンボル - インジケーターが表示するシンボルの選択;
SymbolPeriod - 指標がデータを取る期間の選択;
IndicatorColor - インジケータの色;
HorisontalShift - 指定されたバー数だけインディケータによって描画されたクオートのシフト;
Inverse - true は引用符を逆にします。false - 元のビュー。
ChartVerticalShiftStep - チャートを垂直方向にシフトします (キーボードの上下矢印)。
次は日付を入力できるテキストフィールドの設定で、「Enter」を押すとすぐにジャンプできます。
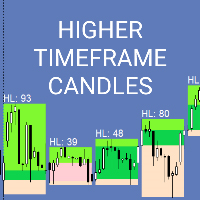
The indicator draws candles of the selected high timeframe on the current chart. It supports both standard timeframes and custom ones set in minutes. Built-in support for displaying the size of the candle, its body, as well as the upper and lower shadows. Alerts when High / Low breaks the previous candlestick of the selected timeframe. Customized types of elements for the simultaneous operation of several indicators on the same chart.

Auto redrawn Pivot support resistance horizontal lines with signal of Buy/Sell possibilities with SL level and with trend support resistance lines too used for all symbols and time frames you can adjust inputs parameters (only 2) and test it on various symbols and time frames input number of bars for calculation and moving average for signal accuracy example : use it on M30 time frame with input 200 for bars count and 100 for MA

works great with the trend, ideal for traders who trade using the scalping system. This is a pointer indicator. how to make deals. when the blue one appears, you need to open a trade to increase by 1 candle if the timeframe is m1 then for 1 minute, etc. if a red dot appears, you should make a deal to reduce it by 1 candle. Indicator signals appear along with a new candle; the working candle is the one on which the signal is located.

The easiest indicator to know to which address the price is MOVED: taking into account other indicators to measure the exact price direction more accurately and with less noise. it is useful to know when to perform a BUY operation one from SELL

レベルスキャナー インジケーターは、すべての サポートレベルとレジスタンスレベル とともに、チャート上の 上位 エリアと 下位 エリアの識別を自動化するように設計された強力なツールです。これには ハル移動平均 の使用が組み込まれており、実際の傾向をより明確かつ滑らかに表現します。このインジケーターは驚くべき速度で動作するため、トレーダーは重要な関心領域を迅速に特定し、より多くの情報に基づいた取引上の意思決定を行うことができます。 レベルスキャナーの際立った機能の 1 つは、その多用途性です。あらゆるシンボルと時間枠に適用できるため、幅広い取引戦略に適しています。このインジケーターは効率的にシグナルを生成し、トレーダーが潜在的な取引設定を迅速に特定できるようにします。さらに、個々の取引戦略や好みに合わせて完全にカスタマイズできるユーザーフレンドリーなパラメーターも提供します。 トレーダーは、独自の期間、CCI、RSI、ストキャスティクス指標を通じてシグナルをフィルター処理することで、シグナルをさらに洗練させることができます。この機能により、トレーダーはインジケーターの出力を特定の要件や市
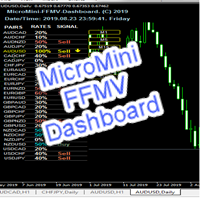
MicroMini FFMV Dashboard This is a custom indicator created to give Traders a full view of what is going on in the market. It uses a real time data to access the market and display every bit of information needed to make successful trading. THIS IS A MicroMini size of the FULL FOREX MARKET VIEW DASHBOARD INDICATOR. This is for those who don't like the Indicator to cover all the charts and for those who don't like BOGU S things. They practically perform the same operation but MicroMini FFMV Dashb
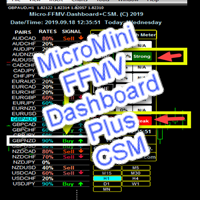
MicroMini FFMV Dashboard+CSM This is a custom indicator created to give Traders a full view of what is going on in the market. It uses a real time data to access the market and display every bit of information needed to make successful trading. To add value to the trading operation, Currency Strength Meter is added to it in order to consolidate the effective work of this indicator.
THIS IS A MicroMini size of the FULL FOREX MARKET VIEW DASHBOARD INDICATOR with CSM added. This is for those who
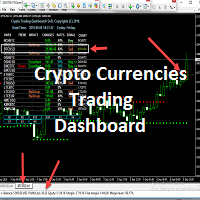
Micro Crypto Trading Dashboard
This is a custom indicator created to give CRYPTO TRADERS a full view of what is going on in the Crypto market. It uses a real time data to access the market and display every bit of information needed to make successful trading. This is a Micro size of the Compact Crypto Market Trading Dashboard Indicator created mainly for trading Crypto Currencies Markets for a living.
They practically perform the same operation but MicroMini FFMV Dashboard has a few feature

+Pips is a simple indicator which was design with FIVE trading confirmations in mind that works on all pairs and time frame. It's great for scalping, as it is a powerful indicator on its own. This indicator can be used by any type of trader(new or experience). The choice of sending notification to your mobile device and sounding alerts is up to the user as this is an optional setting. This is all you need no more cluster to your charts. If high probability and low risk trades, that alerts and se

A simple Approach to Elliot waves patterns Signal generated on trend continuation when breaking the "5" level or on corrective direction after 1-5 waves detected 1-5 labeled points arrows used for signal UP/DOWN direction Chaotic patterns in Blue are drawn all times until a 1-5 Elliot wave pattern detected 1-5 Red pattern in Bull Market : UP arrow in BULL trend continuation OR DOWN arrow as a reversal DOWN direction as pattern correction 1-5 Green pattern in Bear Market :DOWN arrow in BEAR tr

The TRs indicator works by using the waveform function. Thus, all entry points will be the optimal points at which motion changes. Entry points should be used as points of potential market reversal. The indicator settings by default are quite effective most of the time. You can customize them based on your needs. But do not forget that the approach should be comprehensive, the indicator signals require additional information to enter the market.
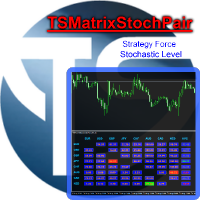
TSMatrixStochasticPair Indicator for currency strength trading, through the Stochastic indicator. Intelligent algorithm for scalper and intraday traders. The benefits you get: Never redesigns, does not retreat, never recalculates. Works on forex, timeframe from M1 to D1. Integrated pop-up, push notification and sound alerts. Easy to use. Parameters: KPeriod: k_ stochastic parameter. DPeriod: D_ stochastic parameter. Slowing: stochastic parameter. MA_Method:
Multicurrency RSI indicator that works on any set of timeframes. The set of symbols is chosen from the Market Watch of the terminal. The table is customizable (color, width, font size, line height, column width) Alerts and sending push-notification on a smartphone.
Adjustable Parameters: Signal_Bar - choose a bar for analysis (current or closed) 6 switches for timeframe sets Indicator_Period - period of the RSI indicator Level_Signal - the level of the indicator value to generate signal (the o

SSA stands for 'Singular Spectrum Analysis'. It combines elements of classical time series decomposition, statistics, multivariate geometry, dynamical systems and signal processing. SSA decomposes time series into a sum of components (ETs), with each component representing a lower smoothing, using several SVD (Singular Value Decompositions).
It is a powerful filtering process used in many fields of research (climatology, biomedical, aerospace, etc), where high quality forecasting and smoothin

SSA stands for ' Singular Spectrum Analysis '. It combines elements of classical time series decomposition, statistics, multivariate geometry, dynamical systems and signal processing. SSA decomposes time series into a sum of components (ETs), with each component representing a lower smoothing, using several SVD ( Singular Value Decompositions ).
It is a powerful filtering process used in many fields of research (climatology, biomedical, aerospace, etc), where high quality forecasting and smoo

The Th3Eng PipFinite indicator is based on a very excellent analysis of the right trend direction with perfect custom algorithms. It show the true direction and the best point to start trading. With StopLoss point and Three Take Profit points. Also it show the right pivot of the price and small points to order to replace the dynamic support and resistance channel, Which surrounds the price. And Finally it draws a very helpful Box on the left side on the chart includes (take profits and Stop loss
Mars 10 is a Oscillators indicator is a powerful indicator of CHANGE DIRECCTION for any par and any timeframe. It doesn't requires any additional indicators for the trading setup.The indicator gives clear signals about opening and closing trades.This Indicator is a unique, high quality and affordable trading tool. Can be used in combination with other indicators
Perfect For New Traders And Expert Traders Low risk entries. Never repaints signal. Never backpaints signal. Never recalculat
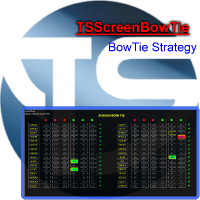
Expert for trading with the BowTie strategy. Intelligent algorithm for scalper and intraday traders. Multi time frame and multi currency panel. The benefits you get: Easy-to-use panel that alerts you to crossings of moving averages, like strategy, on each currency. Possibility to choose your favorite crosses. Possibility to choose to activate only the preferred time frames. Never redesigns, does not retreat, never recalculates. Works on forex and CFD, timeframe from M5 to D1. Integrated pop-up

KT Asian Breakout indicator scans and analyzes a critical part of the Asian session to generate bi-directional buy and sell signals with the direction of a price breakout. A buy signal occurs when the price breaks above the session high, and a sell signal occurs when the price breaks below the session low. MT5 Version is available here https://www.mql5.com/en/market/product/41704
Things to remember
If the session box is vertically too wide, a new trade should be avoided as most of the price
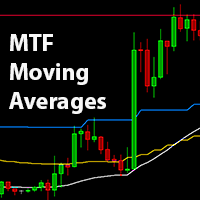
MTF Moving Averages is an useful indicator that brings you data from fully customizable higher timeframe Moving Averages on your charts, you can add multiple Moving Averages to use even more data of current market conditions. Check the indicator in action [Images below]
What MTF Moving Averages does apart from showing higher timeframe MA's?
Time saver , having all your higher timeframe MA's in just one chart, time is key, avoid switching between timeframes. Enter Trends precisely, easy to fol

This Momentum Seeker indicator is super simple! It is based in a few indicators to give you a quick entry to the Market. Once candle is closed and if parameters are all in place, an arrow is drawn in the chart, so there is no repainting! It works with any instrument! Risk management and trading skills are still needed! Inputs: Sensitivity: It is based in Periods, so the lower the number, more signals will come to screen but accuracy will decrease also. Recommended is 9 and above Audible_Alerts:
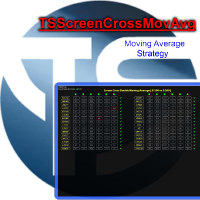
indicator for trading with the strategy with two moving averages. Intelligent algorithm for scalper and intraday traders. Multi time frame and multi currency panel. The benefits you get : Easy to use panel that alerts you to crossings of moving averages, as per strategy, on each currency. Possibility to choose your favorite crosses. Possibility to choose to activate only the preferred time frames. Never redesigns, does not retreat, never recalculates. Works on forex and CFD, timeframe from M

Infinity Oscillators Ultimate は 、RSI、ストキャスティクス、MACD、CCI、ボリューム戦略を利用するトレーダーの取引体験を向上させるために設計された包括的な OSCI-KIT です。包括的な機能を備えたこのインジケーターは、市場トレンドの分析、反転とリトレースメントの特定、ATR を使用した日中ターゲットの計算、および重要な取引イベントに関する情報の入手のための強力なツールセットを提供します。 このインジケーターの際立った機能の 1 つは、最も人気のある 5 つのオシレーターを 1 つのインジケーター ウィンドウに統合できることです。各オシレーターは個別の色で表されるため、トレーダーはトレンド、反転、リトレースメントを一目で簡単に識別できます。これらのオシレーターを組み合わせることで、Infinity Oscillators Ultimate は市場ダイナミクスの全体的なビューを提供し、トレーダーが情報に基づいた取引の決定を下せるようにします。 トレーダーが市場の動向を常に最新の状態に保てるように、インジケーターは高速で信頼性の高い通知システムを提

Welcome to my new indicator. It is a simple trend indicator, suitable for all instruments and timeframes. You should adjust it to your taste and you will know this product it's trustworthy. Trading skills and risk management, as usual are needed! There is not a perfect indicator in the market but you can find great helpers, and I think this is one of them. Inputs: SupRes_Interval Original setting is 5 and works very well with Indices. Lower numbers are more sensitive and suitable for scalpin

The Quadro Trend indicator works stably, correctly, and gives great flexibility when analyzing prices. There are many similar indicators, but Quadro Trend , unlike most of them , gives pretty good signals.
A great tool for working inside the day. On charts with a period of less than a day will help you see the daily candle in its usual form.
U-turn occurs when an arrow of the corresponding color appears. There is a parameter in the indicator to enable the supply of alerts when the color cha

All time zones. But I use it daily and 4 hours continuously. When trading in small time zones it is necessary to check the top time zones and especially 4 hours and logs. Red Arrow - SELL Green Arrow - BUY When the Green Arrow is lit while the Bar is Blue (Check the overall trend rise) - Buy When the Red Arrow is lit while the Bar is Red (Check general trend downtrend) - Sales NO RE-PAINTING GOOD TRADE
Monitoring of real trading on this system https://www.mql5.com/ru/signals/632726 Guru Pro Signal does not repaint! Guru Pro Signal is an original indicator, developed for the work of employees of one of the large funds! It is the best tool that can be added to your chart!
Guru Pro Signal signals about price reversal with the highest degree of accuracy, the best tool for both scalping and position trading. The entry signal is shown by the BUY and SELL arrows. It is possible to receive noti

KT MACD Divergence shows the regular and hidden divergences build between the price and oscillator. If your trading strategy anticipates the trend reversal, you can include the MACD regular divergence to speculate the potential turning points. And if your trading strategy based on the trend continuation, MACD hidden divergence would be a good fit.
Limitations of KT MACD Divergence
Using the macd divergence as a standalone entry signal can be a risky affair. Every divergence can't be interpr

A professional version of the ZigZag indicator for visualizing the structure of price movements by fractals. Fractal ZigZag fixes the flaws of the standard version of the ZigZag indicator MT4. It uses Price action and a unique filtering algorithm to determine fractals. Suitable for all types of trading.
Ideal for trading according to the WM pattern "Sniper" strategy !!! Features Marks the place of price reversal during the formation of a new fractal with specified parameters. Suitable for

it is an indicator for trading on the forex market and binary options, it is a trend tool with which you can take it most often when the first signal appears, open a trade in the indicated direction stop loss set above the arrow if the signal is lower or below the arrow if the buy signal when signals appear in the same direction where the transaction is open, you can enter into additional stop loss orders; we also set up trading without take profit; you need to close the transaction when a signa
TickChart Indicatorは、MetaTraderのメインウィンドウにティックチャートを表示します。
(無料のLite版、TickChart Indicator Liteでは、 表示するティック数を20に制限し、以下の説明にあるアラート機能を省いています。) ティックチャートは、市場の動きを最も詳細かつリアルタイムに示すティックラインを描画します。値が変わるたびに発生するティックの間隔は1分足のローソク幅より短いので、通常のチャート上には描けません。通常、数個のティック線分が、1分足のローソクが完成する間に発生しており、重要な指標の発表直後には、その数が100を超える事もあります。 このインディケーターは、ティックラインをメインウィンドウの通常のチャートの上に描きます。通常のチャートは、"時間-価格"空間に描きますが、ティックチャートは、"ティック-価格"空間に描かれます。すなわち、ティックチャートのX軸は時間ではなく、市場が活発だとX軸の進行は速く、閑散だと遅くなります。 TickChart indicatorは、いろいろな場面で役立ちます。例えば、 スキャルピングの道

高解像度ディスプレイ対応のレイアウト修正版! 各ブローカーに依って異なるサーバー時間は、短時間足でトレードする際には大きな負荷となります。
このインジケータは、勝つために必要な最低限のトレードインフォメーションをひとめでわかりやすいように表示します。
サブウインドウにはローカルタイムを表示し、メインチャートにはローカルタイムだけでなく、
-Symbol(通貨ペア)
-Period(時間足)
-BarEndTime(バー残り時間)
-Spred(スプレッド)
-TokyoTime(東京時間)
-LondonTime(ロンドン時間)
-NewYorkTime(ニューヨーク時間)
-ServerTime(サーバー時間)
を表示します。
メインチャートでのインフォメーション表示は、右上・右下・左上・左下の4箇所から選択可能です。
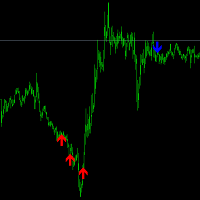
This index doesn't disappear, it doesn't get rewritten, the way it's calculated is to look for a trend shift, when the arrow comes up, there's a high probability that the trend will change. It is recommended to use a larger cycle, but you can also use the 5 minute cycle, the larger the cycle, the higher the winning rate. Indicators in the form of arrows, blue down arrow short, red up arrow do, in a large trend may appear in a continuous arrow, every arrow appears, is an opportunity to add positi
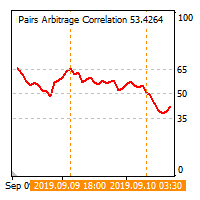
The cross-correlation indicator calculates the relationship between the specified pairs for the previous period. Automatically selects the instruments with the highest and the lowest correlation, and then simulates trading on the selected pairs on the same test period. Then indicator displays the pairs that have shown the best trading results. Visualizes the PAC (Pairs Arbitrage Correlation) criterion for the pairs selected by the trader. The signal to open trades is set by the PAC levels. When

The most handy indicator for searching classical and hidden divergences either between price chart and an oscillator-type indicator or between two oscillator-type indicators.
Just drop the indicator on the chart at which 1 or 2 oscillators are executed (see the video below).
The indicator doesn't require setting-up. You have just to choose the operation mode: to search divergences between price chart and an oscillator or between two oscillators..
Switch between classical and hidden divergen
Индикатор отображает 4 текущих уровня между, которыми находится цена. Уровни вычисляются на основе диапазона предыдущей недели. Количество и значение уровней произвольное и выражается в процентах . Положение уровней отсчитывается от минимума предыдущего дня (пример можно посмотреть в описании параметров). Целесообразно размещать уровни в строке настроек по порядку, тем не менее индикатор сам их отсортирует и если обнаружатся уровни отстоящие менее чем на 1% выдаст ошибку. Индикатор работает н
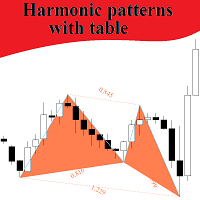
This indicator searches harmonic patterns on different TFs, and can track patterns in real time on all TFs for seted symbols. High and Low points for patterns defined by Bill Williams method, not by Zigzag or Fractals, it's more clear signals. Important input parameters: Where patterns search : "Current symbol" - searches patterns on the current symbol; "Seted symbols" - indicator creates table with seted symbols. Allowable percent of deviation : percent of deviation from perfect pattern Sym
Ни для кого не секрет, что для того чтобы, заработать на финансовых рынках необходимо движение цены инструмента. И чем движение сильнее тем больше возможностей предоставляется для торговли трейдеру. Для поиска сильных движений цены и был разработан PulseScanner. Панель предназначена для быстрого визуального нахождения и отображения сильных движений цены по всем периодам и на любых выбранных валютных парах одновременно. Индикатор имеет несколько режимов поиска и визуального отображения сигналов.
Mars 11 is a Trend indicator is a powerful indicator of FOLLOW DIRECCTION for any par and any timeframe. It doesn't requires any additional indicators for the trading setup.The indicator gives clear signals about opening and closing trades.This Indicator is a unique, high quality and affordable trading tool. Can be used in combination with other indicators Perfect For New Traders And Expert Traders Low risk entries. Never repaints signal. Never backpaints signal. Never recalculates signal.
Gladiator Signal indicator for binary options can be used in the forex market...
a signal appears when you open a new candle, we need to wait for it to close.. and at the time of opening a new one if the signal is to open a deal for one candle of the current timeframe works great on all time frames... in the settings you can enable turn off the alert and sound vision...

この指標により、価格がいずれかのレベルに達する可能性を判断できます。そのアルゴリズムは非常に単純で、特定の通貨ペアの価格レベルに関する統計データの使用に基づいています。収集された履歴データのおかげで、現在のバーの間に価格が変化する範囲を決定することが可能です。 そのシンプルさにもかかわらず、この指標は取引において非常に貴重な支援を提供できます。そのため、トレーディングポジションのTakeProfitレベルとStopLossレベルを決定することができます。保留中の注文の価格の決定と、TrailingStopの価格レベルの決定の両方に役立ちます。 さらに、この指標は既存の戦略に統合できます。たとえば、ある種の日中戦略を使用します。次に、D1時間枠でこのインジケーターを設定することで、新しいトレーディングポジションを開くことは既に望ましくないことを克服した後、レベルを取得できます。 このインディケーターの主な欠点は、純粋に履歴データに依存しており、特定の現在の市場の変化にまったく反応しないことです。 このインディケーターの設定は、入力パラメーター-L1 ... L4-を選択することにより実

DO NOT STOP OCCUPY THE POWER OF THE UNION OF VARIOUS TIME FRAMES. From now on you can see the RSI that you use for your trading analysis in a single window without having to be opening others to form very graphic and easy. Color settings Possibility of deactivating the timeframes you want. Up or down arrows in relation to the previous sail. We also have Multiframe MACD and Momentum version available. Visit My signals https://www.mql5.com/es/signals/620506

Комплексный индикатор который работает на основе 4-х стандартных индикаторов МТ4: Moving Average, Stochastic, Bollinger Bands, RSI (в дальнейшем список индикаторов будет расширятся). Показания индикаторов берутся из 7-и тайм фреймов от М1 до D1. Строка Average показывает средние значения индикаторов в разрезе тайм фреймов. Сигналы индикаторов: Moving Average: быстрая скользящая выше медленной скользящей - покупка; быстрая скользящая ниже медленной скользящей - продажа; данные берутся из последне
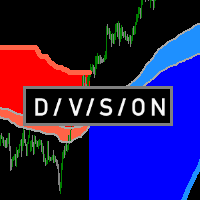
Определения текущей тенденции одна из самых важных задач трейдера не зависимо от стиля торговли. Индикатор Division поможет с достаточно высокой вероятностью это сделать. Division - индикатор распознавания тенденции, использующий в качестве источника данных подобие скользящих средних, в расчете которых используются объемы. От этих средних строятся границы, которые служат сигнализатором для смены текущей тенденции. Показания индикатора не изменяются не при каких условиях. При желании можно вкл

The Ceres Trend Indicator displays polynomial regression on history and in the current time.
In the indicator settings: module - degree of regression (1 - linear, 2 - parabolic, 3 - cubic, etc.) koeff is the standard deviation channel multiplier.
The main direction of application of this indicator is the ability to determine the likelihood of further growth. If there is an intersection of the linear regression line from below, then this indicates a trend inhibition and a possible reversal.

The OMEGA PIP is a unique revolutionary semi -automated software which change the game entirely to your favor.This product developed from years of research in the FX Market is embedded with complex algorithms which filters off false signals, generating only accurate valid signals which is immediately printed on your chart , thus it guarantees profit anytime its installed on your computer. Due to this significant feat, the daunting and the strenuous effort a traders goes through during

Are you a trend trader tired of noise, spikes and whipsaws? The Royal Ace Signal Bar indicator tracks the market trend with an unmatched reliability, by ignoring sudden fluctuations and market noise around the mean price. It allows you to be steady when everyone else is shaky. Amazingly easy to trade The indicator needs no optimization at all It implements a multi-timeframe dashboard The indicator is non-repainting
Anatomy of the Indicator The Royal Ace Signal Bar indicator displays a co

Royal Ace Signal 3 MA The Royal Ace Signal 3 MA indicator tracks the market trend with combine 3 MA. Amazingly easy to trade The indicator needs no optimization at all It implements a multi-timeframe dashboard The indicator is non-repainting
Anatomy of the Indicator The Royal Ace Signal 3 MA indicator displays a colored arrow. If the arrow is gold you should be looking for long trades, and if the arrow is red, you should be looking for short trades. Use this indicator in H1, H4 timeframe
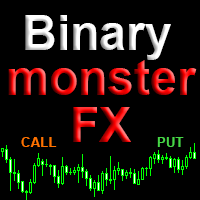
Binary Monster FX is a ready-made trading system. The real-time indicator displays the profitability of its strategy on history. This allows you to choose the most profitable currency pair and evaluate the profitability immediately, even before the start of real trading. Features Ready trading system Displays Binary Monster FX strategy trading statistics for a given number of bars of historical data. Gives a visual and audible warning when a CALL or PUT signal appears. Warns before a signal abou

A trend indicator, the main direction of which is to display the possible direction of price movement. The price reversal occurs with the same patterns on the indicators. The indicator shows the possible direction of price movement. Signals are generated on the previous bar. Red Coogie - the signal is considered unconfirmed. The indicator works best on timeframes H1, H4 and D1.
This is one of the few indicators that can signal strength and direction, which makes it a very valuable tool for tr
DPOMASimple (DetrendPrice Oscillator) is an indicator that removes the price trend, in order to observe the cyclical movements of the price without the noise of the trend, the DPOMASimple indicator can be used to determine support and resistance levels in the peaks and valleys or as trading signal whe cross 0 level.
DPOMASimple > 0 -> Buy. DPOMASimple < 0 -> Sell.
Markets in range: Maximum and minimum will be the same as in the past. Set the overbought and oversold levels ba

Introducing the trend indicator! Ready trading system. The principle of the indicator is to automatically determine the current state of the market when placed on a chart. The indicator analyzes market dynamics for pivot points. Shows the favorable moments of entering the market with stripes. Can be used as a channel indicator or level indicator! This indicator allows you to analyze historical data, and on their basis display instructions to the trader on further actions. To find out how to dete
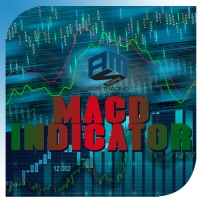
This indicator is based on the standard MACD indicator, but showing the changes up and down colored. It is a nice assistance to visualize our Expert MAGIC MACD.
MAGIC MACD MT4: https://www.mql5.com/en/accounting/buy/market/41144?period=0 MAGIC MACD MT5: https://www.mql5.com/en/accounting/buy/market/41151?period=0
Inputs in the Indicator: Fast EMA: standard is 12 Slow EMA: standard is 26 Signal: depending on what you want to see. For the MAGIC MACD the standard is 1
in common settings: Fixe

The indicator monitors the market trend with very high reliability. Sharp price fluctuations, as well as noise around averaged prices, are ignored. All intersection points will be ideal points at which the direction of the trend changes. Signal points, places where color changes, can be used as points of potential market reversal. This development can be used both for long-term trading, and for piping on small periods. The indiuctor algorithm implements a kind of technical analysis based on the

This Indicator calculates based on the Stochastic, Fractal and ZigZag the best possible entries in all timeframes.
Input Stochastic Oscillator K line period = standard is set to 10
D line period = standard is set to 3 slowing = standard is set to 4 Method = stadard is set to Linear weighted Price value = standard is set to close/close
ZigZig settings Depth = standard is set to 24 Deviation = standard is set to 5 Backstep = standard is set to 3 Bar filter = staard is set to 35
Alarm set

This indicator will provide you with everything you need in order to overcome losses due to human emotions. The indicator determines the moments of a trend reversal and the direction of its movements. This development is equipped with the most modern, adaptable trading algorithms. The main secret of short-term trading is to have information on when to enter a deal. The indicator works great on all timeframes and informs the trader about the most successful moments of buying or selling a currency
MetaTraderマーケットは自動売買ロボットとテクニカル指標を販売するための最もいい場所です。
魅力的なデザインと説明を備えたMetaTraderプラットフォーム用アプリを開発するだけでいいのです。マーケットでプロダクトをパブリッシュして何百万ものMetaTraderユーザーに提供する方法をご覧ください。
取引の機会を逃しています。
- 無料取引アプリ
- 8千を超えるシグナルをコピー
- 金融ニュースで金融マーケットを探索
新規登録
ログイン