YouTubeにあるマーケットチュートリアルビデオをご覧ください
ロボットや指標を購入する
仮想ホスティングで
EAを実行
EAを実行
ロボットや指標を購入前にテストする
マーケットで収入を得る
販売のためにプロダクトをプレゼンテーションする方法
MetaTrader 4のための有料のテクニカル指標 - 104
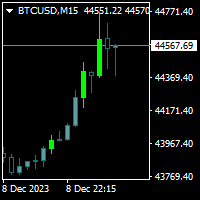
Trendfinder MA Pro are based on Colored candlesticks showing the trend based on two Moving Averages as Signal and two Moving Averages as a Buy and Sell Zone, the slope of the slow Signal moving average and ATR and Volume increasing. This indicator will give you the color change on the next bar on the confirmation candle and will provide alert on Buy and sell signal, when it enters the buy and sell zone and when the market test the buy or sell zones as support or resistance and will never repain

インジケーターは他のプログラム言語からMQLに翻訳されています。RTIはチャートのトレンドをオシレーション的に識別する強力なツールです。
以下はオリジナル・プログラマーからのメモです:
概要 Zeiiermanによって開発されたRelative Trend Index (RTI)は、市場トレンドの強さと方向を測定するために設計された革新的なテクニカル分析ツールです。従来の指標とは異なり、RTIは市場のボラティリティに適応し、対応することができ、しかも短期的な市場変動の影響を最小限に抑えることができます。
Relative Trend Indexは、トレンドフォローと平均回帰の特性を融合させ、ト レ ン ド の 強 さ に 対 す る カ ス タ マ イ ズ 可 能 で 直 感 的 な ア プ ロ ー チ を 備 え て い ま す 。
RSIの代わりにこのRTIを使用する利点 相対力指数(RSI)と相対トレンド指数(RTI)は、どちらも強力なテクニカル指標で あり、それぞれに独自の強みがあります。 し か し 、特 に ト レ ン ド や 買 わ れ 過 ぎ / 売

This is a trend Predictor. Honestly I have to give some credit to some few developers I know personally because they helped pulled this off. The trend indicator uses special optics to direct the flow of price . it detects where the trend is moving into It uses price action and a few other embedded custom indicator. You can use it in all timeframes and will be available at a much cooler price.
Please test this Indicator before buying to make sure you like what you see. I can't guarantee th

**IRDeS(距離とスパイクの検出指標)**は、ほぼ完璧なタイミングで市場に参入するための力とゼロからの距離を示す指標です。 ゼロからの距離とボラティリティを検出する青色の連続線と、ゼロを上回る赤色のヒストグラムおよびゼロを下回る緑色のヒストグラムから構成され、特定のローソク足での取引の強度と力を測定し、チャート上の特定のポイントで強力な推進、つまり「スパイク」を生成します。 IRDeSは技術分析において貴重で革新的かつ多様なツールであり、市場参入後の動きのパワーの品質も測定できるため、現代の状況に適しています。 IRDeSの明白な利点にもかかわらず、他のどの指標と同様に、アナリストは慎重に行動し、特定のチャート領域に焦点を当て、他の領域を避ける必要があります。 特にトレーダーはこの指標を過買いまたは過売りの条件を見つける手段として使用しようとするかもしれませんが、これが常に機能するわけではありません。 IRDeSは任意の値を取る可能性があるため、「過剰のしきい値」を正確に特定することは不可能です。当社の指示に従えば、時間と十分な経験を積めば、ほぼ誰でもチャートデータを分析し、IRD
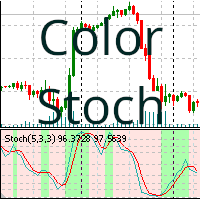
Stochastic Oscillator with Coloring このインジケーターは、インジケーターのトレンドに応じて背景を塗りつぶします。このインジケーターは、ストキャスティクス オシレーターの値に応じて背景を塗りつぶします。トレンドが上昇または下降しているかどうかに関係なく、背景の色はストキャスティクス オシレーターのパラメーターで決定されます。ただし、過去 400 バーのみが描画されます (注記を参照)。 変更可能なパラメータ:
%K Period : %K 期間 %D Period: %D 期間 Slowing: 遅延期間 Price Field : Low/High, Close/Close MA Method: Simple, Exponential, Smoothed, Linear weighted. Color Positive Trend: 上昇トレンドの背景色 Color Negative Trend: 下降トレンドの背景色 Color Neutral Trend: 中立トレンドの背景色 Print all plots?: デフォルトでは、 インジケータ
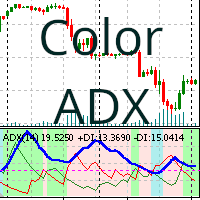
平均方向指数 ( Average Directional Movement Index - ADX) インジケーターは、トレンドの方向に応じて背景を色付けします。 ADXColor インジケーターは、 トレンドの強さを測定するために使用されるテクニカル インジケーターです。 インジケーターの背景色は、 そのパラメータによって決定され、 最後の 400 バーのみを描画します。 変更できるパラメータは次のとおりです。 Period : ADX インジケーターの期間。 Trend Level : ADX インジケーターが上昇トレンドまたは下降トレンドと見なされるために到達する必要のある最低レベル (デフォルトでは 0. 0)。 Apply To : インジケーターを適用する価格 ( Close price, Open price, High price, Low price, Median price, Typical price, Weighted price )。 Color Positive Trend : 上昇トレンドの背景色。 Color Negative Trend : 下降トレ
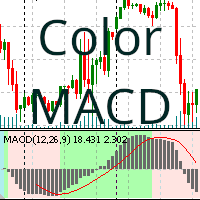
MACD インジケータと買い/売り傾向の背景色
このインジケータは、MACD (Moving Average Convergence Divergence) インジケーターの値に基づいて、チャート背景を色付けします。その買い/売り傾向によってです。背景色は、ストキャスティクオシレーターのパラメータによって決定され、最近の 400 バーのみを描画します (注を参照)。これは、トレンドの強度と反転の可能性を測定するために使用されます。
変更できるパラメータは次のとおりです。
Fast EMA: 短期間の指数平滑移動平均の期間。 Slow EMA: 長期間の指数平滑移動平均の期間。 MACD SMA: MACD シグナルラインを計算するための単純移動平均。 Apply To: (Close price, Open price, High price, Low price, Median price, Typical price, Weighted price). Color Positive Trend: 上昇トレンドの背景色。 Color Negative Trend

Introducing Market Structure AIO: The Smart Money Concepts Mastermind Tired of chasing false signals and battling market confusion? Introducing Market Structure AIO, the all-in-one indicator powered by Smart Money Concepts, designed to unravel market structure, identify high-probability trade opportunities, and empower you to trade with confidence. What is Market Structure AIO? A comprehensive Smart Money Concepts toolkit: Analyze market structure, identify imbalances, and anticipate price

Just an excellent arrow indicator with 96 percent accuracy. It uses trend moving averages to detect trend direction change and alert with corresponding arrow. It does not repaint and the alert is optional on the basis of current bar or previous bar. Please this indicator is not responsible for every of your trading position and it must be used in conjunction with other indicators to make trading.

تمكين الصفقات الخاصة بك مع مؤشر الأمل الجيد تحقيق التكامل لنقاط دخول قوية إذا كنت تبحث عن طريقة لتحسين تداولك في الفوركس، فإن مؤشر الأمل الجيد موجود هنا لإرشادك. يتميز هذا المؤشر بقدرته على الدمج الفعال لمختلف المؤشرات المعروفة، مما يؤدي إلى نقاط دخول قوية وتحليل شامل للسوق. ما الذي يميز الأمل الجيد؟ <أ ط=0>1. تكامل المؤشر: تتفوق شركة Hope Good في استخدام مجموعة متنوعة من المؤشرات المعروفة ودمجها بشكل فعال، مما يوفر لك تحليلًا شاملاً للسوق. <أ ط=0>2. نقاط الدخول القوية: يعمل المؤشر على توليد نق

(first and original) MOLFAR – a new price rebound indicator algorithm .
NON-REPAINTING - it has appeared and will remain! NON-LAGGING - appears on time!
We really worked on the algorithm of this indicator for a long time.
It is unique, you can make sure of it both in the free version on the tester and in the full-fledged version on your account.
Description, settings and other interesting things about the MOLFAR indicator can be found here .
MOLFAR uses technical analysis, calcul

Introducing our cutting-edge product, an innovative MACD Oscillator with a dynamic level enhanced by a decimal point Moving Average (MA) also with the versatility of multiple moving average modes. This advanced trading tool brings precision and flexibility to your technical analysis, offering a seamless experience for traders seeking a competitive edge in the financial markets.
Key Features: Dynamic Level Precision Our MACD Oscillator is equipped with a dynamic level feature, providing traders
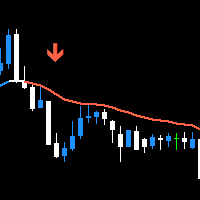
Trend Swift is the trend finding indicator that can estimate the trend volume for you. It help you seeking for the possible trend reversal so you can enter the trade with confident. Because it's indicator you can trade with your decision and really safe to use with any Prop Firms without worry about the rule that doesn't allowed to use EA to trade. This indicator isn't the the normal indicator that just blindly follow EMA, it's the trading system that surely find major trend with EMA but measur
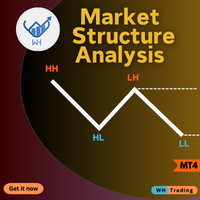
Are you tired of missing crucial market movements? Do you wish for a tool that not only identifies swing points but also provides insights into price action movements?
Look no further – our Market Structure Analysis indicator is here to revolutionize the way you analyze markets on MQL5! MT5 Version : WH Market Structure Analysis MT5 Key Features:
Swing Point Detection: Our indicator excels at identifying significant swing points in the market, helping you understand key turning points with p

クリスマスセール!40% OFF!1月1日に価格が$250に値上がり!
GoldenGate Entriesをご紹介します:最先端のトレーディングソリューション!
GoldenGate Entries(GGE)を使用して取引する革新的なアプローチを発見しましょう。GGEは、取引体験を向上させるために設計された先進的なインジケーターで、ユーザーに正確性と自信を持たせるための包括的な機能を提供します。
通貨ペア:Any(FX - 商品 - 株式 - 株式 - クリプト)
タイムフレーム:15分からH1
主な特徴:
買いと売りの矢印の指示:常に情報を受け取るために、買いと売りの矢印の指示をポップアップアラートとともに受け取ります。
GoldenGate_Algo:GoldenGate_Algoを使用して市場の状況を把握し、市場が「売り過ぎ」または「買い過ぎ」かどうかを評価する強力なツールです。
現在のトレンド分析:視聴中のタイムフレームで現在のトレンドにアクセスして、取引を市場の主流方向に合わせることができます。
組み込みのピボットポイント:組み込まれた
Simple but effective entry improving indicator that you want to use. Combine with other indicators and your trading strategies. Explore different ways to use it and find your perfect entry.
Basic instructions: Buy Signal Example: colour change from red to green Sell Signal Example: colour change form green to red
Check screenshots below for examples of use.

これにはフラクタルがまだ閉じる必要があるため、切り替えられてフラクタルが閉じていない場合はインジケーターが再計算されます。 それがまさにフラクタルの性質です。 ゾーン内取引は需要と供給の指標として非常に人気があり、金融市場内の主要な取引ゾーンを特定するのに有効であることで知られています。 以前に識別されたゾーンの再描画や消去でしばしば問題に直面したこのインジケーターのオリジナル バージョンとは異なり、この改善された反復により、過去のデータを通じてゾーンが確実に表示されたままになり、重要なサポートとレジスタンスのレベルを正確に特定する際にトレーダーに明確な利点が提供されます。
この指標の主な機能は、市場内の需要と供給のダイナミクスの概念を中心に展開されます。 これは、買い圧力と売り圧力の間に重大な不均衡があり、トレーダーの潜在的な転換点や関心レベルにつながる領域を特定します。 以前に識別されたゾーンが消えたり移動したりする再描画の一般的な問題を回避することで、トレーダーはインジケーターの過去の精度を信頼して情報に基づいた取引の決定を下すことができます。
基本的に、ゾーンでの取引

Currency Smart Scalper インジケーターは、EURUSD 通貨ペアと H1 時間間隔用に特別に設計された新世代のトレンド インジケーターです。 この強力なツールは市場を自動的に分析し、取引の開始と終了のシグナルを提供します。 Currency Smart Scalper は、一目、パラボリック SAR、ボリンジャー指標を使用して、外国為替市場での取引に比類のない効率を提供します。 チャンネルに登録して、インジケーターやその他の取引関連トピックについてさらに詳しく学びましょう。 このインジケーターの主な利点は、正確なシグナルです。 ソース指標の包括的なデータ分析のおかげで、Currency Smart Scalper は市場への参入と市場からの撤退のための信頼できるシグナルを提供することができます。 これにより、トレーダーは取引の意思決定を行い、収益性の高い取引のための正確な予測を行うことができます。
このインジケーターは、シグナルを矢印の形で視覚的に表示することで、いつ取引を開始および終了するかを迅速かつ簡単に理解することができます。 さらに、当社のインジケー
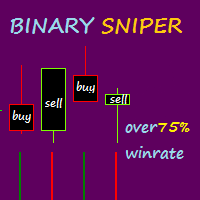
Binary Sniper は、バイナリー オプション取引に売買シグナルを与える mt4 インジケーターです。このインジケーターには異なるアプローチがあります。 バイナリー オプション取引に対して、このインジケーターはシグナルを再描画したり遅延したりしません。 エントリールール: 1. CALL (BUY) 、赤いローソク足が赤だった後に緑のバイナリスナイパーバーカラーで閉じるとき。(最初のカラー反転) 2. PUT (SELL) 、緑のローソク足が緑だった後、赤のバイナリ スナイパー バーの色で閉じるとき (最初のカラー反転)。 このインジケーターは価格アクション/出来高およびローソク足パターンに作用するため、設定は制限されています。

Introducing our advanced MQL4 Indicator, a groundbreaking tool for identifying support and resistance zones with unmatched precision. Elevate your trading strategy with a host of features, including a dual-color upper and lower box system that allows for easy visual recognition of market trends.
Key Features: Dual-Color Box for the Support and Resistance Zones Customize your analysis with dual-color box. The upper and lower boxes offer distinct colors, providing a clear visual representation o
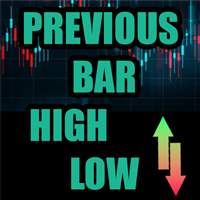
このインジケーターは、トレーダーの要件に従ってチャートをよりクリーンにするために有効/無効にできる最大6つのレベルをプロットします
これらの6つのレベルは2つのセットにあります:高と低
セットごとに、異なる時間枠を選択できます
価格が日次、週次、または月次の高値に達すると、通常5分などの短い時間枠で価格が拒否されると考えられるため、これは以前の高値と安値の反転の戦略に基づいています。
特徴 :
-単一のチャートで最大6つの時間枠の高値と安値を追跡します
-これらのレベルにアラートを設定します。メール、プッシュ、またはターミナルアラート。価格がこれらのレベルに達すると、即座にアラートが送信されます。
-線のスタイル、幅、色など、レベルのスタイルをカスタマイズします
-シフト:2日目または3日目の高低を追跡または調査したいですか?シフトは、2番目のバーの高低の場合は2に、3番目のバーの高低の場合は3に設定できます。

Cobra Pivot Points は、最適化されたピボット ポイントをプロットするためのインジケーターであり、デモをダウンロードすることで自分でバックテストできます。
1. 2 つの最適なピボット モードを選択します: Cobra ピボットまたは Camrilla ピボット
2. D1 に限定されず、任意の時間枠を使用できます。
3. Shiftパラメータを使用して、前日の高値安値終値を操作できます。 1 = 前のバー、2 = 前のバーなど。これらのパラメーターは、ピボットの研究開発に役立ちます。
4. レベルがタッチされると、アラート、電子メール、またはプッシュ通知が送信されます。 レベルに達すると、ピボット レベルは緩和されたとみなされ、再度警告されなくなります。 再度アラートが必要な場合は、時間枠を変更してアラートをリセットする必要があります。
5. 線の色、線のスタイル、線の幅、文字の色、フォントを完全にカスタマイズします。
コブラピボットは、LZone (スキャルピングに非常に近いレベル)、NZone (市場が統合しているとき)、H

Introducing our revolutionary intra-day trading indicator, meticulously crafted to optimize your trading insights within the 24-hour market cycle. Immerse yourself in historical data with precision using two distinctive modes - "All History" and "Last X Hours."
Key Features: All History Mode Uncover a comprehensive view of the day's dynamics. Instantly analyze the preceding day's high and low, 50% mid-point, and the open versus close price for the current day. Decode critical patterns to infor

An extended version of the indicator for visualizing the time ranges of key trading sessions: Asian, European and American. The main advantage of this indicator is the automatic construction of a price profile for a trading session. The indicator has the functionality to set the start and end time of each trading session, as well as automatically determine the time zone of the trading server. The indicators include the ability to work with minimal CPU usage and save RAM. In addition, the option

矢印インジケーター「クールボリューム」は、Mt4のティックボリュームに基づいています。
インジケータ自体は、一定期間(時間枠の選択)で購入または売却するボリュームの数を追跡します。 そして、売り手または買い手の量が異常に過剰になると、それは売るか買うためのシグナルを与えます。
色付きのヒストグラムは下のウィンドウに描かれており、緑色は現時点での買い手の優位性を示しています。これは、この価格帯で増加する可能性のある即時の逆転を意味します。 逆に、赤い色は売り手の優位性を示しており、これは潜在的な即時の下向きの逆転を意味します。
また、視覚的な利便性のために、矢印がメインチャートウィンドウに直接追加されました。
ユーザーの便宜のために、外部変数には、信号の周波数と履歴(HistoryBars)上のそれらの数の設定変数が含まれています。 ただし、値を1000を超えるように設定することはお勧めしません。 これの多くはあなたの端末のパフォーマンスを遅くします。
また、"===<<矢印設定>>>==="セクションでは、任意の矢印とヒストグラムパラメータを自分で設定することがで

MT4用外国為替インジケーター「WPRと2つの移動平均」
WPR自体はスキャルピングに最適なオシレーターの1つです 「WPR と 2 つの移動平均」インジケーターを使用すると、WPR オシレーターの高速移動平均と低速移動平均を確認できます。 インジケーターは価格修正を非常に早い段階で確認する機会を提供します このインジケーターはパラメーターを介して設定するのが非常に簡単で、任意の時間枠で使用できます。 写真で売買エントリー条件を確認できます。 買い(売り)シグナル条件を考慮してください。 (1) -高速 MA が低速 MA を上向き (下向き) に交差し、WPR 値が -50 値を下回っている (上): 買い(売り)取引を開始する (2) - WPR 値が -20 を超える買われ過ぎゾーン (-80 を下回る売られ過ぎゾーン): 買い (売り) 取引から終了
// さらに優れたエキスパートアドバイザーとインジケーターはここから入手できます: https://www.mql5.com/en/users/def1380/seller // また、収益性が高く、安定していて信頼でき

The Trend Analysis Indicator is an innovative tool designed for traders and investors who seek to navigate the complexities of the financial markets with greater precision and insight. This powerful indicator is engineered to adeptly identify whether a market is trending or not, offering users a vital edge in their trading strategy. Key Features: Accurate Trend Detection : The core functionality of the Trend Analysis Indicator lies in its ability to accurately detect market trends. It analyzes p
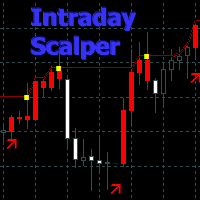
An automatic trend indicator that uses an algorithm to determine impulse signals for scalping and intraday trading.
The trend-following indicator automatically calculates potential entry and exit points for trades.
The indicator contains a trend line and a target channel for following signals, changing color depending on the direction.
Main characteristics
Signal colored candles and arrows: blue - downward direction, red - upward direction. Yellow dots for exiting trades are located along

Introducing our groundbreaking indicator designed to elevate your trading strategy! Unlock the power of precise volume analysis with Buy, Sell, and Neutral indicators. Tailor your approach with customizable levels based on timeframes and moving average methods.
Key Features: Dynamic Volume Insights Instantly identify Buy, Sell, and Neutral volumes for informed trading decisions. Gain clarity on market sentiment like never before. Adaptable Level Configuration Customize and adapt levels to matc

LLAMA stands for Lag-Less Adaptive Moving Average it is a state of the art moving average that is very close to the price, specially those sudden moves that put every typical moving average away from the price. This finding comes from the latest research in adaptive moving averages, with a lag close to 0
This MA keeps a very high smoothing ability while keeping a lag almost null.
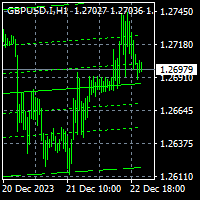
To get access to MT5 version click here . This is the exact conversion from TradingView: "Linear Regression Channel" by "LonesomeTheBlue". This is a repaint indicator. Buffers are not available for processing. You need to parse objects on chart. All input fields are available. You can message in private chat for further changes you need. Thanks for downloading
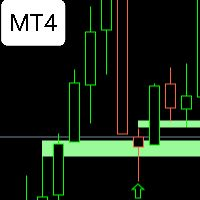
FVG WATCHER is an indicator that helps traders identify fair value gaps in the market. The indicator draws fair value gaps and alerts the user when the fair value gap has been swept. It allows users to specify how it should be swept, what time range to alert, and the size of the fair value gap to alert. It also allows the user to apply a moving average trend filter for better choice of alerts. The indicator also allows push mobile notifications. What makes FVG Watcher special is that it can be
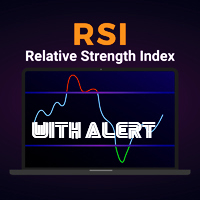
Indicador Universal RSI con Alertas de Oportunidad Este indicador para MetaTrader ha sido meticulosamente diseñado para adaptarse a todos los periodos de tiempo, proporcionando una herramienta versátil para los operadores de todos los niveles. Basado en el índice de fuerza relativa (RSI), este indicador destaca oportunidades potenciales en el mercado y te notifica de manera instantánea a través de alertas personalizadas. Características Principales: Universalidad de Periodos de Tiempo: Funciona
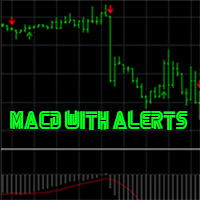
Indicador de Oportunidades MACD en Tiempo Real con Alertas de Precisión Descubre un indicador excepcionalmente preciso diseñado para potenciar tu experiencia de trading. Basado en el Moving Average Convergence Divergence (MACD), este indicador ofrece señales nítidas y oportunas, mejorando tu capacidad para identificar puntos de entrada y salida estratégicos. Además, este potente instrumento te mantendrá informado con alertas en tiempo real, proporcionándote una ventaja competitiva en los mercado
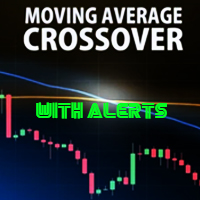
Descubre una nueva dimensión en el análisis técnico con CrossAlert MA, un poderoso indicador basado en cruces de medias móviles con funciones de alerta incorporadas. Diseñado para MetaTrader 4, CrossAlert MA utiliza la estrategia de cruce de medias móviles para identificar cambios significativos en la dirección del precio, proporcionando señales claras y oportunas. Características Principales: Cruces de Medias Móviles: CrossAlert MA aprovecha la potencia de los cruces de medias móviles para iden

PrecisionBands Descripción: Explora el mundo del trading con mayor precisión utilizando PrecisionBands, un indicador avanzado basado en las famosas Bandas de Bollinger. Diseñado para MetaTrader 4, PrecisionBands combina la versatilidad de las bandas de volatilidad con marcadores nítidos de señales de compra y venta, proporcionando una herramienta esencial para los traders que buscan tomar decisiones informadas. Características Principales: Bandas de Bollinger Mejoradas: PrecisionBands utiliza al

Introducing our groundbreaking indicator designed to elevate your trading experience by employing a unique fusion of price and time calculations. This innovative tool goes beyond traditional methods, utilizing advanced algorithms to draw levels and determine the authenticity of market peaks. Welcome to a new era of precision trading with our [Indicator Name]! Key Features: Price and Time Calculations: Harnesses the power of sophisticated price and time calculations to identify key levels on the

Introducing our cutting-edge indicator, designed to revolutionize your trading approach by capturing trends at a unique 90-degree angle. The [Indicator Name] is a powerful tool that automatically draws trend lines, providing a visual representation of extended trends for breakout strategy enthusiasts. Key Features: 90-Degree Angle Trend Lines: Identifies and draws trend lines at a precise 90-degree angle on the chart. Captures extended trends with mathematical accuracy, enhancing the visibility

Introducing our innovative trading indicator, designed to transform the way you analyze price movements. The [Indicator Name] goes beyond traditional methods by dynamically drawing two distinct trends on the chart. The space between these trends acts as a unique reflection surface, providing valuable insights into potential market reversals and trend continuations. Key Features: Dual Trend Drawing: Automatically draws two trends on the chart, creating a visually distinctive analysis of price mov

Unlock the secrets of the market with our groundbreaking indicator, [Univerasal Code], a fusion of astronomy strategy and numerology calculations. This unique tool revolutionizes your trading approach by dynamically drawing precise support and resistance levels on your MetaTrader charts. Key Features: Astro-Numerical Precision: Leverages advanced astronomy strategy and numerology calculations for unparalleled precision in identifying support and resistance levels. Unveils a strategic approach to

My indicator is 1000%, it never repaints, it works in every time period, there is only 1 variable, it sends notifications to your phone even if you are on vacation instead of at work, in a meeting, and there is also a robot version of this indicator With a single indicator you can get rid of indicator garbage It is especially suitable for scalping in the m1 and m5 time frames on the gold chart, and you can see long trends in the h1 time frame.
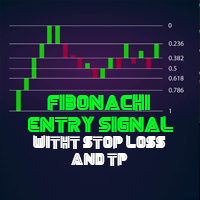
Indicador Trend and Fibonacci ProTrader Mr Beast El Indicador Fibonacci ProTrader v1.0 es una potente herramienta diseñada para optimizar tus estrategias de trading en MetaTrader, aprovechando la precisión y la lógica de la secuencia de Fibonacci. Este indicador incorpora señales avanzadas de take profit, tendencia take profit y stop loss, proporcionando una guía estratégica sólida para tus operaciones. Características Principales: Secuencia de Fibonacci Dinámica: El indicador traza automátic

ndicador ADX Crossing Alertby Mr Beast El Indicador ADX Crossing Alert v1.0 es una herramienta avanzada diseñada para potenciar tu análisis técnico en MetaTrader, centrándose en las señales generadas por el cruce del Indicador de Dirección del Movimiento (ADX). Este indicador ofrece alertas visuales en el gráfico y la conveniencia de alertas via email, permitiéndote estar siempre al tanto de las oportunidades de trading. Características Destacadas: ADX Crossing Signals: El indicador utiliza el c

The PUA MultiType Pivot indicator is built on the daily chart of the previous day. The PUA MultiType Pivot indicator is one of the most popular tools in technical analysis, used by traders to identify potential reversal points in financial markets. This indicator constructs three types of Pivot points: Classic, Fibonacci, and Camarilla, each offering its unique approach to market analysis. The advantages of this indicator include: Simplicity and Clarity PUA MultiType Pivot provides clearly defi

MTF Fair Value Gaps Alerts indicator is based on Fair Value Gaps (FVG), Volume imbalance (VI) and Gaps. This indicator will create 2 arrows pointing to the left showing the area of the FVG, VI and Gaps and will never repaint after the candle has been closed .
Inputs: TF (Timeframe of the Alert For Current timeframe use CURRENT)
barshilft : the barshift needs to be the same timeframe as the above TF. barshift format (CURRENT, M1, M5, M15, M30, H1, H4, D1, W1, MN) Send Email: Audible Alert Push

トレーディングの世界では、45度の角度をたどるトレンドは持続可能であると考えられている。 しかし、この重要な角度を正確に測定することは、明確な方法が記載されていないため、依然として難しい。トレーダーは、この角度の計算方法、ローソク足の本数、適切なチャートのズームを推測するしかありません。
私たちはこの問題を解決し、すべての条件を論理的に定義しました。これは、サポート、ターゲット、全体的な動きなど、様々な市場要因の複雑な分析に基づいて45度のトレンドラインを視覚化するツールです。
45度線はトレードの神話や伝承とみなされがちですが、トレンド・アングル45は今や私たちのトレードの武器であり、機能する貴重なツールです。トレンドのニュアンスを反映し、トレンドの始まりと終わりの変化を予測するその能力は トレンドの始まりと終わりの変化を予測する能力は、評価に理想的です。
まさに魔法のような時間です! さまざまな市場トレンドの深く正確な分析に直面することになります。 市場サイクルの間、価格は45度線の上下に動くことがあり、サイクルの異なる段階を示します。 トレンドの始まりでは、価格は

Created by imjesstwoone and mickey1984, this trade model attempts to capture the expansion from the 10:00-14:00 EST 4h candle using just 3 simple steps. All of the information presented in this description has been outlined by its creators, all I did was translate it to MQL4. All core settings of the trade model may be edited so that users can test several variations, however this description will cover its default, intended behavior using NQ 5m as an example. Step 1 is to identify our Price Ra

The indicator displays information on the chart about the average number of points per day the price of the instrument and the spread.
It differs from analogues in that it does not take into account huge or insignificant daily fluctuations, they are smoothed out, so in any situation it allows you to see the real picture, not distorted by random news bursts or days with "near zero" trading activity. How can the indicator be useful? 1. Assistance in choosing charts for trading with the required v
FxTDR is a bespoke technical indicator tailored for analyzing asset prices. The primary objective of this indicator is to identify favorable entry points for trading on selected currency pairs. It employs a set of criteria to detect optimal trading opportunities within the chosen time frame.
Key Features: 1. Entry Point Detection: Pinpoints favorable trade conditions. 2. Arrow Signals: Provides visual cues for identified opportunities. 3. Push Notifications: Real-time alerts for timely awaren

#WinPlus Trend and Entry Indicator
Unlock the power of precision in your trading with WinPlus, a bespoke technical indicator designed for financial assets. This indicator is meticulously crafted to discern trends and pinpoint entry opportunities across a diverse range of currency pairs on the h4 Timeframe. WinPlus analyzes price movements and utilizes our advanced algorithms to identify trends. When an optimal entry point is detected, the indicator generates clear arrow signals on the chart.
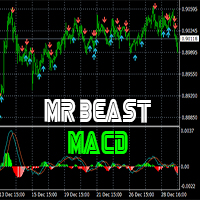
MR BEAST MACD Momentum Signals BUY SELL es una poderosa herramienta diseñada para optimizar las decisiones de trading al identificar oportunidades clave de compra y venta en los mercados financieros. Basado en el popular indicador MACD (Moving Average Convergence Divergence), este sistema utiliza algoritmos avanzados para generar señales precisas que reflejan cambios significativos en la dinámica del mercado. Características Destacadas: Señales de Compra y Venta Precisas: El Indicador MACD Mo

フォースディレクショナルインジケーター フォースディレクショナルテクニカルインジケーターは、価格の動きの相対的な強さを測定するのに役立つ要素のセットを組み合わせるアイデアに基づいています。同時に、トレンドの方向性を特定および追跡するのに使用できます。 このインジケーターは、遅いオシレーター(黒線)、速いオシレーター(灰色線)、および信号線として機能する指数の中央線から構成されています(青線)。これは動きの逆転を識別し、方向ガイドとしても機能します。インジケーターのオシレーターは、価格の最後のクローズと前のクローズを異なる期間と時間枠で比較し、100の値の上または下を移動します。 このインジケーターは特にトレンドの逆転を識別するのに効果的であり、任意の時間枠で成功裡に使用できます。ただし、より正確に動きやトレンドの強さを評価するために、より長い時間枠で使用することをお勧めします。 使用方法: 推奨される戦略は、遅いオシレーターが値が100未満の状態で上向きに信号線をクロスした場合はロングに入り、値が100を超える場合はダウンにクロスした場合はショートに入ることです。値の拡張が大きいほど、

The GGP SuperTrend MT4 Indicator is a technical analysis tool that can assist investors in identifying market trends. The indicator is based on ATR and is very useful for capturing the direction of an asset’s momentum and is widely employed when looking at stocks, currencies, and commodities. It plots a line on the price chart, which acts as a dynamic level of support or resistance, helping traders and investors make informed decisions about entry and exit points. This indicator is MT5 conversi

"MR BEAST ELLIOT WAVES" para MetaTrader: Transforma tu Trading con Precisión y Generosidad El indicador "MR BEAST ELLIOT WAVES" para MetaTrader es una herramienta innovadora que combina la precisión de las ondas de Elliott con la filantropía de Mr. Beast. Diseñado para traders de todos los niveles, este indicador proporciona una visión clara de las oscilaciones del mercado, identificando patrones de manera efectiva. Características Principales: Ondas de Elliott Simplificadas: El indicador visual

El indicador "MR BEAST PATTERNS WITH ALERTS" es una herramienta avanzada diseñada para identificar y notificar automáticamente patrones de oportunidad en el mercado financiero. Basándose en una combinación de análisis técnico y algoritmos inteligentes, este indicador escanea constantemente el gráfico en busca de patrones específicos que podrían indicar momentos propicios para la toma de decisiones. Características Principales: Detección de Patrones: El indicador identifica patrones de oportunida

Indicador "Candlestick Alert Pro" para MetaTrader: Maximiza tu Trading con Alertas de Patrones de Velas El indicador "Candlestick Alert Pro" es una herramienta esencial para traders que desean potenciar su análisis técnico, identificando patrones de velas clave y recibiendo alertas estratégicas en tiempo real. Compatible con MetaTrader, este indicador proporciona una visión detallada de la acción del precio, permitiendo decisiones informadas y oportunas. Características Destacadas: Identificació

Asesor Experto "MR BEAST MIN MAX Price Extremes Master": Potencia tu Trading con Precisión en Mínimos y Máximos El asesor experto "Price Extremes Master" redefine la toma de decisiones en el trading al basarse en los precios mínimos y máximos del mercado. Este innovador asesor utiliza algoritmos avanzados para identificar oportunidades estratégicas en los puntos extremos de precios, permitiendo a los traders capitalizar las fluctuaciones del mercado de manera eficaz. Características Destacadas:

LLAMA MACD has been made from the same formula that creates regular MACD. The only difference is that both smoothing alogrithms has been replaced by the LLAMA (LagLess Adaptive Moving Average)
Main parameters are the same : 2) LLAMA Period (Fast) 1) LLAMA Period (Slow) 3) LLAMA Signal Period
and the LLAMA Parameters are the same as with the single AMA: 1) ActiveBar : computes last bar as well in Realtime (higher CPU usage) 2) ATRPeriod 3) ATRDistMul =: Multiplier1 (Detect) 4) ATRDistMul2 :
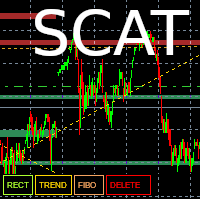
This tool allows you to draw trend lines, polarity zones, supports and resistances, Fibonacci retracements and save them. The user has 4 buttons which are displayed in their default configuration at the bottom left of the main window :
- A "Level" button allowing you to draw support and resistance zones
- A “Trend” button allowing you to draw a trend line
- A “Fibo” button allowing you to display a Fibonacci retracement
- A “DELETE” button which allows you to delete the selected object.

Indicator Name: SignalPro Serro Buy Sell Arrows Description: SignalPro Serro Buy Sell Arrows is a powerful and user-friendly MQL4 indicator designed to enhance your trading experience by providing clear and accurate signals for market sell opportunities. Developed with precision and reliability in mind, this indicator is a valuable tool for both novice and experienced traders. Key Features: Buy and Sell Arrows: The indicator displays clear buy and sell arrows on the chart, making it easy for tra

LLAMA BB has been made from the same formula that creates regular BB. The only difference is that the smoothing alogrithms have been replaced by the LLAMA (LagLess Adaptive Moving Average)
Main parameters are the same :
2) LLAMA Period
1) STDDEV Period
3) STDDEV Multiplier
and the LLAMA Parameters are the same as with the single AMA:
1) ActiveBar : computes last bar as well in Realtime (higher CPU usage)
2) ATRPeriod
3) ATRDistMul =: Multiplier1 (Detect)
4) ATRDistMul

Старый, добрый "AP" в версии трендового осциллятора. Это простой индикатор, который использует максимум возможностей языка MQL4. Но при этом он работает достаточно быстро даже на процессорах 1 Гигагерц и менее. При анализе следует обращать внимание на пересечение уровня 50, если вы намеренны использовать его как трендовый индикатор. Индикатор не перерисовывает, и работает на всех типах графиков и таймфреймах. Сделаны основные возможности оповещения, оповещения работают в обоих направлениях

残り20日です! 生涯アクセスを 確保するチャンスを逃さないでください たったの$69で。 MQL5のシルバー賞を受賞した開発者が精密に設計したHydra Trend Riderインジケーターで、あなたのトレーディング体験を向上させましょう。比類なき市場の洞察を提供し、意思決定プロセスを強化するこの高度なツールは、トレーダーがトレーディング戦略において精度と効率を追求するための完璧な選択肢です。 MQL5チャンネル に参加する 当社の製品をご購入いただくと、 PDF形式の包括的なユーザーガイドをお送りします。ご購入後にお問い合わせいただければ、 迅速にユーザーガイドをお送りします。
インジケーターの特徴: マルチタイムフレームダッシュボード: 当社の洗練されたダッシュボードで、異なるタイムフレームにわたる市場の全体像を把握しましょう。短期的な変動や長期的なトレンドを分析する際にも、Hydraインジケーターは一瞬も見逃さないようにします。 強力なトレンドシグナル: 強力なトレンドシグナル機能で市場に先んじましょう。このツールは市場のトレンドを特定し、それを活用するのに役

All in one Indicator. Multiple market analysis tools. Non-Repaint Oscillator signals, Trend lines, Price channel, Fibonacci levels, Support and Resistance, Regression, Pivot levels, Candle Strength and Oversold/Overbought line detector. Includes buttons to hide or show. Advanced algorithms to detect important reversal points and draw trend lines or shapes automatically in appropriate areas. A simple and professional chart display, user friendly and easier to understand for faster and accurately

ForexAnalysis Indicator that shows a whole series of information that the broker doesn't tell me, i.e.: volumes, swaps, that is, what I spend every day to leave it open, then you see the pivot with a suggestion on the operation and the stop loss to adopt. We see that with this new indicator, when the price approaches the zero line of the trade, which is automatically suggested, generally with Price Action signals on the screen, we are at an advantage because in the lower bar we have an indicati

TradeMasterLiteのオリジナル製品です。インジケーターは基本的にMACDのコンセプトを使用していますが、異なるタイプの平均化手法によってその能力を強化しています。トレンドと反転の見極めに威力を発揮します。
以下は本家からの詳細です:
カスタマイズ可能なMACDインディケーターを紹介します: マルチタイムフレーム 異常なボラティリティを発見するための偏差バンド 9種類の移動平均 条件付きカラーリングとラインクロス 異常なボラティリティを発見するための偏差バンド: 乖離幅はシグナル線の周りにプロットされ、異常なボラティリティの期間を特定するのに役立ちます。MACD線が乖離帯の外側を横切ると、市場のボラティリティが上昇し、そ の方向に強いトレンドが形成される可能性を示唆します。
スクリプトでは、9種類の移動平均を使用できます。各移動平均はユニークな視点を提供し、市場トレンドを特定するた めに、さまざまなシナリオで使用できます。 SMA(単純移動平均): これは、選択した範囲の値の平均を、その範囲の期間数で計算します。 SMMA (Smoothed Moving
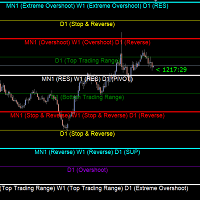
Gold Levels MTF - this is a fine stock technical indicator. The indicator algorithm analyzes the movement of the asset price, displays price levels of support and resistance from all time frames (TF) using the Murray method based on the Gann theory. The indicator indicates overbought and oversold fields, giving an idea of possible reversal points and at the same time giving some idea of the strength of the current trend. Description of levels: (Extreme Overshoot) - these levels are the ultimat

Gold Massive Arrow インジケーターをご紹介いたします。このインジケーターは、長期および短期のゴールドトレーダー向けに特別に設計されました。この先端のツールは、ゴールド市場での取引経験を簡素化し、多くのインジケーターが不要となる高確率のトレードシグナルを提供します。
全てのトレーダースタイルに対応するこの15分間のシグナルインジケーターは、1つのツール内で長期および短期のトレーダーが利益を最大化する可能性を提供します。
重要なのは、以下のインジケーターが含まれています:
赤い矢印 - 売りのシグナル 青い矢印 - 買いのシグナル
ゴールドトレーダーコミュニティに参加する貴重な機会をお見逃しなく。長期および短期のトレード戦略に特化した標準のチャートセットアップをご利用ください。
Gold Massive Arrow インジケーターを使用して自信を持ってトレードしましょう!

The 5X target indicator is an indicator that plots the optimal entry zone and the target for the trading day. It also plots a level where the stoploss can be moved to breakeven for a risk free trade which is 2X. This indicator has time window inputs. The default settings are from 02:00 to 19:00 CET+1 time zone. This indicator is based used with a direction bias for the day. I post the direction bias for several pairs in the comments section. Added a new feature Time Zone to help trade the highes

Exclusive Limited Time Offer! Grab this useful indicator for a lifetime at just $49. Volatility indicator dashboard designed to revolutionize how traders perceive and navigate market volatility. Track volatile for multiple currency pairs one at time for multiple timeframes. Works best with Forex Market, Gold, Silver, Oil. Available in MT4, MT5. Indicator Features: Multi-Symbol, Multi-Timeframe Dashboard: Gain a strategic advantage by simultaneously monitoring volatility across various currenc
MetaTraderマーケットは、開発者がトレーディングアプリを販売するシンプルで便利なサイトです。
プロダクトを投稿するのをお手伝いし、マーケットのためにプロダクト記載を準備する方法を説明します。マーケットのすべてのアプリは暗号化によって守られ、購入者のコンピュータでしか動作しません。違法なコピーは不可能です。
取引の機会を逃しています。
- 無料取引アプリ
- 8千を超えるシグナルをコピー
- 金融ニュースで金融マーケットを探索
新規登録
ログイン